 Fourplex
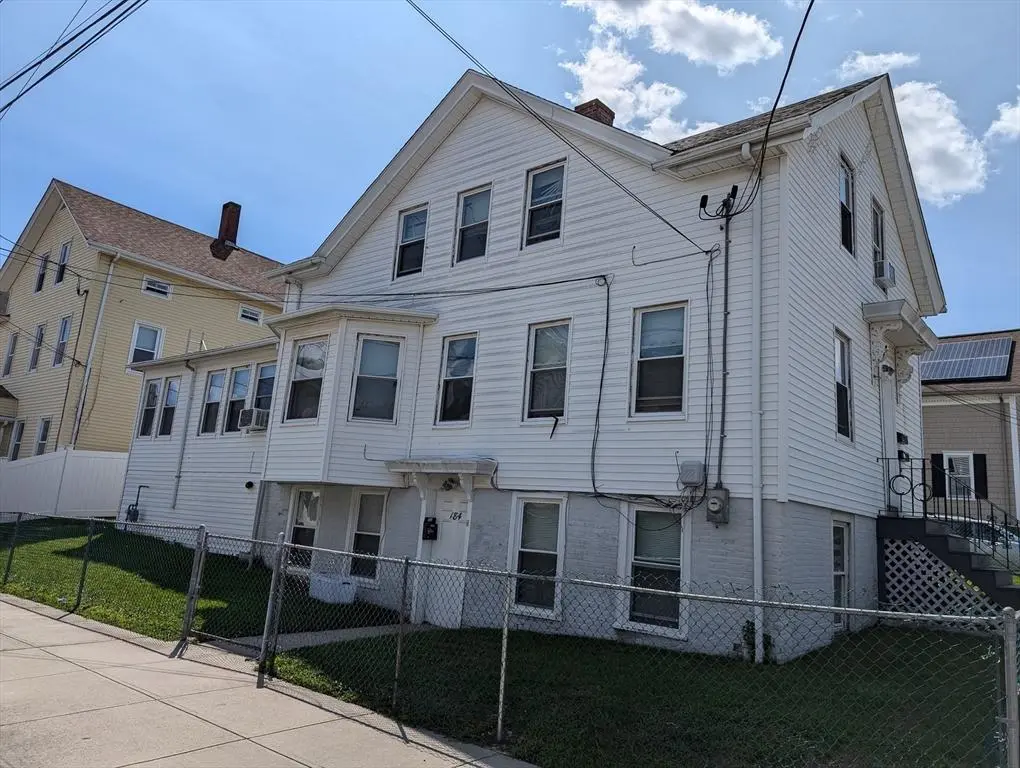
609 Cherry St · Fall River, MA
Flood risk 1/10 · Minimal
- FEMA flood zone
- X (unshaded)
- Chance of flooding over 30 yrs
- 0.0%
- Est. flood insurance / yr
- $473 – $860
Fire risk 1/10 · Minimal
- Est. fire insurance / yr
- $915 – $1,699
Heat risk 5/10 · Moderate
- Hot days now (above 96°F)
- 7 days/yr
- Hot days in 30 yrs
- 15 days/yr
Wind risk 8/10 · Major
- Chance of severe wind over 30 yrs
- 80.0%
Air-quality risk 3/10 · Minor
- Unhealthy air days now
- 3 days/yr
- Unhealthy air days in 30 yrs
- 3 days/yr
Risk factors via First Street. Map © Google.
Why this score? — see what drove the C+ grade
The composite is a weighted blend of 9 inputs, each scored 0–100. Each bar is that input's sub-score; the figure is the points it added to the 100-point composite (weight × sub-score).
- Cash flow +29.0/30.0
- DSCR +10.0/10.0
- 1% rule +7.3/10.0
- ARV discount +6.6/15.0
- Rent growth +3.9/5.0
- Livability +3.1/5.0
- Condition / age +2.5/5.0
- Schools +1.9/10.0
- Appreciation +0.0/10.0
$599,000
🖨 Deal sheet 📄 Offer letter ✓ Due diligence
Multi-family units
County records classify this as Multi-Family (5+ Unit). Listing-text estimate: 4 units. estimate disagrees with records
5+ unit building — per-unit beds/baths from public records are typically unavailable; the breakdown below (if shown) is an estimate from the listing text.
Listing remarks MLS
Great four family investment property. Three one bedroom units and one studio apartment. Currently, all four units are occupied. Off-street parking for 4 cars including a two car garage. Located on a corner lot close to a park. Gas and Electric are not separated and are paid by the owner.
Key facts
- Close to park
- Off-street parking
- Corner lot
Tags
Neighborhood map
What this means for you Summary
Snapshot
- This is a 3×3bd/1.0ba + 1×1bd/1.0ba units multifamily listed at $599k.
Deal economics
- At list price, monthly cash flow is $2k ($25k/yr) — positive. Per door: $511/mo.
- The deal already cash-flows at list — no discount required.
- Meets the 1% rule at list price ($7k rent vs $599k).
- Recommended offer: $563k (6.0% below list) — sets the bar for market timing.
- Cap rate 10.4% vs local median 3.6% in Fall River — top-decile yield for the area; either an underpriced asset or a hidden risk that comps aren't pricing in. Stress-test before assuming the spread holds.
Location & tenants
- Location reads 61/100 on livability (#221 in MA) — a middle-class / working-renter tenant base. Strengths: health & safety A+; Watch: cost of living D+, schools D, crime F.
- Fall River (suburban): math 17% / reading 28% proficiency, ranked #288 of 302 in MA (top 95%) — low school quality limits family demand, transient renter base, plan for 1-2y turnover; 68% free/reduced lunch — lower-income household profile, screen leases tightly.
- Market conditions: Rents rising fast (+5.8%/yr); 62 active listings in the ZIP; 760 units permitted in Bristol County in 2024 (142 in 5+ unit buildings).
- At $7,379/mo this rent would consume 142% of the median local household income ($62k/yr) (locally 2239% of renters already pay >50% of income on rent) — very limited rent-growth headroom before tenants either downsize or default.
Forward outlook
- Local home prices are declining (-3.0%/yr); year-one equity from $4k of loan paydown is wiped out by about $18k of value loss. Plan a longer hold.
- Bristol County population projected to shrink 3% by 2050 — rents likely to lag national; underwrite the cash flow, not the appreciation.
- At projected returns (-3.0% appreciation + 5.8% rent growth), your $168k cash investment doubles in ~7 years — after that, you're playing with house money.
Negotiation context
- It's been on market 64 days — a 6% lower offer ($563k) is reasonable based on typical stale-listing flexibility.
- 2 sale attempts since 23y ago with the ask held roughly flat each time — persistent listings suggest the price (not the market) is what's stuck; bring a comps-based counter.
- Current owner paid $240k; list at $599k implies a 150% gain — meaningful room to come down on a strong offer.
Risks & watch-outs
- Watch-outs: built in 1930 — expect roof / HVAC / electrical / plumbing capex.
- Climate carrying-cost: severe wind risk, 80% chance of damaging wind over 30y; extreme-heat days projected 7→15/yr by 2055 (HVAC capex compounding) — expect insurance premiums to compound above CPI over the hold.
Questions for the listing agent
- It's been on market 64 days. Have you received any prior offers? Is the seller open to a 6% concession, seller financing, or rate buy-down credit?
- Can we see the unit-by-unit rent roll, current vacancy, and any below-market leases? What's the average tenancy length?
- What capital expenditures (roof, boiler, parking lot, exteriors) have been made in the last 5 years, and what's planned in the next 2?
- Built in 1930 — when were the roof, HVAC, electrical panel, plumbing, and water heater last replaced?
- Why hasn't it sold? Are there any deal-killer items the seller is aware of (foundation, flood, title, zoning, code violations)?
- Is there a deadline driving the sale (1031 exchange, divorce, estate, relocation)? That informs how much negotiation room exists.
- Schools are D-rated, which usually means shorter tenancies and higher turnover. Who's the typical renter profile here, and what's been the actual vacancy rate?
- Crime grade is F in this area — have there been break-ins, vandalism, or insurance claims at this property in the last 3 years? What carrier currently insures it and at what premium?
- What's the average days-on-market for RENTAL listings here right now (not sales)? A rising rental-DOM trend means longer vacancies and softer asking-rent achievability than the comps imply.
- What's the recent tenant-quality profile in this submarket — average credit score on applications, eviction rate, late-payment / NSF rate, and stable-employment percentage? A property-management company in the area should have these aggregated.
- How much new apartment / multifamily construction is in the pipeline within 1–3 miles? Heavy new supply (>2% of stock underway) typically softens rents 12–24 months out; light construction supports rent growth.
Investment metrics
- 1% rule
- 1.23% ✓
- Cap rate
- 10.39%
- Cash-on-cash
- 14.62%
- DSCR
- 1.65
- GRM
- 6.8
CMA / ARV
- ARV (median comp)
- $587,731
- List price
- $599,000
- Delta
- 1.92%
- Verdict
- FAIR
- Comps
- 20 within 1.0 mi
Show comp detail 12 sales within ~0.75 mi
| Address | Dist | Beds/Ba | Sqft | Sold | Price | $/sf | Match |
|---|---|---|---|---|---|---|---|
| 862 Locust St | 0.24mi | 6/3.0 | 2,519 (+4%) | 4mo | $570,000 | $226 | 71 |
| 770 Locust St | 0.17mi | 5/3.0 (-1) | 2,285 (-6%) | 6mo | $625,000 | $274 | 65 |
| 163 Linden St | 0.03mi | 7/3.0 (+1) | 2,720 (+12%) | 6mo | $610,000 | $224 | 61 |
| 610 Walnut St | 0.15mi | 6/2.0 | 2,748 (+13%) | 3mo | $500,000 | $182 | 56 |
| 49 Plain St | 0.44mi | 6/3.0 | 2,567 (+6%) | 12mo | $510,000 | $199 | 52 |
| 45-47 Shawmut St | 0.36mi | 6/2.0 | 2,760 (+14%) | 3mo | $650,000 | $236 | 46 |
| 22 Danforth St | 0.51mi | 7/3.0 (+1) | 2,441 (+1%) | 20mo | $575,000 | $236 | 46 |
| 86 Newport St | 0.71mi | 5/2.0 (-1) | 2,352 (-3%) | 0mo | $650,000 | $276 | 44 |
| 107 Danforth | 0.50mi | 6/3.0 | 2,671 (+10%) | 11mo | $630,000 | $236 | 43 |
| 104 5th | 0.58mi | 5/4.0 (-1) | 2,678 (+10%) | 9mo | $548,250 | $205 | 39 |
| 663-667 June St | 0.71mi | 6/3.0 | 2,560 (+6%) | 14mo | $705,000 | $275 | 38 |
| 602 Durfee St | 0.61mi | 6/3.0 | 2,314 (-5%) | 23mo | $590,000 | $255 | 37 |
Match score weights: distance 35% · size 25% · config 20% · recency 20%. Top-matched comps best support the ARV.
Projected returns pro-forma
-3.0% appreciation · 5.76% rent growth · sell at horizon
- IRR
- 8.0%
- Equity multiple
- 1.32×
- Total profit
- $54,013
- Equity at exit
- $89,313
- IRR
- 19.4%
- Equity multiple
- 2.82×
- Total profit
- $305,604
- Equity at exit
- $51,791
Cash invested: $167,720 (down + closing). Projections, not guarantees.
Landlord ↔ Tenant lean methodology
- Overall (STATE)
- 20 Strongly Tenant-Friendly
- State Massachusetts
- 20 Strongly Tenant-Friendly · D+15
- County
- — inherits STATE
- City
- — inherits STATE
ZIP-level market 02720
- Home prices YoY
- -15.1%
- Rents YoY
- 5.8%
- Active inventory
- 62
- Price-to-rent
- 25.9×
Monthly cashflow live
- Estimated rent
- $7,379 high interval (Pro) →
- Mortgage (P&I)
- −$3,141
- Tax from tax record
- −$396 /mo · $4,746/yr
- Insurance
- −$250
- HOA
- −$0
- Vacancy / Maint / Mgmt
- −$1,550
- Net cashflow
- $2,043
Break-even live
4-unit breakdown (identical units grouped — click to expand)
| Units | Beds | Baths | Est. rent |
|---|---|---|---|
| 3× units | 3 | 1 | $5,778 |
| #1 | 3 | 1 | $1,926 |
| #2 | 3 | 1 | $1,926 |
| #3 | 3 | 1 | $1,926 |
| 1× unit | 1 | 1 | $1,601 |
| Total (4 units) | $7,379 | ||
UW: 25.0% down · 7.5% · 30yr · 1.5% tax · 5.0% vac · 8.0% maint · 8.0% mgmt
Financing live
Cash to close
- Down payment
- $149,750
- Closing costs
- $17,970
- Reserves months
- —
- Total cash needed
- —
Loan-product check · same deal, 3 products live
Conventional
25% down · 7.5% · 30yr
- Down + closing
- —
- Monthly P&I
- —
- Monthly cashflow
- —
- DSCR
- —
- Eligible?
- —
Personal DTI + credit; lowest rate.
DSCR
20% down · 8.5% · 30yr
- Down + closing
- —
- Monthly P&I
- —
- Monthly cashflow
- —
- DSCR
- —
- Eligible?
- —
No personal income docs; deal must DSCR.
Hard money
10% down · 12.0% · 12mo
- Down + closing
- —
- Monthly P&I
- —
- Monthly cashflow
- —
- DSCR
- —
- Eligible?
- —
Short-term bridge; refi at stabilization.
Listing history 22 events
-
2026-06-18days on market $599,000 Active 64 DOM
-
2026-06-18remarks 450-char remark
-
2026-06-17days on market $599,000 Active 63 DOM
-
2026-06-16days on market $599,000 Active 62 DOM
-
2026-06-15days on market $599,000 Active 61 DOM
-
2026-06-13days on market $599,000 Active 59 DOM
-
2026-06-09days on market $599,000 Active 55 DOM
-
2026-06-08days on market $599,000 Active 54 DOM
-
2026-06-07days on market $599,000 Active 53 DOM
-
2026-06-05days on market $599,000 Active 50 DOM
-
2026-06-03days on market $599,000 Active 49 DOM
-
2026-06-02days on market $599,000 Active 48 DOM
-
2026-06-01statusdays on market $599,000 Active 47 DOM
-
2026-05-31days on market $599,000 Price Changed 46 DOM
-
2026-05-05price $620,000 289-char remark
Show marketing remark (289 chars)
Great four family investment property. Three one bedroom units and one studio apartment. Currently, all four units are occupied. Off-street parking for 4 cars including a two car garage. Located on a corner lot close to a park. Gas and Electric are not separated and are paid by the owner.
-
2026-04-15$630,000 New 289-char remark
Show marketing remark (289 chars)
Great four family investment property. Three one bedroom units and one studio apartment. Currently, all four units are occupied. Off-street parking for 4 cars including a two car garage. Located on a corner lot close to a park. Gas and Electric are not separated and are paid by the owner.
-
2004-04-09soldstatus $240,000
-
2004-04-09soldstatus $240,000
-
2004-02-02soldstatus $185,000 158-char remark
Show marketing remark (158 chars)
THIS 4 FAMILY FEATURES VINYL EXTERIOR 2 CAR GARAGE, AND FENCED CORNER LOT. INTERIOR NEEDS WORK THROUGHTOUT. PRICED RIGHT. 2 UNITS RENTED AT 650.00 AND 400.00.
-
2004-02-02soldstatus $185,000
Show marketing remark (158 chars)
THIS 4 FAMILY FEATURES VINYL EXTERIOR 2 CAR GARAGE, AND FENCED CORNER LOT. INTERIOR NEEDS WORK THROUGHTOUT. PRICED RIGHT. 2 UNITS RENTED AT 650.00 AND 400.00.
-
2003-12-13historical 158-char remark
Show marketing remark (158 chars)
THIS 4 FAMILY FEATURES VINYL EXTERIOR 2 CAR GARAGE, AND FENCED CORNER LOT. INTERIOR NEEDS WORK THROUGHTOUT. PRICED RIGHT. 2 UNITS RENTED AT 650.00 AND 400.00.
-
2003-12-08$179,900 158-char remark
Show marketing remark (158 chars)
THIS 4 FAMILY FEATURES VINYL EXTERIOR 2 CAR GARAGE, AND FENCED CORNER LOT. INTERIOR NEEDS WORK THROUGHTOUT. PRICED RIGHT. 2 UNITS RENTED AT 650.00 AND 400.00.
ⓘ Source: listings_history table (triggers on properties + properties_extension) + one-shot
backfill from property_details.listing_events for pre-trigger history.
Tax reassessment forecast MA · Partial reset (capped growth)
- Current annual tax
- $4,746 · $396/mo
- Projected year-2 tax
- $6,057 · $505/mo
- Expected delta
- +$1,311/yr (+$109/mo · 27.6%)
ⓘ Screening estimate from a state-policy table — verify with the county assessor before closing.
Climate risk First Street
- Flood 1/10 Low FEMA zone X (unshaded) · 0% chance over 30 yrs
- Wildfire 1/10 Low
- Heat 5/10 Major 7 d/yr ≥96°F today · 15 d/yr by 30 yrs out
- Wind 8/10 Severe 80% chance of damaging wind over 30 yrs
- Air quality 3/10 Moderate 3 unhealthy d/yr today · 3 by 30 yrs out
Nearby sold comps map
Loading sold comps map…
Walkable amenities ~0.75 mi
Loading nearby amenities…
Taxation est. · year 1
- Rental income
- $88,548
- − Mortgage interest
- −$33,553
- − Property taxes
- −$4,746
- − Insurance
- −$2,995
- − Repairs & maintenance
- −$7,084
- − Management
- −$7,084
- − Depreciation
- −$17,425
- Taxable income
- $15,661
- Est. tax owed @ 24.0%
- −$3,759
- After-tax cash flow
- $20,759/yr
For passive investors: Depreciation is non-cash, so a rental often shows a tax loss while cash-flowing — sheltering income. Rental losses are passive: they offset passive income freely, and up to $25,000/yr can offset ordinary (W-2) income if you actively participate and your MAGI is under $100k (phasing out to $0 by $150k); unused losses carry forward. On sale, claimed depreciation is recaptured at up to 25%, and gains may owe capital-gains tax (a 1031 exchange can defer both). Figures are a year-1 estimate at your 24.0% rate — not tax advice; consult a CPA.
Schools (NCES district)
- District
- Fall River
- NCES district ID
- 2504830
- Math proficiency
- 17% ▼ -15.00%
- Reading proficiency
- 28% ▼ -6.00%
- Median HH income
- $35,773
- Composite
- 18.59/100
- National rank
- #8905
- State rank
- #288 of 302 in MA
Livability — Fall River
- Score
- 61/100
- State rank
- #221
- US rank
- #18220
Category grades
Schools grade is shown separately in the Schools card above.
Census & demographics
- Census place
- Fall River, MA
- County
- Bristol County · 342,083 people
- City population
- 93,033
- Metro
- Providence-Warwick, RI-MA
- Population (ZIP)
- 30,940
- Household income
- $62,196
- Rent vs Own
- Severe rent burden
- 2239.0
Population outlook (Bristol County) Hauer SSP2
- Today (2025)
- 570,212 people
- By 2030
- 571,181 · +0.2%
- By 2040
- 565,389 · -0.8%
- By 2050
- 552,141 · -3.2%
- By 2075
- 520,923 · -8.6%
- By 2100
- 474,363 · -16.8%
Race, ethnicity, and origin ACS 2023
- Neighborhood character
- Predominantly White (75%)
- Race & ethnicity
- White 75% Hispanic / Latino 11% Two or more races 8% Black 6% Asian 3%
- Hispanic origin (detail)
- Puerto Rican 5% Dominican 1%
- Common ancestry
- Russian 37% Lithuanian 7% Romanian 2%
- Foreign-born
- 21% · Canada, China, Jamaica
- Languages at home
- 66% English-only · Other Indo-European 21% Spanish 8% French/Haitian/Cajun 2%
Political lean MEDSL · Bristol
- 2024 margin
- Toss-up / Even · D 49.8% · R 48.5% · Other 1.8%
- 2008→2024 swing
- -21.9pp toward R · 2008: 23.2pp · 2024: 1.3pp
- All cycles
- 2024: D+1.3 2020: D+12.0 2016: D+9.3 2012: D+20.5 2008: D+23.2
Not yet ingested
- Civics
- —
Market trends
- HPI YoY
- ▼ -63.98%
- Current HPI
- 360.4882
- Rent YoY
- ▲ 5.76%
- Metro
- Providence-Warwick, RI-MA
- State GDP YoY
- ▲ 2.28%
- F500 in state
- 38
Industry mix (Fortune 500 HQ in MA)
| Industry | F500 HQs | Revenue |
|---|---|---|
| Technology | 3 | $17B |
|
||
| Insurance | 2 | $84B |
|
||
| Retail | 2 | $76B |
|
||
| Life Sciences | 1 | $43B |
|
||
| Energy Technology | 1 | $31B |
|
||
| Aerospace / Defense | 1 | $18B |
|
||
Price history
+244.6% since first listed8 events — show timeline
- 2026-05-05 Price Changed $620,000 MLS PIN
- 2026-04-15 Listed $630,000 MLS PIN
- 2004-04-09 Sold (Public Records) $240,000 Public Records
- 2004-04-09 Sold (Public Records) $240,000 Public Records
- 2004-02-02 Sold (Public Records) $185,000 Public Records
- 2004-02-02 Sold (MLS) $185,000 MLS PIN
- 2003-12-13 Listing Removed — MLS PIN
- 2003-12-08 Listed $179,900 MLS PIN
Property tax history
+6.3%/yrLatest (2023): $4,746 · +12.3% YoY. Source: county tax records.
Cash-flow waterfall
monthlySold comps — $/sqft
last 12 mo · ≤1 miLoading sold comps…