710 W Kohler St · Hebbronville, TX
Flood risk 1/10 · Minimal
- FEMA flood zone
- —
- Chance of flooding over 30 yrs
- 0.0%
- Est. flood insurance / yr
- —
Fire risk 5/10 · Moderate
- Est. fire insurance / yr
- $1,222 – $2,270
Heat risk 9/10 · Severe
- Hot days now (above 111°F)
- 6 days/yr
- Hot days in 30 yrs
- 18 days/yr
Wind risk 8/10 · Major
- Chance of severe wind over 30 yrs
- 94.0%
Air-quality risk 1/10 · Minimal
- Unhealthy air days now
- 0 days/yr
- Unhealthy air days in 30 yrs
- 0 days/yr
Risk factors via First Street. Map © Google.
Why this score? — see what drove the A- grade
The composite is a weighted blend of 9 inputs, each scored 0–100. Each bar is that input's sub-score; the figure is the points it added to the 100-point composite (weight × sub-score).
- Cash flow +30.0/30.0
- ARV discount +15.0/15.0
- 1% rule +10.0/10.0
- DSCR +10.0/10.0
- Appreciation +4.5/10.0
- Livability +3.1/5.0
- Schools +2.6/10.0
- Rent growth +2.5/5.0
- Condition / age +2.5/5.0
$60,411
🖨 Deal sheet 📄 Offer letter ✓ Due diligence
Listing remarks
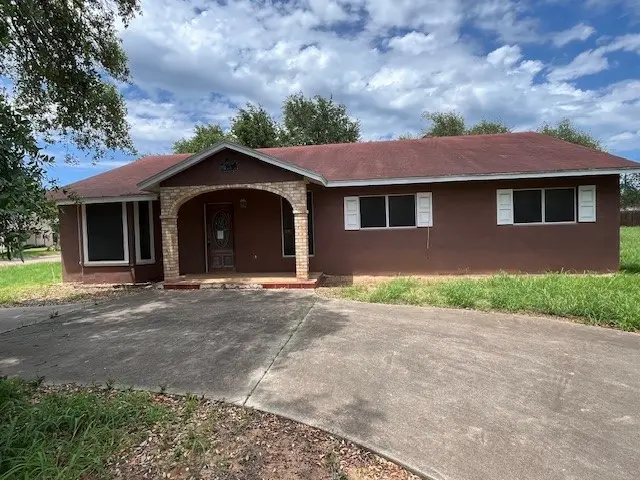
Discover the space and comfort this four-bedroom home offers, set on two generous lots that provide room to grow, play, or simply enjoy extra privacy. A circular driveway welcomes you home and adds convenient access for multiple vehicles. Inside, the living area features a wood-burning fireplace—a warm focal point for gatherings and cozy evenings. The layout offers flexibility. Located close to the school district, this property blends everyday convenience with the breathing room of oversized lots. Whether you’re looking for a primary residence or an investment opportunity, this home delivers a solid foundation with plenty of potential.
Key facts
- Oversized lots
- Circular driveway
- 0.39 acre lot
Tags
Property features AI
Exterior
- Parking: Attached carport; Front entry and rear/side/off-street parking; On-street parking; Asphalt surfaces; Total of 1 parking space
- Utilities: Public water; Public sewer; Sewer and water available
- Home design: Single-story home; Faces south; Slab foundation
- Construction: Brick and stucco construction; Shingle roof
- Exterior features: Corner and interior lot; Paved city street and all-weather road frontage; Lot dimensions approximately 120' x 140'
Interior
- Flooring: Ceramic tile; Tile
- Bathrooms: 2 full bathrooms
- Interior features: Open floorplan; Ceramic tile and tile flooring; Wood-burning fireplace
- Laundry & utility: Washer hookup; Dryer hookup
Neighborhood map
What this means for you Summary
Snapshot
- This is a 4-bed/2.0-bath single-family listed at $60k.
Deal economics
- At list price, monthly cash flow is $455 ($5k/yr) — positive.
- The deal already cash-flows at list — no discount required.
- Meets the 1% rule at list price ($1k rent vs $60k).
- Recommended offer: $60k (1.5% below list) — sets the bar for market timing.
Location & tenants
- Location reads 61/100 on livability (#1,032 in TX) — a middle-class / working-renter tenant base. Strengths: cost of living A+, housing A+; Watch: crime D+, schools D-, amenities F.
- Jim Hogg County ISD (town): math 31% / reading 31% proficiency, ranked #622 of 826 in TX (top 75%) — families likely to look elsewhere, expect single-tenant / working-renter base with shorter leases.
- Market conditions: 36 active listings in the ZIP.
Forward outlook
- Local home prices are declining (-0.9%/yr); year-one equity from $417 of loan paydown is wiped out by about $577 of value loss. Plan a longer hold.
- Jim Hogg County population projected at -10% by 2050 — secular population decline; favor cash flow + early exit over multi-decade hold.
- At projected returns (-0.9% appreciation + 3.0% rent growth), your $17k cash investment doubles in ~4 years — after that, you're playing with house money.
Negotiation context
- It's been on market 21 days — a 2% lower offer ($60k) is reasonable based on typical stale-listing flexibility.
- 3 sale attempts since 8y ago with the ask held roughly flat each time — persistent listings suggest the price (not the market) is what's stuck; bring a comps-based counter.
Risks & watch-outs
- Climate carrying-cost: severe wind risk, 94% chance of damaging wind over 30y; moderate wildfire risk; extreme-heat days projected 6→18/yr by 2055 (HVAC capex compounding) — expect insurance premiums to compound above CPI over the hold.
Questions for the listing agent
- Built in 1970 — when were the roof, HVAC, electrical panel, plumbing, and water heater last replaced?
- Is there a deadline driving the sale (1031 exchange, divorce, estate, relocation)? That informs how much negotiation room exists.
- Schools are D-rated, which usually means shorter tenancies and higher turnover. Who's the typical renter profile here, and what's been the actual vacancy rate?
- Crime grade is D in this area — have there been break-ins, vandalism, or insurance claims at this property in the last 3 years? What carrier currently insures it and at what premium?
- What's the average days-on-market for RENTAL listings here right now (not sales)? A rising rental-DOM trend means longer vacancies and softer asking-rent achievability than the comps imply.
- What's the recent tenant-quality profile in this submarket — average credit score on applications, eviction rate, late-payment / NSF rate, and stable-employment percentage? A property-management company in the area should have these aggregated.
- How much new for-sale + rental construction is in the pipeline within 1–3 miles? Heavy new supply typically softens prices + rents 12–24 months out; constrained supply supports both.
Investment metrics
- 1% rule
- 1.83% ✓
- Cap rate
- 15.33%
- Cash-on-cash
- 32.29%
- DSCR
- 2.44
- GRM
- 4.6
CMA / ARV
- ARV (median comp)
- $102,871
- List price
- $60,411
- Delta
- -41.27%
- Verdict
- UNDERPRICED
- Comps
- 14 within 1.0 mi
Show comp detail 2 sales within ~0.75 mi
| Address | Dist | Beds/Ba | Sqft | Sold | Price | $/sf | Match |
|---|---|---|---|---|---|---|---|
| 210 E Clayton St | 0.69mi | 3/2.0 (-1) | 1,770 (+11%) | 2mo | $155,000 | $88 | 43 |
| 601 N Dagmar Ave | 0.39mi | 4/2.0 | 1,835 (+15%) | 20mo | $120,000 | $65 | 41 |
Match score weights: distance 35% · size 25% · config 20% · recency 20%. Top-matched comps best support the ARV.
Projected returns pro-forma
-0.95% appreciation · 3.0% rent growth · sell at horizon
- IRR
- 31.2%
- Equity multiple
- 2.45×
- Total profit
- $24,577
- Equity at exit
- $14,711
- IRR
- 35.9%
- Equity multiple
- 4.77×
- Total profit
- $63,841
- Equity at exit
- $15,558
Cash invested: $16,915 (down + closing). Projections, not guarantees.
Landlord ↔ Tenant lean methodology
- Overall (STATE)
- 87 Strongly Landlord-Friendly
- State Texas
- 87 Strongly Landlord-Friendly · R+5
- County
- — inherits STATE
- City
- — inherits STATE
ZIP-level market 78361
- Home prices YoY
- -0.9%
- Active inventory
- 36
- Price-to-rent
- 4.6×
Monthly cashflow live
- Estimated rent
- $1,105 medium interval (Pro) →
- Mortgage (P&I)
- −$317
- Tax est. 1.5%
- −$76 /mo · $906/yr
- Insurance
- −$25
- HOA
- −$0
- Vacancy / Maint / Mgmt
- −$232
- Net cashflow
- $455
Break-even live
UW: 25.0% down · 7.5% · 30yr · 1.5% tax · 5.0% vac · 8.0% maint · 8.0% mgmt
Financing live
Cash to close
- Down payment
- $15,103
- Closing costs
- $1,812
- Reserves months
- —
- Total cash needed
- —
Loan-product check · same deal, 3 products live
Conventional
25% down · 7.5% · 30yr
- Down + closing
- —
- Monthly P&I
- —
- Monthly cashflow
- —
- DSCR
- —
- Eligible?
- —
Personal DTI + credit; lowest rate.
DSCR
20% down · 8.5% · 30yr
- Down + closing
- —
- Monthly P&I
- —
- Monthly cashflow
- —
- DSCR
- —
- Eligible?
- —
No personal income docs; deal must DSCR.
Hard money
10% down · 12.0% · 12mo
- Down + closing
- —
- Monthly P&I
- —
- Monthly cashflow
- —
- DSCR
- —
- Eligible?
- —
Short-term bridge; refi at stabilization.
Listing history 5 events
-
2026-05-04$60,411 Active 656-char remark
-
2019-04-11$120,000
-
2018-08-31$140,000
-
2010-08-12soldstatus $109,697
-
2008-03-19soldstatus
ⓘ Source: listings_history table (triggers on properties + properties_extension) + one-shot
backfill from property_details.listing_events for pre-trigger history.
Climate risk First Street
- Flood 1/10 Low 0% chance over 30 yrs
- Wildfire 5/10 Major
- Heat 9/10 Extreme 6 d/yr ≥111°F today · 18 d/yr by 30 yrs out
- Wind 8/10 Severe 94% chance of damaging wind over 30 yrs
- Air quality 1/10 Low 0 unhealthy d/yr today · 0 by 30 yrs out
Nearby sold comps map
Loading sold comps map…
Walkable amenities ~0.75 mi
Loading nearby amenities…
Taxation est. · year 1
- Rental income
- $13,255
- − Mortgage interest
- −$3,384
- − Property taxes
- −$906
- − Insurance
- −$302
- − Repairs & maintenance
- −$1,060
- − Management
- −$1,060
- − Depreciation
- −$1,757
- Taxable income
- $4,785
- Est. tax owed @ 24.0%
- −$1,148
- After-tax cash flow
- $4,313/yr
For passive investors: Depreciation is non-cash, so a rental often shows a tax loss while cash-flowing — sheltering income. Rental losses are passive: they offset passive income freely, and up to $25,000/yr can offset ordinary (W-2) income if you actively participate and your MAGI is under $100k (phasing out to $0 by $150k); unused losses carry forward. On sale, claimed depreciation is recaptured at up to 25%, and gains may owe capital-gains tax (a 1031 exchange can defer both). Figures are a year-1 estimate at your 24.0% rate — not tax advice; consult a CPA.
Schools (NCES district)
- District
- Jim Hogg County ISD
- NCES district ID
- 4824750
- Math proficiency
- 31% ▼ -15.00%
- Reading proficiency
- 31% ▼ -2.00%
- Median HH income
- $35,870
- Composite
- 25.69/100
- National rank
- #7391
- State rank
- #622 of 826 in TX
Livability — Hebbronville
- Score
- 61/100
- State rank
- #1032
- US rank
- #18361
Category grades
Schools grade is shown separately in the Schools card above.
Census & demographics
- Census place
- Hebbronville, TX
- Population (ZIP)
- 4,764
Population outlook (Jim Hogg County) Hauer SSP2
- Today (2025)
- 5,023 people
- By 2030
- 4,897 · -2.5%
- By 2040
- 4,722 · -6.0%
- By 2050
- 4,510 · -10.2%
- By 2075
- 3,827 · -23.8%
- By 2100
- 2,794 · -44.4%
Race, ethnicity, and origin ACS 2023
- Neighborhood character
- Predominantly Hispanic (78%)
- Race & ethnicity
- Hispanic / Latino 78% Two or more races 40% White 21%
- Hispanic origin (detail)
- Mexican 76%
- Foreign-born
- 1% · Canada
- Languages at home
- 41% English-only · Spanish 58% Tagalog/Filipino 1%
Political lean MEDSL · Jim Hogg
- 2024 margin
- Lean D (+8.3) · D 54.0% · R 45.7%
- 2008→2024 swing
- -39.3pp toward R · 2008: 47.6pp · 2024: 8.3pp
- All cycles
- 2024: D+8.3 2020: D+17.9 2016: D+56.9 2012: D+56.7 2008: D+47.6
Not yet ingested
- Civics
- —
Market trends
- HPI YoY
- ▼ -0.95%
- Current HPI
- 99.0946
- Rent YoY
- —
- Metro
- —
- State GDP YoY
- ▲ 3.95%
- F500 in state
- 110
Industry mix (Fortune 500 HQ in TX)
| Industry | F500 HQs | Revenue |
|---|---|---|
| Energy | 16 | $1,198B |
|
||
| Technology | 5 | $198B |
|
||
| Engineering / Construction | 4 | $72B |
|
||
| Energy Services | 3 | $60B |
|
||
| Utilities | 3 | $41B |
|
||
| Healthcare | 2 | $330B |
|
||
Price history
-44.9% since first listed6 events — show timeline
- 2026-05-25 Pending — CBMLS
- 2026-05-04 Listed $60,411 CBMLS
- 2019-04-11 Listed $120,000 CBMLS
- 2018-08-31 Listed $140,000 CBMLS
- 2010-08-12 Sold (Public Records) $109,697 Public Records
- 2008-03-19 Sold (Public Records) — Public Records
Property tax history
+3.9%/yrLatest (2025): $3,154 · -3.2% YoY. Source: county tax records.
Cash-flow waterfall
monthlySold comps — $/sqft
last 12 mo · ≤1 miLoading sold comps…