 Duplex
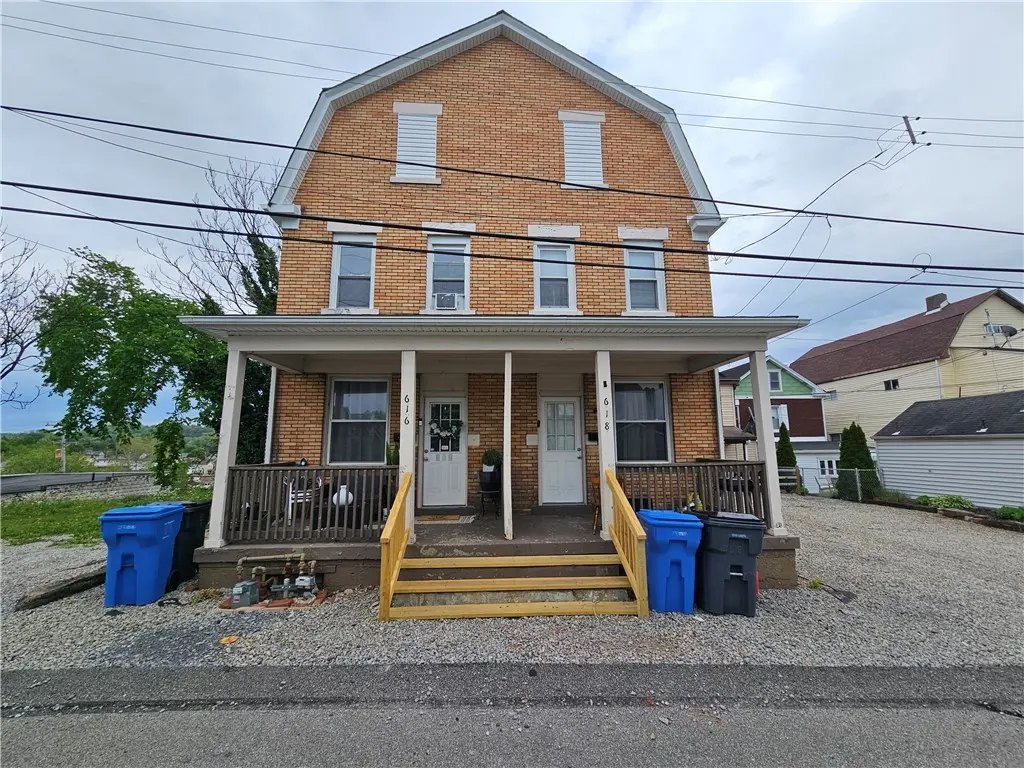
618 Carothers Ave · Glendale, PA
Flood risk 1/10 · Minimal
- FEMA flood zone
- X (unshaded)
- Chance of flooding over 30 yrs
- 0.0%
- Est. flood insurance / yr
- $473 – $860
Fire risk 1/10 · Minimal
- Est. fire insurance / yr
- $511 – $949
Heat risk 4/10 · Minor
- Hot days now (above 96°F)
- 7 days/yr
- Hot days in 30 yrs
- 18 days/yr
Wind risk 2/10 · Minimal
- Chance of severe wind over 30 yrs
- —
Air-quality risk 2/10 · Minimal
- Unhealthy air days now
- 0 days/yr
- Unhealthy air days in 30 yrs
- 3 days/yr
Risk factors via First Street. Map © Google.
Why this score? — see what drove the B- grade
The composite is a weighted blend of 9 inputs, each scored 0–100. Each bar is that input's sub-score; the figure is the points it added to the 100-point composite (weight × sub-score).
- Cash flow +27.6/30.0
- DSCR +9.7/10.0
- 1% rule +7.5/10.0
- ARV discount +7.5/15.0
- Schools +4.1/10.0
- Rent growth +3.9/5.0
- Condition / age +3.8/5.0
- Livability +2.5/5.0
- Appreciation +0.0/10.0
$200,000
🖨 Deal sheet 📄 Offer letter ✓ Due diligence
Multi-family units
County records classify this as Multi-Family (2-4 Unit). Listing-text estimate: 2 units. confirmed
Listing remarks
Income-producing duplex in Scott Twp (Chartiers Valley Schools) — ideal for investors or owner occupied buyers. Both units are tenant occupied with month to month leases. Both units have been updated and are 2 bedroom and 1 bathroom each with convenient off-street parking for 4 vehicles. Unit 616: Updated in 2022 with new Kitchen, Bathroom, Floors, Paint and Furnace. Unit 618: Updated in 2017 with new Kitchen, Bathroom, Paint and Floors. Other major capital improvements include: new roof (2020), Soffit/Facia, Gutters and Downspouts in 2025 & 2026. Electrical panels are 100 amps each and the sewer line was relined in 2016. Water lines are separated between each unit and tenants p
Key facts
- Off street parking
- Sewer line relined
- Updated kitchen
Tags
Property features AI
Finance
- Other: No additional financial details provided
- Financial info: Gross annual rental income reported at $21,540; Reported insurance expense $923
- HOA & community: No HOA details provided
Exterior
- Parking: Off-street parking for 4 vehicles
- Security: No security details provided
- Utilities: No water, sewer, or power details provided
- Home design: Multi-family property
- Construction: Brick and frame construction; Asphalt roof
- Exterior features: Multi-zoned lot
Interior
- Kitchen: No appliance details provided
- Bedrooms: Two 2-bedroom units (each unit has 2 bedrooms)
- Flooring: No flooring details provided
- Bathrooms: Each unit has one full bathroom
- Heating & cooling: No heating or cooling details provided
- Interior features: Unfinished basement
- Laundry & utility: No laundry or utility details provided
Neighborhood map
What this means for you Summary
Snapshot
- This is a 2 × 2-bed/1.0-bath units multifamily listed at $200k. Condition is rated good.
Deal economics
- At list price, monthly cash flow is $598 ($7k/yr) — positive. Per door: $299/mo.
- The deal already cash-flows at list — no discount required.
- Meets the 1% rule at list price ($3k rent vs $200k).
Location & tenants
- Location reads: area grade B — affects rentability + tenant quality, not the cash-flow math above.
- Chartiers Valley SD (suburban): math 37% / reading 57% proficiency, ranked #221 of 539 in PA (top 41%) — families likely to look elsewhere, expect single-tenant / working-renter base with shorter leases.
- Market conditions: Rents rising fast (+5.5%/yr); 67 active listings in the ZIP; 8 comparable units currently listed for rent nearby; rentals at typical pace (median 24d on market — plan ~3-4 weeks tenant-placement turnaround); solid renter incomes; 2,996 units permitted in Allegheny County in 2024 (1,588 in 5+ unit buildings).
- This rent runs 39% of the median local income ($77k/yr) — at the standard rent-burdened threshold; future hikes will face affordability resistance.
Forward outlook
- Local home prices are declining (-3.0%/yr); year-one equity from $1k of loan paydown is wiped out by about $6k of value loss. Plan a longer hold.
- At projected returns (-3.0% appreciation + 5.5% rent growth), your $56k cash investment doubles in ~8 years — after that, you're playing with house money.
Negotiation context
- Only 11 days on market — expect competitive offers; lowballing is unlikely to land.
Risks & watch-outs
- Watch-outs: built in 1917 — expect roof / HVAC / electrical / plumbing capex.
Questions for the listing agent
- Can we see the unit-by-unit rent roll, current vacancy, and any below-market leases? What's the average tenancy length?
- What capital expenditures (roof, boiler, parking lot, exteriors) have been made in the last 5 years, and what's planned in the next 2?
- Built in 1917 — when were the roof, HVAC, electrical panel, plumbing, and water heater last replaced?
- Is there a deadline driving the sale (1031 exchange, divorce, estate, relocation)? That informs how much negotiation room exists.
- What's the average days-on-market for RENTAL listings here right now (not sales)? A rising rental-DOM trend means longer vacancies and softer asking-rent achievability than the comps imply.
- What's the recent tenant-quality profile in this submarket — average credit score on applications, eviction rate, late-payment / NSF rate, and stable-employment percentage? A property-management company in the area should have these aggregated.
- How much new apartment / multifamily construction is in the pipeline within 1–3 miles? Heavy new supply (>2% of stock underway) typically softens rents 12–24 months out; light construction supports rent growth.
Investment metrics
- 1% rule
- 1.25% ✓
- Cap rate
- 9.88%
- Cash-on-cash
- 12.82%
- DSCR
- 1.57
- GRM
- 6.6
CMA / ARV
No comps found within radius.
Show comp detail 12 sales within ~0.75 mi
| Address | Dist | Beds/Ba | Sqft | Sold | Price | $/sf | Match |
|---|---|---|---|---|---|---|---|
| 637 - 637 Library Ave | 0.41mi | 4/2.0 | — | 5mo | $200,000 | — | 64 |
| 212 Hope St | 0.22mi | 3/3.0 (-1) | — | 9mo | $136,000 | — | 61 |
| 100-102 Lee St | 0.26mi | 5/2.0 (+1) | — | 14mo | $222,000 | — | 59 |
| 340 Gregg St | 0.27mi | 3/2.0 (-1) | — | 13mo | $210,000 | — | 59 |
| 505 Diamond Aly | 0.38mi | 3/2.0 (-1) | — | 9mo | $208,000 | — | 57 |
| 312 Trimble Ave | 0.65mi | 4/2.0 | — | 2mo | $177,000 | — | 55 |
| 515 Orchard St | 0.37mi | 4/3.0 | — | 14mo | $250,000 | — | 55 |
| 306 5th Ave | 0.67mi | 5/3.0 (+1) | — | 7mo | $300,000 | — | 42 |
| 111 Ramsey Ave | 0.67mi | 5/3.0 (+1) | — | 7mo | $268,500 | — | 41 |
| 548 Boquet St | 0.72mi | 3/2.0 (-1) | — | 12mo | $61,500 | — | 39 |
| 509 Steen St | 0.68mi | 4/4.0 | — | 16mo | $215,000 | — | 34 |
| 401 Franklin Ave | 0.51mi | 5/7.0 (+1) | — | 15mo | $549,000 | — | 31 |
Match score weights: distance 35% · size 25% · config 20% · recency 20%. Top-matched comps best support the ARV.
Projected returns pro-forma
-3.0% appreciation · 5.45% rent growth · sell at horizon
- IRR
- 5.4%
- Equity multiple
- 1.22×
- Total profit
- $12,071
- Equity at exit
- $29,821
- IRR
- 17.0%
- Equity multiple
- 2.55×
- Total profit
- $87,056
- Equity at exit
- $17,292
Cash invested: $56,000 (down + closing). Projections, not guarantees.
Landlord ↔ Tenant lean methodology
- Overall (STATE)
- 62 Landlord-Friendly
- State Pennsylvania
- 62 Landlord-Friendly · EVEN
- County
- — inherits STATE
- City
- — inherits STATE
ZIP-level market 15106
- Home prices YoY
- -31.9%
- Rents YoY
- 5.5%
- Active inventory
- 67
- Price-to-rent
- 13.3×
Monthly cashflow live
- Estimated rent
- $2,507 high interval (Pro) →
- Mortgage (P&I)
- −$1,049
- Tax est. 1.5%
- −$250 /mo · $3,000/yr
- Insurance
- −$83
- HOA
- −$0
- Vacancy / Maint / Mgmt
- −$526
- Net cashflow
- $598
Break-even live
2-unit breakdown (identical units grouped — click to expand)
| Units | Beds | Baths | Est. rent |
|---|---|---|---|
| 2× units | 2 | 1 | $2,508 |
| #1 | 2 | 1 | $1,254 |
| #2 | 2 | 1 | $1,254 |
| Total (2 units) | $2,507 | ||
UW: 25.0% down · 7.5% · 30yr · 1.5% tax · 5.0% vac · 8.0% maint · 8.0% mgmt
Financing live
Cash to close
- Down payment
- $50,000
- Closing costs
- $6,000
- Reserves months
- —
- Total cash needed
- —
Loan-product check · same deal, 3 products live
Conventional
25% down · 7.5% · 30yr
- Down + closing
- —
- Monthly P&I
- —
- Monthly cashflow
- —
- DSCR
- —
- Eligible?
- —
Personal DTI + credit; lowest rate.
DSCR
20% down · 8.5% · 30yr
- Down + closing
- —
- Monthly P&I
- —
- Monthly cashflow
- —
- DSCR
- —
- Eligible?
- —
No personal income docs; deal must DSCR.
Hard money
10% down · 12.0% · 12mo
- Down + closing
- —
- Monthly P&I
- —
- Monthly cashflow
- —
- DSCR
- —
- Eligible?
- —
Short-term bridge; refi at stabilization.
Rent comps 8 comps
| Address | Beds | Baths | Sqft | Rent | $/sqft | DOM | Units | Dist |
|---|---|---|---|---|---|---|---|---|
| 525 Carothers Ave Ste 2 Carnegie, PA | 3.0 | 1.0 | 1600 | $1,000 | $0.62 | 23d | 1 | 0.14mi |
| 851 Kennedy St Carnegie, PA | 3.0 | 1.0 | 1100 | $1,800 | $1.64 | 23d | 1 | 0.30mi |
| 312 Midland Ave Carnegie, PA | 3.0 | 1.0 | 1332 | $1,400 | $1.05 | 43d | 1 | 0.73mi |
| 1900 Tee Ct Presto, PA | 1.0–3.0 | 1.0–2.0 | 981 | $2,128 | $2.17 | 1d | 9 | 0.79mi |
| 100 Branch St Carnegie, PA | 3.0 | 1.0 | 1606 | $1,590 | $0.99 | 23d | 1 | 0.88mi |
| 356 Sunrise Dr Carnegie, PA | 3.0 | 2.5 | 1728 | $2,500 | $1.45 | 23d | 1 | 1.06mi |
| 312 Sunrise Dr Carnegie, PA | 3.0 | 2.5 | 2112 | $3,200 | $1.52 | 1d | 1 | 1.14mi |
| 135 Greenbriar Dr Pittsburgh, PA | 3.0 | 1.0 | 950 | $1,550 | $1.63 | 4d | 1 | 1.22mi |
Listing history 2 events
-
2026-05-22historical Contingent
-
2026-05-18$200,000 Active
ⓘ Source: listings_history table (triggers on properties + properties_extension) + one-shot
backfill from property_details.listing_events for pre-trigger history.
Climate risk First Street
- Flood 1/10 Low FEMA zone X (unshaded) · 0% chance over 30 yrs
- Wildfire 1/10 Low
- Heat 4/10 Moderate 7 d/yr ≥96°F today · 18 d/yr by 30 yrs out
- Wind 2/10 Low
- Air quality 2/10 Low 0 unhealthy d/yr today · 3 by 30 yrs out
Nearby sold comps map
Loading sold comps map…
Walkable amenities ~0.75 mi
Loading nearby amenities…
Taxation est. · year 1
- Rental income
- $30,084
- − Mortgage interest
- −$11,203
- − Property taxes
- −$3,000
- − Insurance
- −$1,000
- − Repairs & maintenance
- −$2,407
- − Management
- −$2,407
- − Depreciation
- −$5,818
- Taxable income
- $4,249
- Est. tax owed @ 24.0%
- −$1,020
- After-tax cash flow
- $6,161/yr
For passive investors: Depreciation is non-cash, so a rental often shows a tax loss while cash-flowing — sheltering income. Rental losses are passive: they offset passive income freely, and up to $25,000/yr can offset ordinary (W-2) income if you actively participate and your MAGI is under $100k (phasing out to $0 by $150k); unused losses carry forward. On sale, claimed depreciation is recaptured at up to 25%, and gains may owe capital-gains tax (a 1031 exchange can defer both). Figures are a year-1 estimate at your 24.0% rate — not tax advice; consult a CPA.
Condition & rehab AI · 1 photo
This well-maintained and updated duplex is in good condition with recent renovations, ideal for investors or owner-occupied buyers.
Value-add opportunities
- Both Landscaping and curb appeal improvements — Enhanced landscaping can improve both the resale and rental value.
- Both Painting the exterior — Fresh paint can make the home more appealing to potential buyers and renters.
- Both Upgrading the front porch and steps — A well-maintained porch can increase both the resale and rental value of the property.
Renovation cost estimate screening
Value-add ROI direction
- Both Landscaping and curb appeal improvements — Enhanced landscaping can improve both the resale and rental value. ↑
- Both Painting the exterior — Fresh paint can make the home more appealing to potential buyers and renters. ↑
- Both Upgrading the front porch and steps — A well-maintained porch can increase both the resale and rental value of the property. ↑
ⓘ Cost ranges are severity-bucket heuristics (US national rule-of-thumb). Get contractor quotes + a written scope before underwriting a rehab budget.
Schools (NCES district)
- District
- Chartiers Valley SD
- NCES district ID
- 4205700
- Math proficiency
- 37% ▼ -16.00%
- Reading proficiency
- 57% ▼ -17.00%
- Median HH income
- $57,191
- Composite
- 40.91/100
- National rank
- #3614
- State rank
- #221 of 539 in PA
Livability — Glendale
No livability data for this city. (Only ~50 U.S. cities are tracked.)
Census & demographics
- Census place
- Glendale, PA
- County
- Allegheny County · 1,022,028 people
- Metro
- Pittsburgh, PA
- Population (ZIP)
- 19,244
- Household income
- $77,247
- Rent vs Own
- Severe rent burden
- 410.0
Population outlook (Allegheny County) Hauer SSP2
- Today (2025)
- 1,250,282 people
- By 2030
- 1,256,482 · +0.5%
- By 2040
- 1,256,318 · +0.5%
- By 2050
- 1,244,169 · -0.5%
- By 2075
- 1,197,693 · -4.2%
- By 2100
- 1,093,187 · -12.6%
Race, ethnicity, and origin ACS 2023
- Neighborhood character
- Predominantly White (82%)
- Race & ethnicity
- White 82% Black 8% Two or more races 6% Asian 2% Hispanic / Latino 2%
- Common ancestry
- Romanian 11% Lithuanian 2% Subsaharan African 2%
- Foreign-born
- 5%
- Languages at home
- 94% English-only · Other Indo-European 2% Arabic 1% Russian/Polish/Slavic 1%
Political lean MEDSL · Allegheny
- 2024 margin
- Strong D (+20.3) · D 59.7% · R 39.4%
- 2008→2024 swing
- +4.8pp toward D · 2008: 15.5pp · 2024: 20.3pp
- All cycles
- 2024: D+20.3 2020: D+20.4 2016: D+16.4 2012: D+14.4 2008: D+15.5
Not yet ingested
- Civics
- —
Market trends
- HPI YoY
- ▼ -119.52%
- Current HPI
- 255.0295
- Rent YoY
- ▲ 5.45%
- Metro
- Pittsburgh, PA
- State GDP YoY
- ▲ 1.68%
- F500 in state
- 34
Industry mix (Fortune 500 HQ in PA)
| Industry | F500 HQs | Revenue |
|---|---|---|
| Healthcare | 2 | $309B |
|
||
| Insurance | 2 | $27B |
|
||
| Telecommunications / Media | 1 | $124B |
|
||
| Industrial Distribution | 1 | $22B |
|
||
| Financial Services | 1 | $20B |
|
||
| Chemicals / Materials | 1 | $18B |
|
||
Price history
2 events — show timeline
- 2026-05-22 Contingent — West Penn MLS
- 2026-05-18 Listed $200,000 West Penn MLS
Cash-flow waterfall
monthlySold comps — $/sqft
last 12 mo · ≤1 miLoading sold comps…