10369 NW 24th Pl #402 · Sunrise, FL
Flood risk No data
- FEMA flood zone
- —
- Chance of flooding over 30 yrs
- —
- Est. flood insurance / yr
- —
Fire risk No data
- Est. fire insurance / yr
- —
Heat risk No data
- Hot days now (above threshold)
- —
- Hot days in 30 yrs
- —
Wind risk No data
- Chance of severe wind over 30 yrs
- —
Air-quality risk No data
- Unhealthy air days now
- —
- Unhealthy air days in 30 yrs
- —
Risk factors via First Street. Map © Google.
Why this score? — see what drove the C+ grade
The composite is a weighted blend of 9 inputs, each scored 0–100. Each bar is that input's sub-score; the figure is the points it added to the 100-point composite (weight × sub-score).
- Cash flow +23.3/30.0
- 1% rule +10.0/10.0
- DSCR +7.5/10.0
- ARV discount +7.5/15.0
- Livability +4.2/5.0
- Schools +4.1/10.0
- Rent growth +2.7/5.0
- Condition / age +2.5/5.0
- Appreciation +0.0/10.0
$149,777
🖨 Deal sheet 📄 Offer letter ✓ Due diligence
Listing remarks
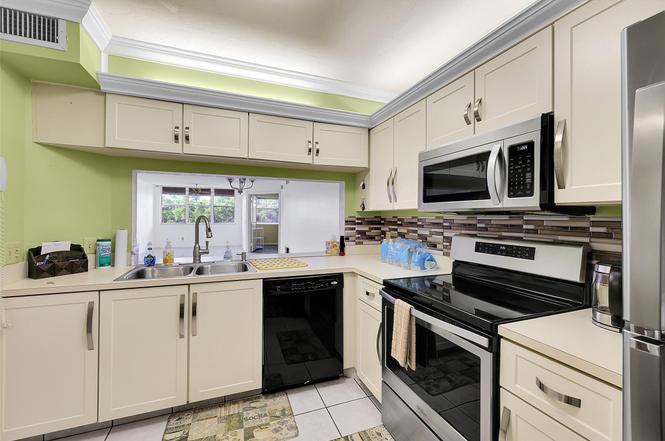
55+ COMMUNITY IN THE SOUGHT AFTER SUNRISE LAKES PHASE IV, 2/2, LIDO MODEL ON THE TOP FLOOR! LOOK NO FURTHER, BRING YOUR BUYER LOOKING FOR GREAT VALUE. GARDEN AND WATER VIEWS FROM THE EXTENDED FLORIDA ROOM ON THE GOLF COURSE, PICTURESQUE VIEWS AND HURRICANE SHUTTERS. TILE AND LAMINATE FLOORING, NICE KITCHEN WITH STAINLESS STEEL APPLIANCES. ONE OF THE FEW MODELS WITH A SEPERATE LAUNDRY ROOM. JUST LISTED! WON'T LAST. MAIN CLUBHOUSE INCLUDES; SAUNAS, BBQ, PICNIC AREAS, BILLIARDS, THEATER, CABANAS, COURTESY BUSSES TO STORES AND SAWGRASS MILLS MALL, INDOOR AND OUTDOOR POOLS AND FITNESS ROOM.
Key facts
- Main clubhouse
- Hurricane shutters
- Golf course
Tags
Property features AI
Finance
- Other: Association fee paid monthly
- HOA & community: Community association with monthly fee; Monthly HOA fee includes water and common areas; Community amenities: fitness center, jogging path, parking, pool, sauna, shuffleboard court, community room, courtesy bus, internet included, pickleball courts, security; Senior community
Exterior
- Parking: Assigned parking; Guest parking
- Security: Security patrol
- Utilities: Has heating; Has cooling
- Home design: Condominium; Resale property; 4-story building
- Construction: Block construction
- Exterior features: On golf course; Waterfront (yes) — no specific waterfront features listed
Interior
- Kitchen: Electric range; Refrigerator
- Bedrooms: 2 bedrooms on the main level
- Flooring: Laminate flooring; Tile flooring
- Bathrooms: 2 full bathrooms
- Heating & cooling: Central electric heating; Central air conditioning; Ceiling fan(s)
- Interior features: Walk-in closets
- Laundry & utility: Electric water heater
Neighborhood map
What this means for you Summary
Snapshot
- This is a 2-bed/2.0-bath condo listed at $150k.
Deal economics
- At list price, monthly cash flow is $274 ($3k/yr) — positive.
- The deal already cash-flows at list — no discount required.
- Meets the 1% rule at list price ($3k rent vs $150k).
- Recommended offer: $136k (9.0% below list) — sets the bar for market timing.
- Cap rate 8.5% vs local median 4.9% in Sunrise — top-decile yield for the area; either an underpriced asset or a hidden risk that comps aren't pricing in. Stress-test before assuming the spread holds.
Location & tenants
- Location reads 83/100 on livability (#56 in FL, #986 nationally) — a professional / high-income tenant draw. Strengths: commute A+, housing A+, health & safety A+; Watch: employment C-, amenities F.
- Broward (suburban): math 42% / reading 53% proficiency, ranked #46 of 73 in FL (top 63%) — families likely to look elsewhere, expect single-tenant / working-renter base with shorter leases.
- Zoned schools: Nob Hill Elementary School (math 52% / reading 54%, grade C, #963 of 2,144 statewide, top 45%, 541 students, 57% FRL); Bair Middle School (math 23% / reading 38%, grade F, #465 of 571 statewide, top 82%, 766 students, 72% FRL); Piper High School (math 12% / reading 35%, grade F, #533 of 667 statewide, top 80%, 2,310 students, 65% FRL).
- Market conditions: Rents flat; 559 active listings in the ZIP; 40 comparable units currently listed for rent nearby; rentals at typical pace (median 22d on market — plan ~3-4 weeks tenant-placement turnaround); 2,111 units permitted in Broward County in 2024 (1,265 in 5+ unit buildings).
- This rent runs 42% of the median local income ($72k/yr) — at the standard rent-burdened threshold; future hikes will face affordability resistance.
Forward outlook
- Local home prices are declining (-3.0%/yr); year-one equity from $1k of loan paydown is wiped out by about $4k of value loss. Plan a longer hold.
- Broward County population projected at +34% by 2050 — long-run rental-demand tailwind backs the buy-and-hold thesis.
Negotiation context
- It's been on market 99 days — a 9% lower offer ($136k) is reasonable based on typical stale-listing flexibility.
- 4 sale attempts since 13y ago with the ask held roughly flat each time — persistent listings suggest the price (not the market) is what's stuck; bring a comps-based counter.
- Current owner paid $58k; list at $150k implies a 158% gain — meaningful room to come down on a strong offer.
Risks & watch-outs
- Watch-outs: HOA is 23% of rent.
Questions for the listing agent
- It's been on market 99 days. Have you received any prior offers? Is the seller open to a 9% concession, seller financing, or rate buy-down credit?
- What does the HOA fee cover, when was the last increase, and are there any pending special assessments or reserve-fund shortfalls?
- Any open or pending special assessments — roof, HVAC, plumbing, elevator, façade? What's the per-unit balance and payoff schedule, and is the seller paying it off at close or rolling it to the buyer?
- Why hasn't it sold? Are there any deal-killer items the seller is aware of (foundation, flood, title, zoning, code violations)?
- Is there a deadline driving the sale (1031 exchange, divorce, estate, relocation)? That informs how much negotiation room exists.
- What's the average days-on-market for RENTAL listings here right now (not sales)? A rising rental-DOM trend means longer vacancies and softer asking-rent achievability than the comps imply.
- What's the recent tenant-quality profile in this submarket — average credit score on applications, eviction rate, late-payment / NSF rate, and stable-employment percentage? A property-management company in the area should have these aggregated.
- How much new apartment / multifamily construction is in the pipeline within 1–3 miles? Heavy new supply (>2% of stock underway) typically softens rents 12–24 months out; light construction supports rent growth.
Investment metrics
- 1% rule
- 1.68% ✓
- Cap rate
- 8.49%
- Cash-on-cash
- 7.84%
- DSCR
- 1.35
- GRM
- 5.0
CMA / ARV
No comps found within radius.
Projected returns pro-forma
-3.0% appreciation · 0.6% rent growth · sell at horizon
- IRR
- -8.3%
- Equity multiple
- 0.71×
- Total profit
- $-12,289
- Equity at exit
- $22,332
- IRR
- -4.1%
- Equity multiple
- 0.77×
- Total profit
- $-9,554
- Equity at exit
- $12,950
Cash invested: $41,938 (down + closing). Projections, not guarantees.
Landlord ↔ Tenant lean methodology
- Overall (STATE)
- 87 Strongly Landlord-Friendly
- State Florida
- 87 Strongly Landlord-Friendly · R+3
- County
- — inherits STATE
- City
- — inherits STATE
ZIP-level market 33322
- Home prices YoY
- -33.3%
- Rents YoY
- 0.6%
- Active inventory
- 559
- Price-to-rent
- 5.0×
Monthly cashflow live
- Estimated rent
- $2,511 high interval (Pro) →
- Mortgage (P&I)
- −$785
- Tax from tax record
- −$294 /mo · $3,529/yr
- Insurance
- −$62
- HOA
- −$568
- Vacancy / Maint / Mgmt
- −$527
- Net cashflow
- $274
Break-even live
UW: 25.0% down · 7.5% · 30yr · 1.5% tax · 5.0% vac · 8.0% maint · 8.0% mgmt
Financing live
Cash to close
- Down payment
- $37,444
- Closing costs
- $4,493
- Reserves months
- —
- Total cash needed
- —
Loan-product check · same deal, 3 products live
Conventional
25% down · 7.5% · 30yr
- Down + closing
- —
- Monthly P&I
- —
- Monthly cashflow
- —
- DSCR
- —
- Eligible?
- —
Personal DTI + credit; lowest rate.
DSCR
20% down · 8.5% · 30yr
- Down + closing
- —
- Monthly P&I
- —
- Monthly cashflow
- —
- DSCR
- —
- Eligible?
- —
No personal income docs; deal must DSCR.
Hard money
10% down · 12.0% · 12mo
- Down + closing
- —
- Monthly P&I
- —
- Monthly cashflow
- —
- DSCR
- —
- Eligible?
- —
Short-term bridge; refi at stabilization.
Rent comps 40 comps
| Address | Beds | Baths | Sqft | Rent | $/sqft | DOM | Units | Dist |
|---|---|---|---|---|---|---|---|---|
| 2698 N Nob Hill Rd Sunrise, FL | 2.0 | 2.0 | 1008 | $2,275 | $2.26 | 24d | 1 | 0.39mi |
| 2734 N Nob Hill Rd Sunrise, FL | 2.0 | 2.0 | 954 | $2,400 | $2.52 | 24d | 1 | 0.40mi |
| 10784 NW 23rd Ct Sunrise, FL | 3.0 | 2.0 | 1430 | $3,150 | $2.20 | 12d | 1 | 0.41mi |
| 2590 NW 98th Ave Sunrise, FL | 2.0 | 2.0 | 1247 | $3,000 | $2.41 | 2d | 1 | 0.49mi |
| 2590 NW 98th Ave Sunrise, FL | 2.0 | 2.0 | 1247 | $3,000 | $2.41 | 24d | 1 | 0.49mi |
| 10758 NW 30th Pl Sunrise, FL | 2.0 | 2.0 | 1074 | $2,200 | $2.05 | 17d | 1 | 0.53mi |
| 10131 W Sunrise Blvd #206 Plantation, FL | 2.0 | 2.0 | 963 | $2,200 | $2.28 | 24d | 1 | 0.58mi |
| 9720 NW 24th Pl Unit B Sunrise, FL | 1.0 | 1.0 | 700 | $1,750 | $2.50 | 24d | 1 | 0.58mi |
| 9999 Summerbreeze Dr Sunrise, FL | 1.0–2.0 | 1.0–2.0 | 889 | $2,200 | $2.47 | 5d | 9 | 0.63mi |
| 9999 Summerbreeze Dr Sunrise, FL | 1.0–2.0 | 1.0–2.0 | 889 | $2,200 | $2.47 | 18d | 6 | 0.63mi |
| 9999 Summerbreeze Dr Sunrise, FL | 1.0–2.0 | 1.0–2.0 | 889 | $2,200 | $2.47 | 2d | 8 | 0.63mi |
| 9999 Summerbreeze Dr Sunrise, FL | 1.0–2.0 | 1.0–2.0 | 889 | $2,200 | $2.47 | 1d | 9 | 0.63mi |
| 10115 W Sunrise Blvd #104 Plantation, FL | 1.0 | 1.0 | 806 | $1,800 | $2.23 | 2d | 1 | 0.65mi |
| 10115 W Sunrise Blvd #104 Plantation, FL | 1.0 | 1.0 | 806 | $1,850 | $2.30 | 14d | 1 | 0.65mi |
| 10105 W Sunrise Blvd #306 Plantation, FL | 2.0 | 2.0 | 963 | $2,300 | $2.39 | 24d | 1 | 0.68mi |
| 9571 Sunset Strip Sunrise, FL | 3.0 | 2.0 | 1418 | $3,450 | $2.43 | 24d | 1 | 0.69mi |
| 9571 Sunset Strip Sunrise, FL | 3.0 | 2.0 | 1418 | $3,450 | $2.43 | 22d | 1 | 0.69mi |
| 10161 W Sunrise Blvd #101 Plantation, FL | 2.0 | 2.0 | 963 | $2,500 | $2.60 | 24d | 1 | 0.70mi |
| 10991 NW 30th Pl #10991 Sunrise, FL | 3.0 | 2.0 | 1144 | $2,950 | $2.58 | 24d | 1 | 0.72mi |
| 2650 NW 94th Way Sunrise, FL | 2.0 | 2.0 | 1200 | $2,900 | $2.42 | 2d | 1 | 0.76mi |
| 2631 NW 94th Ave Sunrise, FL | 2.0 | 2.0 | 1350 | $3,456 | $2.56 | 5d | 1 | 0.78mi |
| 10900 NW 17th St Plantation, FL | 1.0–3.0 | 1.0–2.5 | 1270 | $2,414 | $1.90 | 2d | 17 | 0.86mi |
| 10053 Winding Lake Rd #101 Sunrise, FL | 2.0 | 2.0 | 760 | $2,000 | $2.63 | 8d | 1 | 1.04mi |
| 11386 NW 33rd St Unit 11386 Sunrise, FL | 2.0 | 2.5 | 1498 | $2,900 | $1.94 | 17d | 1 | 1.05mi |
| 3633 NW 99th Ter Unit 7B Sunrise, FL | 2.0 | 2.0 | 1224 | $2,500 | $2.04 | 8d | 1 | 1.05mi |
| 3633 NW 99th Ter Unit 7B Sunrise, FL | 2.0 | 2.0 | 1224 | $2,500 | $2.04 | 22d | 1 | 1.05mi |
| 9151 W Sunrise Blvd #9151 Plantation, FL | 3.0 | 2.0 | 1482 | $2,750 | $1.86 | 24d | 1 | 1.05mi |
| 10700 NW 14th St #146 Plantation, FL | 2.0 | 2.0 | 985 | $2,200 | $2.23 | 24d | 1 | 1.05mi |
| 10002 Winding Lake Rd #101 Sunrise, FL | 2.0 | 2.0 | 760 | $1,900 | $2.50 | 24d | 1 | 1.05mi |
| 10050 Winding Lake Rd #103 Sunrise, FL | 2.0 | 2.0 | 760 | $1,750 | $2.30 | 24d | 1 | 1.06mi |
| 10046 Winding Lake Rd #204 Sunrise, FL | 2.0 | 1.0 | 760 | $1,800 | $2.37 | 24d | 1 | 1.07mi |
| 9100 NW 26th Pl Sunrise, FL | 2.0 | 2.0 | 1047 | $2,995 | $2.86 | 24d | 1 | 1.07mi |
| 9100 NW 26th Pl Sunrise, FL | 3.0 | 2.0 | 1047 | $2,995 | $2.86 | 22d | 1 | 1.07mi |
| 10005 Winding Lake Rd #204 Sunrise, FL | 2.0 | 2.0 | 772 | $1,800 | $2.33 | 24d | 1 | 1.07mi |
| 10054 Winding Lake Rd #201 Sunrise, FL | 2.0 | 2.0 | 760 | $2,200 | $2.89 | 21d | 1 | 1.07mi |
| 10054 Winding Lake Rd #201 Sunrise, FL | 2.0 | 2.0 | 760 | $2,200 | $2.89 | 3d | 1 | 1.07mi |
| 10790 NW 14th St #187 Plantation, FL | 3.0 | 2.0 | 1120 | $2,550 | $2.28 | 24d | 1 | 1.07mi |
| 10003 Winding Lake Rd #103 Sunrise, FL | 2.0 | 2.0 | 772 | $1,850 | $2.40 | 8d | 1 | 1.07mi |
| 10003 Winding Lake Rd #103 Sunrise, FL | 2.0 | 2.0 | 772 | $1,900 | $2.46 | 24d | 1 | 1.07mi |
| 10039 Winding Lake Rd #202 Sunrise, FL | 2.0 | 2.0 | 760 | $2,000 | $2.63 | 24d | 1 | 1.08mi |
HOA detail condo
- Monthly dues
- $568 · $6,816/yr
- Likely covers
- waterpool
- Assessments
- None detected in remarks — confirm with the listing agent.
Listing history 29 events
-
2026-06-18days on market $149,777 Active 99 DOM
-
2026-06-17days on market $149,777 Active 98 DOM
-
2026-06-16days on market $149,777 Active 97 DOM
-
2026-06-15days on market $149,777 Active 96 DOM
-
2026-06-13days on market $149,777 Active 94 DOM
-
2026-06-09days on market $149,777 Active 90 DOM
-
2026-06-07days on market $149,777 Active 88 DOM
-
2026-06-04days on market $149,777 Active 85 DOM
-
2026-06-03days on market $149,777 Active 84 DOM
-
2026-06-02days on market $149,777 Active 83 DOM
-
2026-06-01days on market $149,777 Active 82 DOM
-
2026-05-31days on market $149,777 Active 81 DOM
-
2025-10-20$149,777 Active
-
2025-10-15historical
-
2025-04-11price $159,900
-
2025-03-05price $165,000
-
2025-01-27$175,000 Active
-
2024-04-05status Pending
-
2024-04-03historical
-
2024-03-11price $179,990
-
2024-02-28price $189,990
-
2024-02-01price $199,990
-
2024-01-22$219,990 Active
-
2013-12-03soldstatus $58,000
-
2013-12-02soldstatus $58,000 Sold
-
2013-10-29status Pending
-
2013-09-28$59,999 Active
-
2011-07-22soldstatus $49,900
-
1989-05-01soldstatus $59,500
ⓘ Source: listings_history table (triggers on properties + properties_extension) + one-shot
backfill from property_details.listing_events for pre-trigger history.
Tax reassessment forecast FL · Resets to sale price
- Current annual tax
- $3,529 · $294/mo
- Projected year-2 tax
- $3,529 · $294/mo
- Expected delta
- $0/yr ($0/mo · 0.0%)
ⓘ Screening estimate from a state-policy table — verify with the county assessor before closing.
Nearby sold comps map
Loading sold comps map…
Walkable amenities ~0.75 mi
Loading nearby amenities…
Taxation est. · year 1
- Rental income
- $30,136
- − Mortgage interest
- −$8,390
- − Property taxes
- −$3,529
- − Insurance
- −$749
- − Repairs & maintenance
- −$2,411
- − Management
- −$2,411
- − HOA
- −$6,816
- − Depreciation
- −$4,357
- Taxable income
- $1,473
- Est. tax owed @ 24.0%
- −$354
- After-tax cash flow
- $2,934/yr
For passive investors: Depreciation is non-cash, so a rental often shows a tax loss while cash-flowing — sheltering income. Rental losses are passive: they offset passive income freely, and up to $25,000/yr can offset ordinary (W-2) income if you actively participate and your MAGI is under $100k (phasing out to $0 by $150k); unused losses carry forward. On sale, claimed depreciation is recaptured at up to 25%, and gains may owe capital-gains tax (a 1031 exchange can defer both). Figures are a year-1 estimate at your 24.0% rate — not tax advice; consult a CPA.
Schools (NCES district)
- District
- Broward
- NCES district ID
- 1200180
- Math proficiency
- 42% ▼ -18.00%
- Reading proficiency
- 53% ▼ -5.00%
- Median HH income
- $52,139
- Composite
- 40.88/100
- National rank
- #3621
- State rank
- #46 of 73 in FL
Livability — Sunrise
- Score
- 83/100
- State rank
- #56
- US rank
- #986
Category grades
Schools grade is shown separately in the Schools card above.
Census & demographics
- Census place
- Sunrise, FL
- County
- Broward County · 1,963,430 people
- City population
- 77,492
- Metro
- Miami-Fort Lauderdale-Pompano Beach, FL
- Population (ZIP)
- 41,128
- Household income
- $71,755
- Rent vs Own
- Severe rent burden
- 931.0
Population outlook (Broward County) Hauer SSP2
- Today (2025)
- 2,207,033 people
- By 2030
- 2,360,704 · +7.0%
- By 2040
- 2,661,208 · +20.6%
- By 2050
- 2,946,698 · +33.5%
- By 2075
- 3,602,273 · +63.2%
- By 2100
- 3,970,984 · +79.9%
Race, ethnicity, and origin ACS 2023
- Neighborhood character
- Highly diverse neighborhood (Simpson 0.72)
- Race & ethnicity
- Hispanic / Latino 35% White 32% Black 24% Two or more races 22% Asian 4%
- Hispanic origin (detail)
- Puerto Rican 5% Cuban 6% Dominican 2% Salvadoran 1%
- Common ancestry
- Hispanic 5% Romanian 2% Scotch-Irish 2%
- Foreign-born
- 41% · Canada, Jamaica, South Korea
- Languages at home
- 58% English-only · Spanish 30% French/Haitian/Cajun 6% Other Indo-European 1%
Political lean MEDSL · Broward
- 2024 margin
- D (+17.0) · D 58.0% · R 41.0%
- 2008→2024 swing
- -17.8pp toward R · 2008: 34.7pp · 2024: 17.0pp
- All cycles
- 2024: D+17.0 2020: D+29.8 2016: D+35.0 2012: D+34.9 2008: D+34.7
Not yet ingested
- Civics
- —
Market trends
- HPI YoY
- ▼ -203.34%
- Current HPI
- 407.5452
- Rent YoY
- ▲ 0.60%
- Metro
- Miami-Fort Lauderdale-Pompano Beach, FL
- State GDP YoY
- ▲ 3.28%
- F500 in state
- 36
Industry mix (Fortune 500 HQ in FL)
| Industry | F500 HQs | Revenue |
|---|---|---|
| Industrial Technology | 2 | $29B |
|
||
| Insurance | 2 | $17B |
|
||
| Retail | 1 | $60B |
|
||
| Technology Distribution | 1 | $58B |
|
||
| Homebuilding | 1 | $35B |
|
||
| Technology Manufacturing | 1 | $35B |
|
||
Price history
+151.7% since first listed17 events — show timeline
- 2025-10-20 Listed $149,777 Beaches MLS
- 2025-10-15 Listing Removed — MARMLS
- 2025-04-11 Price Changed $159,900 MARMLS
- 2025-03-05 Price Changed $165,000 MARMLS
- 2025-01-27 Listed $175,000 MARMLS
- 2024-04-05 Pending — MARMLS
- 2024-04-03 Listing Removed — MARMLS
- 2024-03-11 Price Changed $179,990 MARMLS
- 2024-02-28 Price Changed $189,990 MARMLS
- 2024-02-01 Price Changed $199,990 MARMLS
- 2024-01-22 Listed $219,990 MARMLS
- 2013-12-03 Sold (Public Records) $58,000 Public Records
- 2013-12-02 Sold (MLS) $58,000 MARMLS
- 2013-10-29 Pending — MARMLS
- 2013-09-28 Listed $59,999 MARMLS
- 2011-07-22 Sold (Public Records) $49,900 Public Records
- 1989-05-01 Sold (Public Records) $59,500 Public Records
Property tax history
+11.3%/yrLatest (2025): $3,529 · +562.0% YoY. Source: county tax records.
Cash-flow waterfall
monthlySold comps — $/sqft
last 12 mo · ≤1 miLoading sold comps…