 Duplex
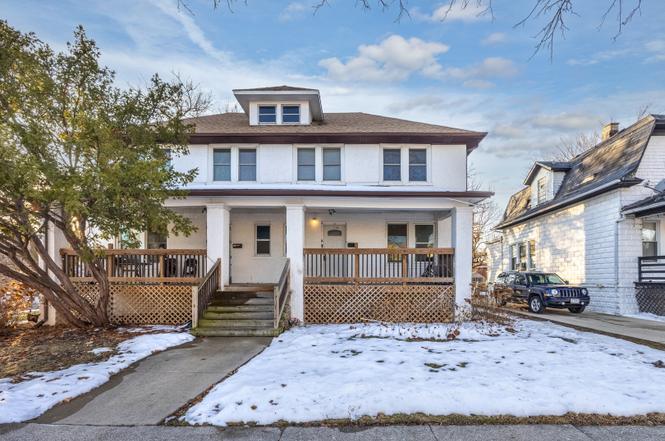
1118 S 7th Ave · Maywood, IL
Flood risk 4/10 · Minor
- FEMA flood zone
- X (unshaded)
- Chance of flooding over 30 yrs
- 0.2%
- Est. flood insurance / yr
- $473 – $860
Fire risk 1/10 · Minimal
- Est. fire insurance / yr
- $804 – $1,492
Heat risk 3/10 · Minor
- Hot days now (above 100°F)
- 7 days/yr
- Hot days in 30 yrs
- 14 days/yr
Wind risk 2/10 · Minimal
- Chance of severe wind over 30 yrs
- —
Air-quality risk 5/10 · Moderate
- Unhealthy air days now
- 6 days/yr
- Unhealthy air days in 30 yrs
- 8 days/yr
Risk factors via First Street. Map © Google.
Why this score? — see what drove the C- grade
The composite is a weighted blend of 9 inputs, each scored 0–100. Each bar is that input's sub-score; the figure is the points it added to the 100-point composite (weight × sub-score).
- Cash flow +22.6/30.0
- ARV discount +7.5/15.0
- DSCR +7.3/10.0
- 1% rule +5.9/10.0
- Livability +3.9/5.0
- Rent growth +2.5/5.0
- Condition / age +2.5/5.0
- Schools +1.9/10.0
- Appreciation +0.0/10.0
$399,900
🖨 Deal sheet (PDF) 📄 Offer letter ✓ Due diligence
Multi-family units
County records classify this as Multi-Family (2-4 Unit). Listing-text estimate: 2 units. confirmed
Listing remarks
Rare opportunity for an owner-occupant or investor. This 2-story multifamily townhome features two side-by-side 3 bed, 2 bath units, offering the option to live in one and rent the other or add a strong income-producing property to your portfolio. One unit is tenant-occupied through October 1, 2026, at $1,600 per month, providing immediate income with future upside. Each unit includes hardwood floors, separate living and dining rooms, full finished basements, central AC, in-unit laundry, stainless steel appliances, and a huge fenced backyard. Conveniently located near schools, shopping, public transportation, and expressway access. Proof of funds required for all showings.
Key facts
- Central ac
- In-unit laundry
- Finished basement
Tags
Property features AI
Finance
- Other: Built before 1978; Parcel number available
- Financial info: Special service area: No; At least one unit currently rented month-to-month ($1,600 rent); Other unit vacancy indicated
Exterior
- Utilities: Public water; Public sewer
- Home design: Two- to four-unit building; Fee simple ownership; Property rehabilitated in 2017; Over 100 years old; Not rebuilt
- Construction: Stucco exterior; Shake roof; Building contains 2 units
- Exterior features: Lot dimensions approximately 132 x 53; Lot under 0.25 acre; Zoned for multi-family
Interior
- Kitchen: No appliances listed for units
- Bedrooms: 6 bedrooms (all possible bedrooms accounted for); Each unit contains 3 bedrooms
- Bathrooms: 4 full bathrooms total; Each unit has 2 full bathrooms
- Heating & cooling: Natural gas forced air heating
- Interior features: 12 total rooms; Finished full basement
- Laundry & utility: No tenant-paid utilities listed
Neighborhood map
What this means for you Summary
Snapshot
- This is a 2 × 3-bed/2.0-bath units multifamily listed at $400k.
Deal economics
- At list price, monthly cash flow is $684 ($8k/yr) — positive. Per door: $342/mo.
- The deal already cash-flows at list — no discount required.
- Meets the 1% rule at list price ($4k rent vs $400k).
- Recommended offer: $352k (12.0% below list) — sets the bar for market timing.
- Cap rate 8.3% vs local median 4.5% in Maywood — top-decile yield for the area; either an underpriced asset or a hidden risk that comps aren't pricing in. Stress-test before assuming the spread holds.
Location & tenants
- Location reads 78/100 on livability (#146 in IL, #2,694 nationally) — a middle-class / working-renter tenant base. Strengths: commute A+, cost of living A+, housing A+; Watch: health & safety C-, crime D+, amenities D-.
- Maywood-Melrose Park-Broadview 89 (suburban): math 14% / reading 21% proficiency, ranked #738 of 919 in IL (top 80%) — low school quality limits family demand, transient renter base, plan for 1-2y turnover; 74% free/reduced lunch — lower-income household profile, screen leases tightly.
- Zoned schools: Washington Dual Language Academy (363 students, 0% FRL); Proviso West High School (math 6% / reading 11%, grade F, #584 of 693 statewide, top 85%, 1,868 students, 0% FRL) — zoned schools average 0% FRL vs 74% district-wide (74 pts lower); this property's tenant base skews higher-income than the district average.
- Market conditions: 72 active listings in the ZIP; 2 comparable units currently listed for rent nearby; 6,272 units permitted in Cook County in 2024 (4,658 in 5+ unit buildings).
- At $4,364/mo this rent would consume 76% of the median local household income ($69k/yr) (locally 869% of renters already pay >50% of income on rent) — very limited rent-growth headroom before tenants either downsize or default.
Forward outlook
- Local home prices are declining (-3.0%/yr); year-one equity from $3k of loan paydown is wiped out by about $12k of value loss. Plan a longer hold.
Negotiation context
- It's been on market 141 days — a 12% lower offer ($352k) is reasonable based on typical stale-listing flexibility.
- 5 sale attempts since 9y ago with the ask held roughly flat each time — persistent listings suggest the price (not the market) is what's stuck; bring a comps-based counter.
Risks & watch-outs
- Watch-outs: built in 1898 — expect roof / HVAC / electrical / plumbing capex.
Questions for the listing agent
- It's been on market 141 days. Have you received any prior offers? Is the seller open to a 12% concession, seller financing, or rate buy-down credit?
- Can we see the unit-by-unit rent roll, current vacancy, and any below-market leases? What's the average tenancy length?
- What capital expenditures (roof, boiler, parking lot, exteriors) have been made in the last 5 years, and what's planned in the next 2?
- Built in 1898 — when were the roof, HVAC, electrical panel, plumbing, and water heater last replaced?
- Why hasn't it sold? Are there any deal-killer items the seller is aware of (foundation, flood, title, zoning, code violations)?
- Is there a deadline driving the sale (1031 exchange, divorce, estate, relocation)? That informs how much negotiation room exists.
- Schools are F-rated, which usually means shorter tenancies and higher turnover. Who's the typical renter profile here, and what's been the actual vacancy rate?
- Crime grade is D in this area — have there been break-ins, vandalism, or insurance claims at this property in the last 3 years? What carrier currently insures it and at what premium?
- What's the average days-on-market for RENTAL listings here right now (not sales)? A rising rental-DOM trend means longer vacancies and softer asking-rent achievability than the comps imply.
- What's the recent tenant-quality profile in this submarket — average credit score on applications, eviction rate, late-payment / NSF rate, and stable-employment percentage? A property-management company in the area should have these aggregated.
- How much new apartment / multifamily construction is in the pipeline within 1–3 miles? Heavy new supply (>2% of stock underway) typically softens rents 12–24 months out; light construction supports rent growth.
Investment metrics
- 1% rule
- 1.09% ✓
- Cap rate
- 8.35%
- Cash-on-cash
- 7.33%
- DSCR
- 1.33
- GRM
- 7.6
CMA / ARV
No comps found within radius.
Show comp detail 12 sales within ~0.75 mi
| Address | Dist | Beds/Ba | Sqft | Sold | Price | $/sf | Match |
|---|---|---|---|---|---|---|---|
| 1104 S 6th Ave | 0.07mi | 6/2.0 | — | 6mo | $375,000 | — | 71 |
| 1820 S 2nd Ave | 0.55mi | 6/— | — | 7mo | $500,000 | — | 56 |
| 505 S 9th Ave | 0.42mi | 7/4.0 (+1) | — | 10mo | $525,000 | — | 54 |
| 218 S 13th Ave | 0.69mi | 6/3.0 | — | 5mo | $465,000 | — | 47 |
| 510 S 10th Ave | 0.44mi | 5/3.0 (-1) | — | 14mo | $175,000 | — | 46 |
| 315 S 5th Ave | 0.53mi | 5/2.0 (-1) | — | 6mo | $360,000 | — | 45 |
| 136 S 10th Ave | 0.69mi | 6/2.0 | — | 3mo | $177,000 | — | 45 |
| 637 S 14th Ave | 0.51mi | 5/3.0 (-1) | — | 13mo | $375,000 | — | 44 |
| 146 S 9th Ave | 0.65mi | 7/3.0 (+1) | — | 6mo | $480,000 | — | 43 |
| 1846 S 15th Ave | 0.72mi | 5/6.0 (-1) | — | 4mo | $420,000 | — | 38 |
| 806 S 17th Ave | 0.68mi | 5/3.0 (-1) | — | 12mo | $405,000 | — | 36 |
| 1110 Oak St | 0.67mi | 5/3.0 (-1) | — | 20mo | $295,000 | — | 30 |
Match score weights: distance 35% · size 25% · config 20% · recency 20%. Top-matched comps best support the ARV.
Projected returns pro-forma
-3.0% appreciation · 3.0% rent growth · sell at horizon
- IRR
- -5.1%
- Equity multiple
- 0.81×
- Total profit
- $-21,175
- Equity at exit
- $59,626
- IRR
- 4.6%
- Equity multiple
- 1.34×
- Total profit
- $37,920
- Equity at exit
- $34,576
Cash invested: $111,972 (down + closing). Projections, not guarantees.
Landlord ↔ Tenant lean methodology
- Overall (STATE)
- 43 Moderately Tenant-Leaning
- State Illinois
- 43 Moderately Tenant-Leaning · D+7
- County
- — inherits STATE
- City
- — inherits STATE
ZIP-level market 60153
- Home prices YoY
- -20.5%
- Active inventory
- 72
- Price-to-rent
- 15.3×
Monthly cashflow live
- Estimated rent
- $4,364 high interval (Pro) →
- Mortgage (P&I)
- −$2,097
- Tax est. 1.5%
- −$500 /mo · $5,998/yr
- Insurance
- −$167
- HOA
- −$0
- Lot rent
- −$0
- Vacancy / Maint / Mgmt
- −$916
- Net cashflow
- $684
Break-even live
Sensitivity live
| Price | -10% $960 | -5% $822 | +0% $684 | +5% $546 | +10% $408 |
|---|---|---|---|---|---|
| Rent | -10% $339 | -5% $512 | +0% $684 | +5% $856 | +10% $1,029 |
| Rate | -1.0pp $885 | -0.5pp $786 | base $684 | +0.5pp $580 | +1.0pp $475 |
2-unit breakdown (identical units grouped — click to expand)
| Units | Beds | Baths | Est. rent |
|---|---|---|---|
| 2× units | 3 | 2 | $4,364 |
| #1 | 3 | 2 | $2,182 |
| #2 | 3 | 2 | $2,182 |
| Total (2 units) | $4,364 | ||
UW: 25.0% down · 7.5% · 30yr · 1.5% tax · 5.0% vac · 8.0% maint · 8.0% mgmt
Financing live
Cash to close
- Down payment
- $99,975
- Closing costs
- $11,997
- Reserves months
- —
- Total cash needed
- —
Loan-product check · same deal, 3 products live
Conventional
25% down · 7.5% · 30yr
- Down + closing
- —
- Monthly P&I
- —
- Monthly cashflow
- —
- DSCR
- —
- Eligible?
- —
Personal DTI + credit; lowest rate.
DSCR
20% down · 8.5% · 30yr
- Down + closing
- —
- Monthly P&I
- —
- Monthly cashflow
- —
- DSCR
- —
- Eligible?
- —
No personal income docs; deal must DSCR.
Hard money
10% down · 12.0% · 12mo
- Down + closing
- —
- Monthly P&I
- —
- Monthly cashflow
- —
- DSCR
- —
- Eligible?
- —
Short-term bridge; refi at stabilization.
Rent comps 2 comps
| Address | Beds | Baths | Sqft | Rent | $/sqft | DOM | Units | Dist |
|---|---|---|---|---|---|---|---|---|
| 1508 S 1st Ave Maywood, IL | 6.0 | 2.0 | 2500 | $3,000 | $1.20 | 0d | 1 | 0.41mi |
| 714 Broadway St Melrose Park, IL | 5.0 | 1.5 | 1600 | $3,000 | $1.88 | 0d | 1 | 1.42mi |
Listing history 30 events
-
2026-06-22days on market $399,900 Active 141 DOM
-
2026-06-21days on market $399,900 Active 140 DOM
-
2026-06-18days on market $399,900 Active 137 DOM
-
2026-06-17days on market $399,900 Active 136 DOM
-
2026-06-16days on market $399,900 Active 135 DOM
-
2026-06-15days on market $399,900 Active 134 DOM
-
2026-06-13days on market $399,900 Active 132 DOM
-
2026-06-13days on market $399,900 Active 131 DOM
-
2026-06-09days on market $399,900 Active 128 DOM
-
2026-06-08days on market $399,900 Active 127 DOM
-
2026-06-07days on market $399,900 Active 126 DOM
-
2026-06-04days on market $399,900 Active 123 DOM
-
2026-06-03days on market $399,900 Active 122 DOM
-
2026-06-02days on market $399,900 Active 121 DOM
-
2026-06-02status $399,900 Active 120 DOM
-
2026-04-30status Pending
-
2026-04-15price $399,900
-
2026-03-27status Active
-
2026-03-19status Pending
-
2026-03-11status Active
-
2026-03-06status Pending
-
2026-02-08price $409,900
-
2025-12-26historical
-
2025-12-18$419,900 Active
-
2018-03-31status Contingent (Do Not Show)
-
2018-03-31historical
-
2018-03-09price
-
2018-03-08status Reactivated
-
2018-01-31status Contingent (Do Not Show)
-
2017-12-04New
ⓘ Source: listings_history table (triggers on properties + properties_extension) + one-shot
backfill from property_details.listing_events for pre-trigger history.
Climate risk First Street
- Flood 4/10 Moderate FEMA zone X (unshaded) · 20% chance over 30 yrs
- Wildfire 1/10 Low
- Heat 3/10 Moderate 7 d/yr ≥100°F today · 14 d/yr by 30 yrs out
- Wind 2/10 Low
- Air quality 5/10 Major 6 unhealthy d/yr today · 8 by 30 yrs out
Nearby sold comps map
Loading sold comps map…
Walkable amenities ~0.75 mi
Loading nearby amenities…
Taxation est. · year 1
- Rental income
- $52,368
- − Mortgage interest
- −$22,401
- − Property taxes
- −$5,998
- − Insurance
- −$2,000
- − Repairs & maintenance
- −$4,189
- − Management
- −$4,189
- − Depreciation
- −$11,633
- Taxable income
- $1,957
- Est. tax owed @ 24.0%
- −$470
- After-tax cash flow
- $7,738/yr
For passive investors: Depreciation is non-cash, so a rental often shows a tax loss while cash-flowing — sheltering income. Rental losses are passive: they offset passive income freely, and up to $25,000/yr can offset ordinary (W-2) income if you actively participate and your MAGI is under $100k (phasing out to $0 by $150k); unused losses carry forward. On sale, claimed depreciation is recaptured at up to 25%, and gains may owe capital-gains tax (a 1031 exchange can defer both). Figures are a year-1 estimate at your 24.0% rate — not tax advice; consult a CPA.
Schools (NCES district)
- District
- Maywood-Melrose Park-Broadview 89
- NCES district ID
- 1725110
- Math proficiency
- 14% ▲ 1.00%
- Reading proficiency
- 21% ▲ 4.00%
- Median HH income
- $45,567
- Composite
- 18.75/100
- National rank
- #14003
- State rank
- #738 of 919 in IL
Livability — Maywood
- Score
- 78/100
- State rank
- #146
- US rank
- #2694
Category grades
Schools grade is shown separately in the Schools card above.
Census & demographics
- Census place
- Maywood, IL
- County
- Cook County · 4,486,803 people
- City population
- 23,201
- Metro
- Chicago-Naperville-Elgin, IL-IN-WI
- Population (ZIP)
- 23,201
- Household income
- $68,815
- Rent vs Own
- Severe rent burden
- 869.0
Population outlook (Cook County) Hauer SSP2
- Today (2025)
- 5,347,519 people
- By 2030
- 5,357,703 · +0.2%
- By 2040
- 5,324,924 · -0.4%
- By 2050
- 5,230,762 · -2.2%
- By 2075
- 4,785,735 · -10.5%
- By 2100
- 4,188,836 · -21.7%
Race, ethnicity, and origin ACS 2023
- Neighborhood character
- Diverse neighborhood (Simpson 0.56)
- Race & ethnicity
- Black 57% Hispanic / Latino 33% Two or more races 11% White 6%
- Hispanic origin (detail)
- Mexican 28% Puerto Rican 3%
- Common ancestry
- Romanian 1% British 1%
- Foreign-born
- 14% · Canada, Jamaica
- Languages at home
- 68% English-only · Spanish 30% French/Haitian/Cajun 2%
Political lean MEDSL · Cook
- 2024 margin
- Solid D (+42.0) · D 70.4% · R 28.4% · Other 1.2%
- 2008→2024 swing
- -11.4pp toward R · 2008: 53.4pp · 2024: 42.0pp
- All cycles
- 2024: D+42.0 2020: D+50.3 2016: D+53.0 2012: D+49.4 2008: D+53.4
Not yet ingested
- Civics
- —
Market trends
- HPI YoY
- ▼ -86.90%
- Current HPI
- 336.2159
- Rent YoY
- —
- Metro
- Chicago-Naperville-Elgin, IL-IN-WI
- State GDP YoY
- ▲ 1.59%
- F500 in state
- 60
Industry mix (Fortune 500 HQ in IL)
| Industry | F500 HQs | Revenue |
|---|---|---|
| Insurance | 4 | $201B |
|
||
| Consumer Goods | 4 | $87B |
|
||
| Industrial Machinery | 3 | $64B |
|
||
| Healthcare | 2 | $55B |
|
||
| Retail / Pharmacy | 1 | $148B |
|
||
| Agriculture / Food | 1 | $86B |
|
||
Price history
-4.8% since first listed15 events — show timeline
- 2026-04-30 Pending — MRED as Distributed by MLS Grid
- 2026-04-15 Price Changed $399,900 MRED as Distributed by MLS Grid
- 2026-03-27 Relisted — MRED as Distributed by MLS Grid
- 2026-03-19 Pending — MRED as Distributed by MLS Grid
- 2026-03-11 Relisted — MRED as Distributed by MLS Grid
- 2026-03-06 Pending — MRED as Distributed by MLS Grid
- 2026-02-08 Price Changed $409,900 MRED as Distributed by MLS Grid
- 2025-12-26 Listing Removed — MRED as Distributed by MLS Grid
- 2025-12-18 Listed $419,900 MRED as Distributed by MLS Grid
- 2018-03-31 Pending — MRED as Distributed by MLS Grid
- 2018-03-31 Listing Removed — MRED as Distributed by MLS Grid
- 2018-03-09 Price Changed — MRED as Distributed by MLS Grid
- 2018-03-08 Relisted — MRED as Distributed by MLS Grid
- 2018-01-31 Pending — MRED as Distributed by MLS Grid
- 2017-12-04 Listed — MRED as Distributed by MLS Grid
Cash-flow waterfall
monthlySold comps — $/sqft
last 12 mo · ≤1 miLoading sold comps…