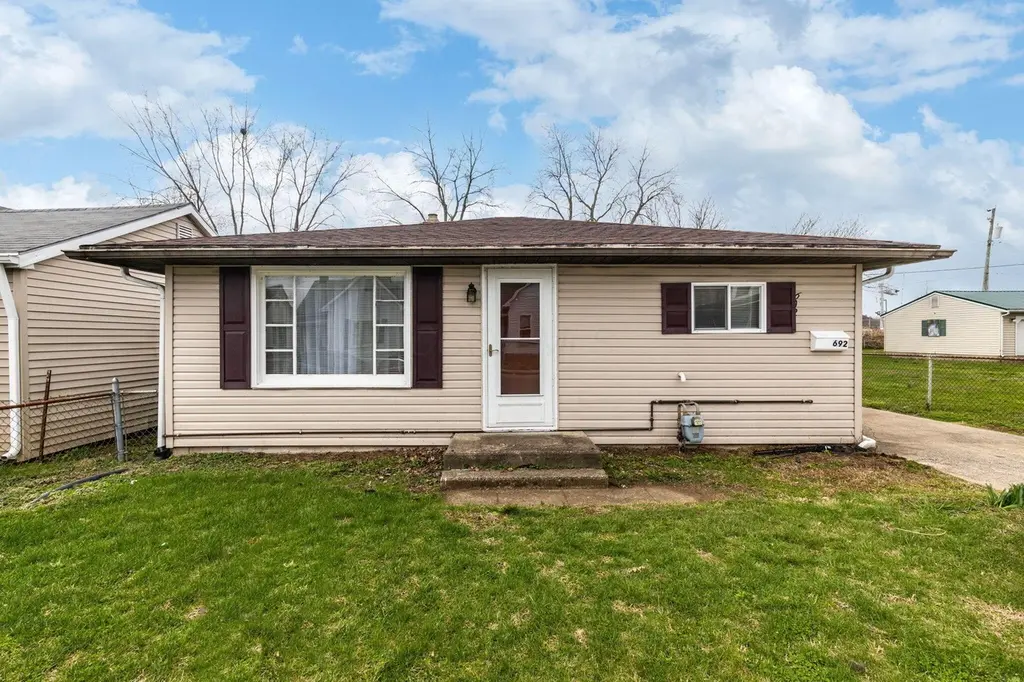
692 Washington Ave · Chillicothe, OH
Flood risk 1/10 · Minimal
- FEMA flood zone
- X (unshaded)
- Chance of flooding over 30 yrs
- 0.0%
- Est. flood insurance / yr
- $507 – $1,088
Fire risk 1/10 · Minimal
- Est. fire insurance / yr
- $713 – $1,323
Heat risk 4/10 · Minor
- Hot days now (above 101°F)
- 7 days/yr
- Hot days in 30 yrs
- 18 days/yr
Wind risk 2/10 · Minimal
- Chance of severe wind over 30 yrs
- 1.0%
Air-quality risk 2/10 · Minimal
- Unhealthy air days now
- 1 days/yr
- Unhealthy air days in 30 yrs
- 2 days/yr
Risk factors via First Street. Map © Google.
Why this score? — see what drove the C+ grade
The composite is a weighted blend of 9 inputs, each scored 0–100. Each bar is that input's sub-score; the figure is the points it added to the 100-point composite (weight × sub-score).
- Cash flow +22.3/30.0
- ARV discount +15.0/15.0
- DSCR +7.2/10.0
- 1% rule +5.3/10.0
- Schools +3.5/10.0
- Livability +3.1/5.0
- Rent growth +2.5/5.0
- Condition / age +2.5/5.0
- Appreciation +0.0/10.0
$119,000
🖨 Deal sheet (PDF) 📄 Offer letter ✓ Due diligence
Listing remarks MLS
READY to move in or instant rental income. Great 2 bedroom/1 bath recently remodeled. Nice size eat in kitchen, laundy, living room and built on storage. Lean to storage unit in backyard is 26x22
Key facts
- 4,791 sq ft lot
- Parking
- Built 1959
Neighborhood map
What this means for you Summary
Snapshot
- This is a 2-bed/1.0-bath single-family listed at $119k.
Deal economics
- At list price, monthly cash flow is $197 ($2k/yr) — positive.
- The deal already cash-flows at list — no discount required.
- Meets the 1% rule at list price ($1k rent vs $119k).
- Recommended offer: $115k (3.0% below list) — sets the bar for market timing.
- Cap rate 8.3% vs local median 4.3% in Chillicothe — top-decile yield for the area; either an underpriced asset or a hidden risk that comps aren't pricing in. Stress-test before assuming the spread holds.
Location & tenants
- Location reads 62/100 on livability (#909 in OH) — a middle-class / working-renter tenant base. Strengths: cost of living A+, housing A+; Watch: employment D, crime D-, amenities F.
- Chillicothe City (town): math 36% / reading 47% proficiency, ranked #535 of 656 in OH (top 82%) — families likely to look elsewhere, expect single-tenant / working-renter base with shorter leases.
- Market conditions: 179 active listings in the ZIP; 24 units permitted in Ross County in 2024 (0 in 5+ unit buildings).
Forward outlook
- Local home prices are declining (-3.0%/yr); year-one equity from $823 of loan paydown is wiped out by about $4k of value loss. Plan a longer hold.
- Ross County population projected at -12% by 2050 — secular population decline; favor cash flow + early exit over multi-decade hold.
Negotiation context
- It's been on market 32 days — a 3% lower offer ($115k) is reasonable based on typical stale-listing flexibility.
- 3 sale attempts since 7y ago with the ask held roughly flat each time — persistent listings suggest the price (not the market) is what's stuck; bring a comps-based counter.
- Current owner paid $90k; 32% above their basis — modest negotiation headroom, anchor on the comps not their cost.
Risks & watch-outs
- Watch-outs: built in 1959 — expect roof / HVAC / electrical / plumbing capex.
Questions for the listing agent
- It's been on market 32 days. Have you received any prior offers? Is the seller open to a 3% concession, seller financing, or rate buy-down credit?
- Built in 1959 — when were the roof, HVAC, electrical panel, plumbing, and water heater last replaced?
- Is there a deadline driving the sale (1031 exchange, divorce, estate, relocation)? That informs how much negotiation room exists.
- Schools are B-rated — typically a magnet for longer-tenancy family renters. What's the average tenant stay here, and is there a school-zone premium baked into asking?
- Crime grade is D in this area — have there been break-ins, vandalism, or insurance claims at this property in the last 3 years? What carrier currently insures it and at what premium?
- What's the average days-on-market for RENTAL listings here right now (not sales)? A rising rental-DOM trend means longer vacancies and softer asking-rent achievability than the comps imply.
- What's the recent tenant-quality profile in this submarket — average credit score on applications, eviction rate, late-payment / NSF rate, and stable-employment percentage? A property-management company in the area should have these aggregated.
- How much new for-sale + rental construction is in the pipeline within 1–3 miles? Heavy new supply typically softens prices + rents 12–24 months out; constrained supply supports both.
Investment metrics
- 1% rule
- 1.03% ✓
- Cap rate
- 8.28%
- Cash-on-cash
- 7.08%
- DSCR
- 1.32
- GRM
- 8.1
CMA / ARV
- ARV (on-the-fly)
- $155,104
- Comps found
- 12
Show comp detail 12 sales within ~0.75 mi
| Address | Dist | Beds/Ba | Sqft | Sold | Price | $/sf | Match |
|---|---|---|---|---|---|---|---|
| 831 Jefferson Ave | 0.20mi | 2/1.0 | 1,028 (-2%) | 7mo | $75,500 | $73 | 82 |
| 623 Glencroft Ave | 0.25mi | 3/1.0 (+1) | 1,056 (+1%) | 2mo | $145,000 | $137 | 81 |
| 619 E 2nd St | 0.43mi | 2/1.0 | 1,056 (+1%) | 2mo | $156,000 | $148 | 77 |
| 748 Jefferson Ave | 0.13mi | 3/1.0 (+1) | 960 (-8%) | 4mo | $159,900 | $167 | 72 |
| 760 E 4th St | 0.25mi | 3/2.0 (+1) | 1,120 (+7%) | 2mo | $175,000 | $156 | 66 |
| 863 Adams Ave | 0.24mi | 2/1.0 | 928 (-12%) | 4mo | $52,000 | $56 | 66 |
| 910 Madison Ave | 0.30mi | 3/1.0 (+1) | 936 (-11%) | 1mo | $165,000 | $176 | 63 |
| 329 Eastern Ave | 0.57mi | 3/1.0 (+1) | 1,022 (-2%) | 8mo | $123,500 | $121 | 57 |
| 783 Adams Ave | 0.13mi | 3/2.0 (+1) | 1,190 (+14%) | 7mo | $135,000 | $113 | 57 |
| 23 N Brownell St | 0.37mi | 3/1.0 (+1) | 910 (-13%) | 2mo | $149,900 | $165 | 54 |
| 622 E Water St | 0.49mi | 2/1.0 | 940 (-10%) | 8mo | $115,000 | $122 | 53 |
| 945 Columbus St | 0.45mi | 3/1.0 (+1) | 1,152 (+10%) | 8mo | $189,900 | $165 | 51 |
Match score weights: distance 35% · size 25% · config 20% · recency 20%. Top-matched comps best support the ARV.
Projected returns pro-forma
-3.0% appreciation · 3.0% rent growth · sell at horizon
- IRR
- -5.5%
- Equity multiple
- 0.80×
- Total profit
- $-6,772
- Equity at exit
- $17,743
- IRR
- 4.2%
- Equity multiple
- 1.31×
- Total profit
- $10,173
- Equity at exit
- $10,289
Cash invested: $33,320 (down + closing). Projections, not guarantees.
Landlord ↔ Tenant lean methodology
- Overall (STATE)
- 73 Landlord-Friendly
- State Ohio
- 73 Landlord-Friendly · R+6
- County
- — inherits STATE
- City
- — inherits STATE
ZIP-level market 45601
- Active inventory
- 179
- Price-to-rent
- 8.1×
Monthly cashflow live
- Estimated rent
- $1,222 medium interval (Pro) →
- Mortgage (P&I)
- −$624
- Tax from tax record
- −$95 /mo · $1,137/yr
- Insurance
- −$50
- HOA
- −$0
- Vacancy / Maint / Mgmt
- −$257
- Net cashflow
- $197
Break-even live
Sensitivity live
| Price | -10% $264 | -5% $230 | +0% $197 | +5% $163 | +10% $129 |
|---|---|---|---|---|---|
| Rent | -10% $100 | -5% $148 | +0% $197 | +5% $245 | +10% $293 |
| Rate | -1.0pp $257 | -0.5pp $227 | base $197 | +0.5pp $166 | +1.0pp $134 |
UW: 25.0% down · 7.5% · 30yr · 1.5% tax · 5.0% vac · 8.0% maint · 8.0% mgmt
Financing live
Cash to close
- Down payment
- $29,750
- Closing costs
- $3,570
- Reserves months
- —
- Total cash needed
- —
Loan-product check · same deal, 3 products live
Conventional
25% down · 7.5% · 30yr
- Down + closing
- —
- Monthly P&I
- —
- Monthly cashflow
- —
- DSCR
- —
- Eligible?
- —
Personal DTI + credit; lowest rate.
DSCR
20% down · 8.5% · 30yr
- Down + closing
- —
- Monthly P&I
- —
- Monthly cashflow
- —
- DSCR
- —
- Eligible?
- —
No personal income docs; deal must DSCR.
Hard money
10% down · 12.0% · 12mo
- Down + closing
- —
- Monthly P&I
- —
- Monthly cashflow
- —
- DSCR
- —
- Eligible?
- —
Short-term bridge; refi at stabilization.
Listing history 11 events
-
2026-04-23status Pending
-
2026-04-17price $119,000
-
2026-03-22$125,000 Active
-
2026-03-20historical $125,000
-
2023-02-08soldstatus $89,900
-
2023-02-06soldstatus $89,900 195-char remark
Show marketing remark (195 chars)
READY to move in or instant rental income. Great 2 bedroom/1 bath recently remodeled. Nice size eat in kitchen, laundy, living room and built on storage. Lean to storage unit in backyard is 26x22
-
2022-12-21$84,500 195-char remark
Show marketing remark (195 chars)
READY to move in or instant rental income. Great 2 bedroom/1 bath recently remodeled. Nice size eat in kitchen, laundy, living room and built on storage. Lean to storage unit in backyard is 26x22
-
2019-10-30soldstatus $31,000
-
2019-10-29soldstatus $38,000
-
2019-06-18$44,500
-
2017-06-09soldstatus $162,000
ⓘ Source: listings_history table (triggers on properties + properties_extension) + one-shot
backfill from property_details.listing_events for pre-trigger history.
Tax reassessment forecast OH · Partial reset (capped growth)
- Current annual tax
- $1,137 · $95/mo
- Projected year-2 tax
- $1,497 · $125/mo
- Expected delta
- +$360/yr (+$30/mo · 31.6%)
ⓘ Screening estimate from a state-policy table — verify with the county assessor before closing.
Climate risk First Street
- Flood 1/10 Low FEMA zone X (unshaded) · 0% chance over 30 yrs
- Wildfire 1/10 Low
- Heat 4/10 Moderate 7 d/yr ≥101°F today · 18 d/yr by 30 yrs out
- Wind 2/10 Low 100% chance of damaging wind over 30 yrs
- Air quality 2/10 Low 1 unhealthy d/yr today · 2 by 30 yrs out
Nearby sold comps map
Loading sold comps map…
Walkable amenities ~0.75 mi
Loading nearby amenities…
Taxation est. · year 1
- Rental income
- $14,659
- − Mortgage interest
- −$6,666
- − Property taxes
- −$1,137
- − Insurance
- −$595
- − Repairs & maintenance
- −$1,173
- − Management
- −$1,173
- − Depreciation
- −$3,462
- Taxable income
- $454
- Est. tax owed @ 24.0%
- −$109
- After-tax cash flow
- $2,251/yr
For passive investors: Depreciation is non-cash, so a rental often shows a tax loss while cash-flowing — sheltering income. Rental losses are passive: they offset passive income freely, and up to $25,000/yr can offset ordinary (W-2) income if you actively participate and your MAGI is under $100k (phasing out to $0 by $150k); unused losses carry forward. On sale, claimed depreciation is recaptured at up to 25%, and gains may owe capital-gains tax (a 1031 exchange can defer both). Figures are a year-1 estimate at your 24.0% rate — not tax advice; consult a CPA.
Schools (NCES district)
- District
- Chillicothe City
- NCES district ID
- 3904374
- Math proficiency
- 36% ▼ -12.00%
- Reading proficiency
- 47% ▼ -11.00%
- Median HH income
- $37,990
- Composite
- 34.55/100
- National rank
- #5174
- State rank
- #535 of 656 in OH
Livability — Chillicothe
- Score
- 62/100
- State rank
- #909
- US rank
- #17195
Category grades
Schools grade is shown separately in the Schools card above.
Census & demographics
- Census place
- Chillicothe, OH
- County
- Ross · 75,517 people
- Population (ZIP)
- 56,453
- Household income
- $57,430
- Rent vs Own
- Severe rent burden
- 10.6
Population outlook (Ross County) Hauer SSP2
- Today (2025)
- 75,482 people
- By 2030
- 74,035 · -1.9%
- By 2040
- 70,702 · -6.3%
- By 2050
- 66,706 · -11.6%
- By 2075
- 55,398 · -26.6%
- By 2100
- 42,197 · -44.1%
Race, ethnicity, and origin ACS 2023
- Neighborhood character
- Predominantly White (86%)
- Race & ethnicity
- White 86% Black 7% Two or more races 4% Hispanic / Latino 2%
- Common ancestry
- Slovak 2% Iranian 1% Italian 1%
- Foreign-born
- 1% · Canada
- Languages at home
- 98% English-only · Spanish 1%
Political lean MEDSL · Ross
- 2024 margin
- Solid R (+39.3) · D 29.9% · R 69.2%
- 2008→2024 swing
- -32.1pp toward R · 2008: -7.2pp · 2024: -39.3pp
- All cycles
- 2024: R+39.3 2020: R+35.2 2016: R+27.4 2012: R+2.4 2008: R+7.2
Not yet ingested
- Civics
- —
Market trends
- HPI YoY
- ▼ -231.40%
- Current HPI
- 205.7051
- Rent YoY
- —
- Metro
- —
- State GDP YoY
- ▲ 1.98%
- F500 in state
- 48
Industry mix (Fortune 500 HQ in OH)
| Industry | F500 HQs | Revenue |
|---|---|---|
| Insurance | 3 | $145B |
|
||
| Industrial Machinery | 3 | $49B |
|
||
| Financial Services | 3 | $24B |
|
||
| Consumer Goods | 2 | $93B |
|
||
| Aerospace / Defense | 2 | $47B |
|
||
| Utilities | 2 | $33B |
|
||
Price history
-26.5% since first listed11 events — show timeline
- 2026-04-23 Pending — CBRMLS
- 2026-04-17 Price Changed $119,000 CBRMLS
- 2026-03-22 Listed $125,000 CBRMLS
- 2026-03-20 Coming Soon $125,000 CBRMLS
- 2023-02-08 Sold (Public Records) $89,900 Public Records
- 2023-02-06 Sold (MLS) $89,900 SVAR
- 2022-12-21 Listed $84,500 SVAR
- 2019-10-30 Sold (Public Records) $31,000 Public Records
- 2019-10-29 Sold (MLS) $38,000 SVAR
- 2019-06-18 Listed $44,500 SVAR
- 2017-06-09 Sold (Public Records) $162,000 Public Records
Property tax history
-0.8%/yrLatest (2025): $1,137 · +18.2% YoY. Source: county tax records.
Cash-flow waterfall
monthlySold comps — $/sqft
last 12 mo · ≤1 miLoading sold comps…