 Triplex
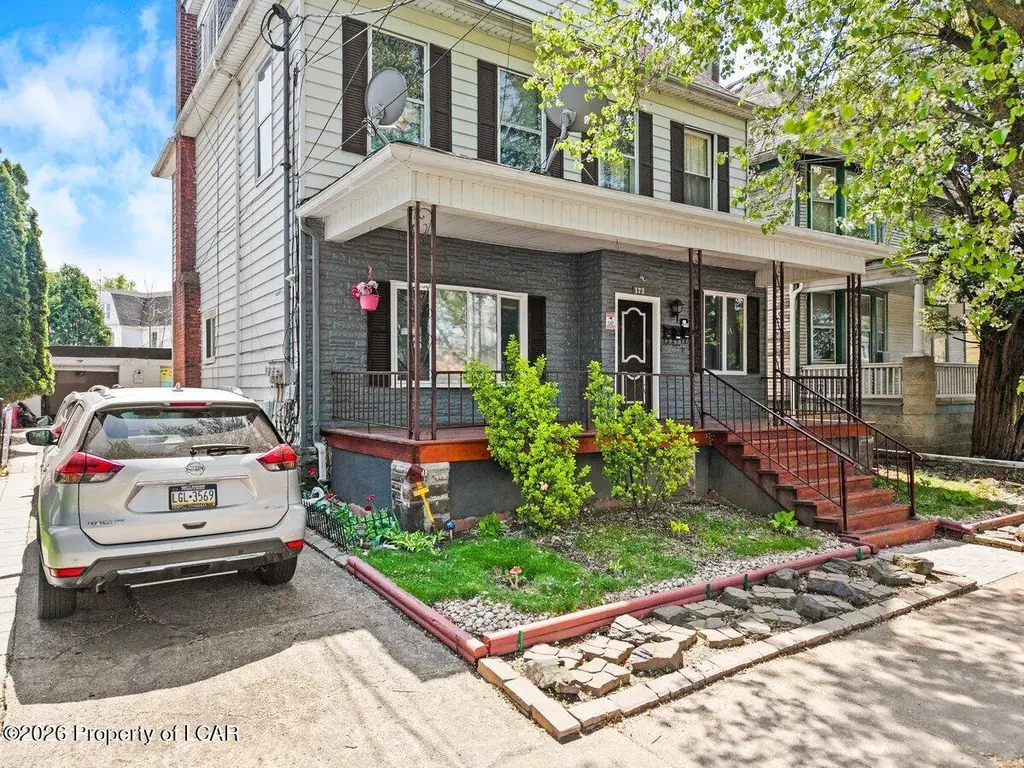
172 Carey Ave · Wilkes-Barre, PA
Flood risk 6/10 · Moderate
- FEMA flood zone
- X
- Chance of flooding over 30 yrs
- 0.27%
- Est. flood insurance / yr
- $507 – $1,088
Fire risk 3/10 · Minor
- Est. fire insurance / yr
- $511 – $949
Heat risk 4/10 · Minor
- Hot days now (above 97°F)
- 7 days/yr
- Hot days in 30 yrs
- 16 days/yr
Wind risk 3/10 · Minor
- Chance of severe wind over 30 yrs
- 5.0%
Air-quality risk 2/10 · Minimal
- Unhealthy air days now
- 1 days/yr
- Unhealthy air days in 30 yrs
- 2 days/yr
Risk factors via First Street. Map © Google.
Why this score? — see what drove the C+ grade
The composite is a weighted blend of 9 inputs, each scored 0–100. Each bar is that input's sub-score; the figure is the points it added to the 100-point composite (weight × sub-score).
- Cash flow +30.0/30.0
- DSCR +10.0/10.0
- 1% rule +9.4/10.0
- Rent growth +4.2/5.0
- Livability +2.5/5.0
- Condition / age +2.5/5.0
- Schools +2.1/10.0
- ARV discount +0.0/15.0
- Appreciation +0.0/10.0
$340,000
🖨 Deal sheet 📄 Offer letter ✓ Due diligence
Multi-family units
County records classify this as Multi-Family (2-4 Unit). Listing-text estimate: 3 units. confirmed
Listing remarks
Well-maintained 3-unit property offering opportunity for both owner occupant and investor. This versatile property features a two-car garage along with additional off-street parking for up to four vehicles. Each unit is equipped with its own separate electrical panel and includes washer and dryer hookups, providing added convenience for tenants. Current rents are below market value,
Key facts
- 4,720 sq ft lot
- 2 garage spots
- Listed 12 days
Property features AI
Exterior
- Parking: Detached garage; Off-street parking; 2 garage spaces
- Utilities: Public water; Public sewer
- Home design: Residential income property; Multi-family
- Construction: Vinyl siding
- Exterior features: Patio; Porch; Fenced yard
Interior
- Heating & cooling: Electric heating; Natural gas available; Baseboard heating; Forced air
- Interior features: Electric water heater; Basement present
Neighborhood map
What this means for you Summary
Snapshot
- This is a 3 × 5-bed/4.0-bath units multifamily listed at $340k.
Deal economics
- At list price, monthly cash flow is $2k ($18k/yr) — positive. Per door: $510/mo.
- The deal already cash-flows at list — no discount required.
- Meets the 1% rule at list price ($5k rent vs $340k).
- Cap rate 11.7% vs local median 5.7% in Wilkes-Barre — top-decile yield for the area; either an underpriced asset or a hidden risk that comps aren't pricing in. Stress-test before assuming the spread holds.
Location & tenants
- Location reads: area grade C — affects rentability + tenant quality, not the cash-flow math above.
- Wilkes-Barre Area SD (urban): math 19% / reading 32% proficiency, ranked #469 of 539 in PA (top 87%) — low school quality limits family demand, transient renter base, plan for 1-2y turnover; 61% free/reduced lunch — lower-income household profile, screen leases tightly.
- Market conditions: Rents rising fast (+6.8%/yr); 221 active listings in the ZIP; 349 units permitted in Luzerne County in 2024 (16 in 5+ unit buildings).
- At $4,912/mo this rent would consume 105% of the median local household income ($56k/yr) (locally 1632% of renters already pay >50% of income on rent) — very limited rent-growth headroom before tenants either downsize or default.
Forward outlook
- Local home prices are declining (-3.0%/yr); year-one equity from $2k of loan paydown is wiped out by about $10k of value loss. Plan a longer hold.
- Luzerne County population projected at +4% by 2050 — modest demand growth; plan on rents tracking national, not racing it.
- At projected returns (-3.0% appreciation + 6.8% rent growth), your $95k cash investment doubles in ~6 years — after that, you're playing with house money.
Negotiation context
- Only 12 days on market — expect competitive offers; lowballing is unlikely to land.
- Current owner paid $113k; list at $340k implies a 201% gain — meaningful room to come down on a strong offer.
Risks & watch-outs
- Watch-outs: built in 1930 — expect roof / HVAC / electrical / plumbing capex.
- Climate carrying-cost: major flood risk — expect insurance premiums to compound above CPI over the hold.
Questions for the listing agent
- Can we see the unit-by-unit rent roll, current vacancy, and any below-market leases? What's the average tenancy length?
- What capital expenditures (roof, boiler, parking lot, exteriors) have been made in the last 5 years, and what's planned in the next 2?
- Built in 1930 — when were the roof, HVAC, electrical panel, plumbing, and water heater last replaced?
- Is there a deadline driving the sale (1031 exchange, divorce, estate, relocation)? That informs how much negotiation room exists.
- What's the average days-on-market for RENTAL listings here right now (not sales)? A rising rental-DOM trend means longer vacancies and softer asking-rent achievability than the comps imply.
- What's the recent tenant-quality profile in this submarket — average credit score on applications, eviction rate, late-payment / NSF rate, and stable-employment percentage? A property-management company in the area should have these aggregated.
- How much new apartment / multifamily construction is in the pipeline within 1–3 miles? Heavy new supply (>2% of stock underway) typically softens rents 12–24 months out; light construction supports rent growth.
Investment metrics
- 1% rule
- 1.44% ✓
- Cap rate
- 11.70%
- Cash-on-cash
- 19.30%
- DSCR
- 1.86
- GRM
- 5.8
CMA / ARV
- ARV (median comp)
- $268,896
- List price
- $340,000
- Delta
- 26.44%
- Verdict
- OVERPRICED
- Comps
- 20 within 1.0 mi
Projected returns pro-forma
-3.0% appreciation · 6.84% rent growth · sell at horizon
- IRR
- 15.5%
- Equity multiple
- 1.65×
- Total profit
- $62,188
- Equity at exit
- $50,695
- IRR
- 26.9%
- Equity multiple
- 3.81×
- Total profit
- $267,543
- Equity at exit
- $29,397
Cash invested: $95,200 (down + closing). Projections, not guarantees.
Landlord ↔ Tenant lean methodology
- Overall (STATE)
- 62 Landlord-Friendly
- State Pennsylvania
- 62 Landlord-Friendly · EVEN
- County
- — inherits STATE
- City
- — inherits STATE
ZIP-level market 18702
- Rents YoY
- 6.8%
- Active inventory
- 221
- Price-to-rent
- 17.3×
Monthly cashflow live
- Estimated rent
- $4,912 high interval (Pro) →
- Mortgage (P&I)
- −$1,783
- Tax est. 1.5%
- −$425 /mo · $5,100/yr
- Insurance
- −$142
- HOA
- −$0
- Vacancy / Maint / Mgmt
- −$1,032
- Net cashflow
- $1,531
Break-even live
3-unit breakdown (identical units grouped — click to expand)
| Units | Beds | Baths | Est. rent |
|---|---|---|---|
| 3× units | 5 | 4 | $4,911 |
| #1 | 5 | 4 | $1,637 |
| #2 | 5 | 4 | $1,637 |
| #3 | 5 | 4 | $1,637 |
| Total (3 units) | $4,912 | ||
UW: 25.0% down · 7.5% · 30yr · 1.5% tax · 5.0% vac · 8.0% maint · 8.0% mgmt
Financing live
Cash to close
- Down payment
- $85,000
- Closing costs
- $10,200
- Reserves months
- —
- Total cash needed
- —
Loan-product check · same deal, 3 products live
Conventional
25% down · 7.5% · 30yr
- Down + closing
- —
- Monthly P&I
- —
- Monthly cashflow
- —
- DSCR
- —
- Eligible?
- —
Personal DTI + credit; lowest rate.
DSCR
20% down · 8.5% · 30yr
- Down + closing
- —
- Monthly P&I
- —
- Monthly cashflow
- —
- DSCR
- —
- Eligible?
- —
No personal income docs; deal must DSCR.
Hard money
10% down · 12.0% · 12mo
- Down + closing
- —
- Monthly P&I
- —
- Monthly cashflow
- —
- DSCR
- —
- Eligible?
- —
Short-term bridge; refi at stabilization.
Listing history 3 events
-
2026-05-11status Pending 385-char remark
-
2026-04-29$340,000 Active 385-char remark
-
2006-04-18soldstatus $113,000
ⓘ Source: listings_history table (triggers on properties + properties_extension) + one-shot
backfill from property_details.listing_events for pre-trigger history.
Climate risk First Street
- Flood 6/10 Major FEMA zone X · 27% chance over 30 yrs
- Wildfire 3/10 Moderate
- Heat 4/10 Moderate 7 d/yr ≥97°F today · 16 d/yr by 30 yrs out
- Wind 3/10 Moderate 5% chance of damaging wind over 30 yrs
- Air quality 2/10 Low 1 unhealthy d/yr today · 2 by 30 yrs out
Nearby sold comps map
Loading sold comps map…
Walkable amenities ~0.75 mi
Loading nearby amenities…
Taxation est. · year 1
- Rental income
- $58,944
- − Mortgage interest
- −$19,045
- − Property taxes
- −$5,100
- − Insurance
- −$1,700
- − Repairs & maintenance
- −$4,716
- − Management
- −$4,716
- − Depreciation
- −$9,891
- Taxable income
- $13,777
- Est. tax owed @ 24.0%
- −$3,306
- After-tax cash flow
- $15,063/yr
For passive investors: Depreciation is non-cash, so a rental often shows a tax loss while cash-flowing — sheltering income. Rental losses are passive: they offset passive income freely, and up to $25,000/yr can offset ordinary (W-2) income if you actively participate and your MAGI is under $100k (phasing out to $0 by $150k); unused losses carry forward. On sale, claimed depreciation is recaptured at up to 25%, and gains may owe capital-gains tax (a 1031 exchange can defer both). Figures are a year-1 estimate at your 24.0% rate — not tax advice; consult a CPA.
Schools (NCES district)
- District
- Wilkes-Barre Area SD
- NCES district ID
- 4226300
- Math proficiency
- 19% ▼ -2.00%
- Reading proficiency
- 32% ▼ -9.00%
- Median HH income
- $37,420
- Composite
- 21.22/100
- National rank
- #8409
- State rank
- #469 of 539 in PA
Livability — Wilkes-Barre
No livability data for this city. (Only ~50 U.S. cities are tracked.)
Census & demographics
- Census place
- Wilkes-Barre, PA
- County
- Luzerne County · 118,885 people
- City population
- 73,981
- Metro
- Scranton--Wilkes-Barre, PA
- Population (ZIP)
- 41,970
- Household income
- $56,378
- Rent vs Own
- Severe rent burden
- 1632.0
Population outlook (Luzerne County) Hauer SSP2
- Today (2025)
- 319,505 people
- By 2030
- 319,943 · +0.1%
- By 2040
- 322,643 · +1.0%
- By 2050
- 330,817 · +3.5%
- By 2075
- 379,145 · +18.7%
- By 2100
- 431,908 · +35.2%
Race, ethnicity, and origin ACS 2023
- Neighborhood character
- Diverse neighborhood (Simpson 0.59)
- Race & ethnicity
- White 58% Hispanic / Latino 25% Black 12% Two or more races 11% Asian 2%
- Hispanic origin (detail)
- Mexican 6% Puerto Rican 6% Dominican 9%
- Common ancestry
- Romanian 14% Scotch-Irish 2% Iranian 1%
- Foreign-born
- 13% · Canada, Jamaica
- Languages at home
- 79% English-only · Spanish 17% Other Asian/Pacific 1% Other Indo-European 1%
Political lean MEDSL · Luzerne
- 2024 margin
- R (+19.2) · D 40.0% · R 59.2%
- 2008→2024 swing
- -27.6pp toward R · 2008: 8.4pp · 2024: -19.2pp
- All cycles
- 2024: R+19.2 2020: R+14.4 2016: R+19.6 2012: D+4.8 2008: D+8.4
Not yet ingested
- Civics
- —
Market trends
- HPI YoY
- ▼ -156.99%
- Current HPI
- 216.9373
- Rent YoY
- ▲ 6.84%
- Metro
- Scranton--Wilkes-Barre, PA
- State GDP YoY
- ▲ 1.68%
- F500 in state
- 34
Industry mix (Fortune 500 HQ in PA)
| Industry | F500 HQs | Revenue |
|---|---|---|
| Healthcare | 2 | $309B |
|
||
| Insurance | 2 | $27B |
|
||
| Telecommunications / Media | 1 | $124B |
|
||
| Industrial Distribution | 1 | $22B |
|
||
| Financial Services | 1 | $20B |
|
||
| Chemicals / Materials | 1 | $18B |
|
||
Price history
+200.9% since first listed3 events — show timeline
- 2026-05-11 Pending — LCAR
- 2026-04-29 Listed $340,000 LCAR
- 2006-04-18 Sold (Public Records) $113,000 Public Records
Property tax history
+20.4%/yrLatest (2026): $21,060 · +0.1% YoY. Source: county tax records.
Cash-flow waterfall
monthlySold comps — $/sqft
last 12 mo · ≤1 miLoading sold comps…