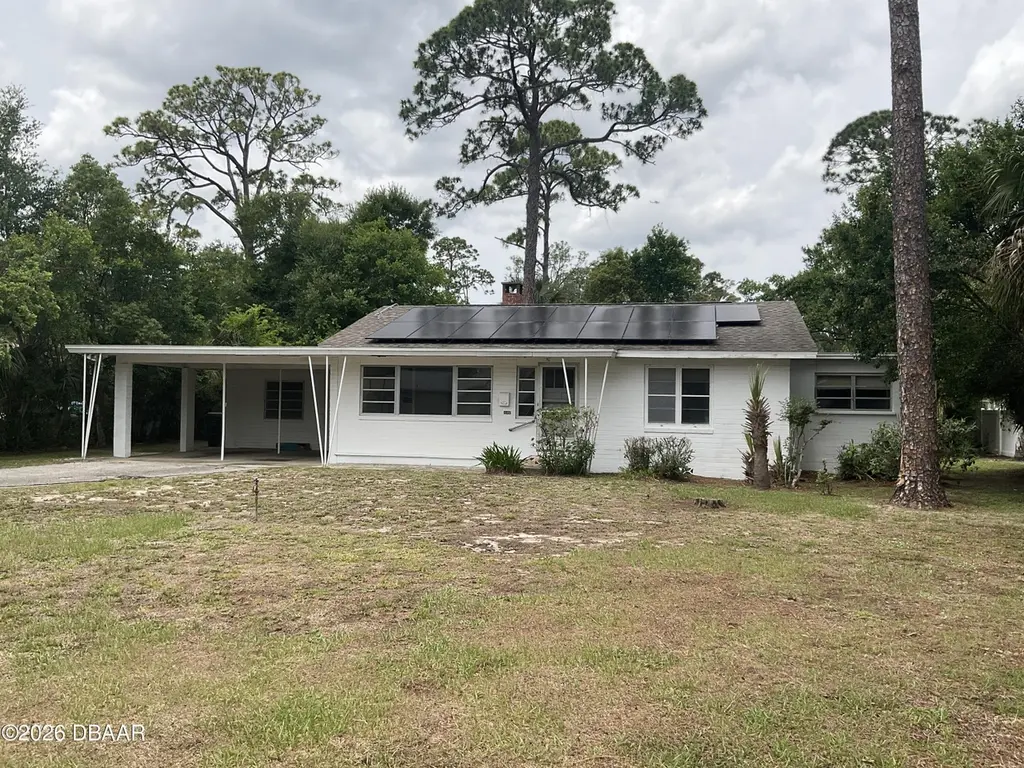
1120 Australia Ave · Daytona Beach, FL
Flood risk 1/10 · Minimal
- FEMA flood zone
- X (unshaded)
- Chance of flooding over 30 yrs
- 0.0%
- Est. flood insurance / yr
- $507 – $1,088
Fire risk 1/10 · Minimal
- Est. fire insurance / yr
- $947 – $1,759
Heat risk 10/10 · Severe
- Hot days now (above 104°F)
- 7 days/yr
- Hot days in 30 yrs
- 20 days/yr
Wind risk 10/10 · Severe
- Chance of severe wind over 30 yrs
- 99.0%
Air-quality risk 2/10 · Minimal
- Unhealthy air days now
- 2 days/yr
- Unhealthy air days in 30 yrs
- 2 days/yr
Risk factors via First Street. Map © Google.
Why this score? — see what drove the D grade
The composite is a weighted blend of 9 inputs, each scored 0–100. Each bar is that input's sub-score; the figure is the points it added to the 100-point composite (weight × sub-score).
- Cash flow +14.4/30.0
- ARV discount +7.5/15.0
- DSCR +4.4/10.0
- Livability +4.2/5.0
- Schools +3.9/10.0
- Rent growth +3.4/5.0
- 1% rule +2.8/10.0
- Condition / age +2.5/5.0
- Appreciation +0.0/10.0
$180,000
🖨 Deal sheet 📄 Offer letter ✓ Due diligence
Listing remarks
Incredible opportunity in the heart of historic Daytona Beach. Perched high on the Atlantic Coastal Ridge in the Daytona Highlands neighborhood. This is an established neighborhood connected to the city's rich history. The Daytona Highlands is the city's very first neighborhood & remains one of the most convenient places to live, offering the charm of mature surroundings along with quick access to Daytona Beach International Airport, The World's Most Famous Beach, Daytona State College, Embry Riddle Aeronautical University, Daytona International Speedway, Halifax Hospital, banking, dining & quick access to I-95 and I-4, Orlando, Jacksonville and St Augustine. This home offers yo
Key facts
- Quick access to i-4
- Quick access to i-95
- 0.29 acre lot
Tags
Property features AI
Exterior
- Parking: Attached garage; Attached carport; 2 carport spaces; RV access/parking
- Utilities: Public water; Public sewer; Electricity available; Natural gas available; Water and sewer connected
- Home design: Single-family residence; One story; Faces south
- Construction: Concrete construction; Block and slab foundation; Shingle roof; Built (year not provided)
- Exterior features: Covered front and rear porches; Porch; Guest house; City street frontage; Public maintained paved/asphalt road
Interior
- Kitchen: Refrigerator; Electric range; Disposal; Electric water heater
- Flooring: Hardwood; Carpet; Tile; Wood
- Bathrooms: 3 full bathrooms
- Heating & cooling: Central heating; Central air; Wall/window unit(s)
- Interior features: Eat-in kitchen; In-law floorplan; Fireplace (1)
Neighborhood map
What this means for you Summary
Snapshot
- This is a 2-bed/1.5-bath single-family listed at $180k.
Deal economics
- At list price, monthly cash flow is $38 ($454/yr) — positive.
- The deal already cash-flows at list — no discount required.
- To meet the 1% rule (rent ≥ 1% of price), the offer needs to be $141k (21.8% below list).
- Recommended offer: $141k (21.8% below list) — sets the bar for 1% rule.
Location & tenants
- Location reads 83/100 on livability (#46 in FL, #867 nationally) — a professional / high-income tenant draw. Strengths: amenities A+, commute A+, cost of living A+; Watch: schools D+, employment D-.
- Volusia (suburban): math 44% / reading 49% proficiency, ranked #47 of 73 in FL (top 64%) — families likely to look elsewhere, expect single-tenant / working-renter base with shorter leases.
- Market conditions: Rents rising (+3.6%/yr); 310 active listings in the ZIP; 19 comparable units currently listed for rent nearby; rentals at typical pace (median 24d on market — plan ~3-4 weeks tenant-placement turnaround); lower-income renter base — watch delinquency; 3,402 units permitted in Volusia County in 2024 (681 in 5+ unit buildings).
- This rent runs 40% of the median local income ($42k/yr) — at the standard rent-burdened threshold; future hikes will face affordability resistance.
Forward outlook
- Local home prices are declining (-3.0%/yr); year-one equity from $1k of loan paydown is wiped out by about $5k of value loss. Plan a longer hold.
- Volusia County population projected at +19% by 2050 — long-run rental-demand tailwind backs the buy-and-hold thesis.
Negotiation context
- It's been on market 40 days — a 3% lower offer ($175k) is reasonable based on typical stale-listing flexibility.
Risks & watch-outs
- Watch-outs: built in 1948 — expect roof / HVAC / electrical / plumbing capex.
- Climate carrying-cost: severe wind risk, 99% chance of damaging wind over 30y; extreme-heat days projected 7→20/yr by 2055 (HVAC capex compounding) — expect insurance premiums to compound above CPI over the hold.
Questions for the listing agent
- It's been on market 40 days. Have you received any prior offers? Is the seller open to a 22% concession, seller financing, or rate buy-down credit?
- Built in 1948 — when were the roof, HVAC, electrical panel, plumbing, and water heater last replaced?
- Is there a deadline driving the sale (1031 exchange, divorce, estate, relocation)? That informs how much negotiation room exists.
- Schools are D-rated, which usually means shorter tenancies and higher turnover. Who's the typical renter profile here, and what's been the actual vacancy rate?
- The area grade is low — what's the realistic commute time and amenity access for the typical tenant pool here? Any planned neighborhood developments (good or bad) we should know about?
- What's the average days-on-market for RENTAL listings here right now (not sales)? A rising rental-DOM trend means longer vacancies and softer asking-rent achievability than the comps imply.
- What's the recent tenant-quality profile in this submarket — average credit score on applications, eviction rate, late-payment / NSF rate, and stable-employment percentage? A property-management company in the area should have these aggregated.
- How much new for-sale + rental construction is in the pipeline within 1–3 miles? Heavy new supply typically softens prices + rents 12–24 months out; constrained supply supports both.
Investment metrics
- 1% rule
- 0.78% ✗
- Cap rate
- 6.55%
- Cash-on-cash
- 0.90%
- DSCR
- 1.04
- GRM
- 10.7
CMA / ARV
No comps found within radius.
Projected returns pro-forma
-3.0% appreciation · 3.57% rent growth · sell at horizon
- IRR
- -14.4%
- Equity multiple
- 0.48×
- Total profit
- $-26,029
- Equity at exit
- $26,839
- IRR
- -4.9%
- Equity multiple
- 0.67×
- Total profit
- $-16,527
- Equity at exit
- $15,563
Cash invested: $50,400 (down + closing). Projections, not guarantees.
Landlord ↔ Tenant lean methodology
- Overall (STATE)
- 87 Strongly Landlord-Friendly
- State Florida
- 87 Strongly Landlord-Friendly · R+3
- County
- — inherits STATE
- City
- — inherits STATE
ZIP-level market 32114
- Home prices YoY
- -21.8%
- Rents YoY
- 3.6%
- Active inventory
- 310
- Price-to-rent
- 10.7×
Monthly cashflow live
- Estimated rent
- $1,408 high interval (Pro) →
- Mortgage (P&I)
- −$944
- Tax from tax record
- −$56 /mo · $667/yr
- Insurance
- −$75
- HOA
- −$0
- Vacancy / Maint / Mgmt
- −$296
- Net cashflow
- $38
Break-even live
UW: 25.0% down · 7.5% · 30yr · 1.5% tax · 5.0% vac · 8.0% maint · 8.0% mgmt
Financing live
Cash to close
- Down payment
- $45,000
- Closing costs
- $5,400
- Reserves months
- —
- Total cash needed
- —
Loan-product check · same deal, 3 products live
Conventional
25% down · 7.5% · 30yr
- Down + closing
- —
- Monthly P&I
- —
- Monthly cashflow
- —
- DSCR
- —
- Eligible?
- —
Personal DTI + credit; lowest rate.
DSCR
20% down · 8.5% · 30yr
- Down + closing
- —
- Monthly P&I
- —
- Monthly cashflow
- —
- DSCR
- —
- Eligible?
- —
No personal income docs; deal must DSCR.
Hard money
10% down · 12.0% · 12mo
- Down + closing
- —
- Monthly P&I
- —
- Monthly cashflow
- —
- DSCR
- —
- Eligible?
- —
Short-term bridge; refi at stabilization.
Rent comps 19 comps
| Address | Beds | Baths | Sqft | Rent | $/sqft | DOM | Units | Dist |
|---|---|---|---|---|---|---|---|---|
| 860 Magnolia Ave Unit 3 Daytona Beach, FL | 2.0 | 1.0 | 800 | $1,300 | $1.62 | 19d | 1 | 0.80mi |
| 249 College Park Dr Daytona Beach, FL | 2.0 | 1.0 | 1000 | $1,425 | $1.43 | 21d | 1 | 1.08mi |
| 886 S Nova Rd Daytona Beach, FL | 1.0–2.0 | 1.0 | 685 | $1,260 | $1.84 | 11d | 10 | 1.18mi |
| 422 Henry Butts Dr Daytona Beach, FL | 1.0 | 1.0 | 851 | $875 | $1.03 | 23d | 1 | 1.23mi |
| 512 Fulton St Daytona Beach, FL | 2.0 | 1.0 | 963 | $1,600 | $1.66 | 23d | 1 | 1.26mi |
| 625 Holmes Ave Daytona Beach, FL | 2.0 | 1.0 | 768 | $995 | $1.30 | 21d | 1 | 1.29mi |
| 417 Jefferson St #1 Daytona Beach, FL | 2.0 | 1.0 | 700 | $1,890 | $2.70 | 23d | 1 | 1.29mi |
| 736 White St Daytona Beach, FL | 3.0 | 2.0 | 1092 | $1,799 | $1.65 | 23d | 1 | 1.30mi |
| 550 Ruth St Daytona Beach, FL | 3.0 | 2.0 | 1114 | $1,995 | $1.79 | 11d | 1 | 1.30mi |
| 908 Lora St Unit A Daytona Beach, FL | 2.0 | 1.0 | 775 | $1,300 | $1.68 | 23d | 1 | 1.32mi |
| 751 Bellevue Ave Unit 1 Daytona Beach, FL | 2.0 | 1.0 | 816 | $1,390 | $1.70 | 23d | 1 | 1.33mi |
| 736 Kentucky St Unit 3 Daytona Beach, FL | 2.0 | 1.0 | 850 | $1,300 | $1.53 | 14d | 1 | 1.35mi |
| 350 Maple St Daytona Beach, FL | 1.0 | 1.0 | 600 | $900 | $1.50 | 23d | 1 | 1.38mi |
| 1220 S Nova Rd Daytona Beach, FL | 1.0 | 1.0 | 576 | $955 | $1.66 | 11d | 11 | 1.39mi |
| 417 Maple St Daytona Beach, FL | 2.0 | 1.0 | 768 | $850 | $1.11 | 23d | 1 | 1.40mi |
| 601 Vera St Unit 601 Daytona Beach, FL | 2.0 | 1.0 | 1113 | $1,700 | $1.53 | 23d | 1 | 1.42mi |
| 940 Lockhart St Daytona Beach, FL | 3.0 | 2.0 | 1071 | $1,850 | $1.73 | 19d | 1 | 1.44mi |
| 538 Park Dr Daytona Beach, FL | 2.0 | 1.0 | 600 | $1,400 | $2.33 | 23d | 1 | 1.46mi |
| 528 Park Dr Daytona Beach, FL | 2.0 | 1.0 | 600 | $1,600 | $2.67 | 23d | 1 | 1.48mi |
Listing history 16 events
-
2026-06-18days on market $180,000 Active 40 DOM
-
2026-06-17days on market $180,000 Active 39 DOM
-
2026-06-16days on market $180,000 Active 38 DOM
-
2026-06-15days on market $180,000 Active 37 DOM
-
2026-06-14days on market $180,000 Active 35 DOM
-
2026-06-10days on market $180,000 Active 32 DOM
-
2026-06-09days on market $180,000 Active 31 DOM
-
2026-06-08days on market $180,000 Active 30 DOM
-
2026-06-07days on market $180,000 Active 29 DOM
-
2026-06-05days on market $180,000 Active 26 DOM
-
2026-06-03days on market $180,000 Active 25 DOM
-
2026-06-03days on market $180,000 Active 24 DOM
-
2026-06-01days on market $180,000 Active 23 DOM
-
2026-05-31days on market $180,000 Active 22 DOM
-
2026-05-31days on market $180,000 Active 21 DOM
-
2026-05-09$180,000 Active 991-char remark
ⓘ Source: listings_history table (triggers on properties + properties_extension) + one-shot
backfill from property_details.listing_events for pre-trigger history.
Tax reassessment forecast FL · Resets to sale price
- Current annual tax
- $667 · $56/mo
- Projected year-2 tax
- $1,494 · $124/mo
- Expected delta
- +$827/yr (+$69/mo · 123.9%)
ⓘ Screening estimate from a state-policy table — verify with the county assessor before closing.
Climate risk First Street
- Flood 1/10 Low FEMA zone X (unshaded) · 0% chance over 30 yrs
- Wildfire 1/10 Low
- Heat 10/10 Extreme 7 d/yr ≥104°F today · 20 d/yr by 30 yrs out
- Wind 10/10 Extreme 99% chance of damaging wind over 30 yrs
- Air quality 2/10 Low 2 unhealthy d/yr today · 2 by 30 yrs out
Nearby sold comps map
Loading sold comps map…
Walkable amenities ~0.75 mi
Loading nearby amenities…
Taxation est. · year 1
- Rental income
- $16,897
- − Mortgage interest
- −$10,083
- − Property taxes
- −$667
- − Insurance
- −$900
- − Repairs & maintenance
- −$1,352
- − Management
- −$1,352
- − Depreciation
- −$5,236
- Taxable loss
- −$2,693
- Est. tax savings @ 24.0%
- +$646
- After-tax cash flow
- $1,100/yr
For passive investors: Depreciation is non-cash, so a rental often shows a tax loss while cash-flowing — sheltering income. Rental losses are passive: they offset passive income freely, and up to $25,000/yr can offset ordinary (W-2) income if you actively participate and your MAGI is under $100k (phasing out to $0 by $150k); unused losses carry forward. On sale, claimed depreciation is recaptured at up to 25%, and gains may owe capital-gains tax (a 1031 exchange can defer both). Figures are a year-1 estimate at your 24.0% rate — not tax advice; consult a CPA.
Schools (NCES district)
- District
- Volusia
- NCES district ID
- 1201920
- Math proficiency
- 44% ▼ -9.00%
- Reading proficiency
- 49% ▼ -3.00%
- Median HH income
- $42,946
- Composite
- 39.2/100
- National rank
- #4019
- State rank
- #47 of 73 in FL
Livability — Daytona Beach
- Score
- 83/100
- State rank
- #46
- US rank
- #867
Category grades
Schools grade is shown separately in the Schools card above.
Census & demographics
- Census place
- Daytona Beach, FL
- County
- Volusia County · 556,871 people
- City population
- 67,539
- Metro
- Deltona-Daytona Beach-Ormond Beach, FL
- Population (ZIP)
- 37,747
- Household income
- $41,736
- Rent vs Own
- Severe rent burden
- 2772.0
Population outlook (Volusia County) Hauer SSP2
- Today (2025)
- 572,749 people
- By 2030
- 598,695 · +4.5%
- By 2040
- 644,880 · +12.6%
- By 2050
- 681,451 · +19.0%
- By 2075
- 759,957 · +32.7%
- By 2100
- 778,902 · +36.0%
Race, ethnicity, and origin ACS 2023
- Neighborhood character
- Diverse neighborhood (Simpson 0.65)
- Race & ethnicity
- Black 45% White 36% Hispanic / Latino 11% Two or more races 7% Asian 2%
- Hispanic origin (detail)
- Mexican 2% Puerto Rican 4%
- Common ancestry
- Romanian 1% Slovak 1% Lithuanian 1%
- Foreign-born
- 7% · Canada, South Korea
- Languages at home
- 90% English-only · Spanish 7% Arabic 1%
Political lean MEDSL · Volusia
- 2024 margin
- Strong R (+21.8) · D 38.7% · R 60.5%
- 2008→2024 swing
- -27.4pp toward R · 2008: 5.7pp · 2024: -21.8pp
- All cycles
- 2024: R+21.8 2020: R+14.1 2016: R+13.1 2012: R+1.2 2008: D+5.7
Not yet ingested
- Civics
- —
Market trends
- HPI YoY
- ▼ -75.93%
- Current HPI
- 272.5149
- Rent YoY
- ▲ 3.57%
- Metro
- Deltona-Daytona Beach-Ormond Beach, FL
- State GDP YoY
- ▲ 3.28%
- F500 in state
- 36
Industry mix (Fortune 500 HQ in FL)
| Industry | F500 HQs | Revenue |
|---|---|---|
| Industrial Technology | 2 | $29B |
|
||
| Insurance | 2 | $17B |
|
||
| Retail | 1 | $60B |
|
||
| Technology Distribution | 1 | $58B |
|
||
| Homebuilding | 1 | $35B |
|
||
| Technology Manufacturing | 1 | $35B |
|
||
Price history
1 event — show timeline
- 2026-05-09 Listed $180,000 Daytona MLS
Property tax history
-0.5%/yrLatest (2025): $667 · +5.0% YoY. Source: county tax records.
Cash-flow waterfall
monthlySold comps — $/sqft
last 12 mo · ≤1 miLoading sold comps…