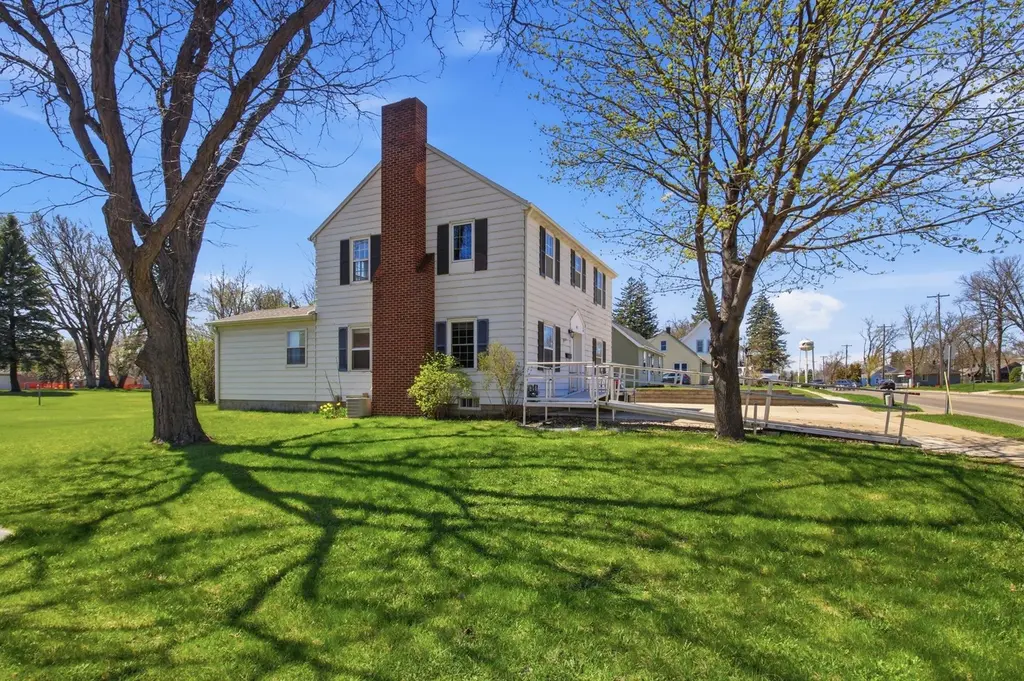
405 Willmar Ave SW · Willmar, MN
Flood risk No data
- FEMA flood zone
- —
- Chance of flooding over 30 yrs
- —
- Est. flood insurance / yr
- —
Fire risk No data
- Est. fire insurance / yr
- —
Heat risk No data
- Hot days now (above threshold)
- —
- Hot days in 30 yrs
- —
Wind risk No data
- Chance of severe wind over 30 yrs
- —
Air-quality risk No data
- Unhealthy air days now
- —
- Unhealthy air days in 30 yrs
- —
Risk factors via First Street. Map © Google.
Why this score? — see what drove the D grade
The composite is a weighted blend of 9 inputs, each scored 0–100. Each bar is that input's sub-score; the figure is the points it added to the 100-point composite (weight × sub-score).
- Cash flow +18.1/30.0
- DSCR +5.7/10.0
- 1% rule +4.9/10.0
- Livability +3.7/5.0
- Schools +3.1/10.0
- Rent growth +2.5/5.0
- Condition / age +2.2/5.0
- ARV discount +1.8/15.0
- Appreciation +0.0/10.0
$165,000
🖨 Deal sheet (PDF) 📄 Offer letter ✓ Due diligence
Listing remarks
Opportunity knocks! This property has great investment potential, or it could be your home. Conveniently located close to shops, . restaurants, clinics, schools etc. 4 bedrooms, 2 baths, main floor laundry. Large living area on the main floor. Many handicap accessible features. Call for your private showing today and be sure to check out the virtual tour!
Key facts
- Large living area
- Investment potential
- Conveniently located
Tags
Property features AI
Finance
- Financial info: Free and clear mortgage status
Exterior
- Parking: Concrete driveway; Detached 2-car garage (22 x 20)
- Utilities: City water connected; City sewer connected; Natural gas
- Home design: Residential property; Two levels; Main entry on main level
- Construction: Block foundation
- Exterior features: City street frontage; Publicly maintained road
Interior
- Kitchen: Range; Refrigerator
- Bedrooms: 4 bedrooms (three on upper level, one on main level)
- Bathrooms: Main level three-quarter bath; Upper level half bath
- Heating & cooling: Forced air heating; Central air conditioning
- Interior features: Separate formal dining room; Wood-burning fireplace; Has basement (block, unfinished); Grab bars in bathroom; Partially wheelchair accessible; Wheelchair ramp(s)
- Laundry & utility: Washer; Dryer (laundry on main level)
Neighborhood map
What this means for you Summary
Snapshot
- This is a 4-bed/2.0-bath single-family listed at $165k. Condition is rated fair.
Deal economics
- At list price, monthly cash flow is $144 ($2k/yr) — positive.
- The deal already cash-flows at list — no discount required.
- To meet the 1% rule (rent ≥ 1% of price), the offer needs to be $163k (1.4% below list).
- Recommended offer: $160k (3.0% below list) — sets the bar for market timing.
- Cap rate 7.3% vs local median 3.2% in Willmar — top-decile yield for the area; either an underpriced asset or a hidden risk that comps aren't pricing in. Stress-test before assuming the spread holds.
Location & tenants
- Location reads 73/100 on livability (#233 in MN, #4,984 nationally) — a middle-class / working-renter tenant base. Strengths: cost of living A+, housing A+, health & safety A+; Watch: employment C-, crime D+, amenities F.
- Willmar Public School District (town): math 34% / reading 38% proficiency, ranked #246 of 301 in MN (top 82%) — families likely to look elsewhere, expect single-tenant / working-renter base with shorter leases.
- Zoned schools: Kennedy Elementary (math 33% / reading 31%, grade F, #670 of 857 statewide, top 79%, 715 students, 75% FRL); Willmar Middle School (math 37% / reading 40%, grade F, #156 of 258 statewide, top 62%, 874 students, 69% FRL); Willmar Senior High (math 36% / reading 51%, grade F, #211 of 471 statewide, top 45%, 1,224 students, 63% FRL) — zoned schools average 69% FRL vs 50% district-wide (19 pts higher); higher-poverty schools than district average — tighter screening recommended.
- Market conditions: 159 active listings in the ZIP; 196 units permitted in Kandiyohi County in 2024 (118 in 5+ unit buildings).
Forward outlook
- Local home prices are declining (-3.0%/yr); year-one equity from $1k of loan paydown is wiped out by about $5k of value loss. Plan a longer hold.
Negotiation context
- It's been on market 55 days — a 3% lower offer ($160k) is reasonable based on typical stale-listing flexibility.
Risks & watch-outs
- Watch-outs: built in 1947 — expect roof / HVAC / electrical / plumbing capex.
Questions for the listing agent
- It's been on market 55 days. Have you received any prior offers? Is the seller open to a 3% concession, seller financing, or rate buy-down credit?
- Have any recent inspections been done? Can we get a copy of the seller's disclosures and any deferred-maintenance estimates?
- Built in 1947 — when were the roof, HVAC, electrical panel, plumbing, and water heater last replaced?
- Is there a deadline driving the sale (1031 exchange, divorce, estate, relocation)? That informs how much negotiation room exists.
- Schools are D-rated, which usually means shorter tenancies and higher turnover. Who's the typical renter profile here, and what's been the actual vacancy rate?
- Crime grade is D in this area — have there been break-ins, vandalism, or insurance claims at this property in the last 3 years? What carrier currently insures it and at what premium?
- The area grade is low — what's the realistic commute time and amenity access for the typical tenant pool here? Any planned neighborhood developments (good or bad) we should know about?
- What's the average days-on-market for RENTAL listings here right now (not sales)? A rising rental-DOM trend means longer vacancies and softer asking-rent achievability than the comps imply.
- What's the recent tenant-quality profile in this submarket — average credit score on applications, eviction rate, late-payment / NSF rate, and stable-employment percentage? A property-management company in the area should have these aggregated.
- How much new for-sale + rental construction is in the pipeline within 1–3 miles? Heavy new supply typically softens prices + rents 12–24 months out; constrained supply supports both.
Investment metrics
- 1% rule
- 0.99% ✗
- Cap rate
- 7.34%
- Cash-on-cash
- 3.75%
- DSCR
- 1.17
- GRM
- 8.5
CMA / ARV
- ARV (median comp)
- $146,415
- List price
- $165,000
- Delta
- 12.69%
- Verdict
- OVERPRICED
- Comps
- 1 within 2.0 mi
Projected returns pro-forma
-3.0% appreciation · 3.0% rent growth · sell at horizon
- IRR
- -10.4%
- Equity multiple
- 0.62×
- Total profit
- $-17,514
- Equity at exit
- $24,602
- IRR
- -1.0%
- Equity multiple
- 0.93×
- Total profit
- $-3,307
- Equity at exit
- $14,266
Cash invested: $46,200 (down + closing). Projections, not guarantees.
Landlord ↔ Tenant lean methodology
- Overall (STATE)
- 46 Balanced
- State Minnesota
- 46 Balanced · D+2
- County
- — inherits STATE
- City
- — inherits STATE
ZIP-level market 56201
- Active inventory
- 159
- Price-to-rent
- 8.5×
Monthly cashflow live
- Estimated rent
- $1,626 medium interval (Pro) →
- Mortgage (P&I)
- −$865
- Tax est. 1.5%
- −$206 /mo · $2,475/yr
- Insurance
- −$69
- HOA
- −$0
- Vacancy / Maint / Mgmt
- −$342
- Net cashflow
- $144
Break-even live
Sensitivity live
| Price | -10% $258 | -5% $201 | +0% $144 | +5% $87 | +10% $30 |
|---|---|---|---|---|---|
| Rent | -10% $16 | -5% $80 | +0% $144 | +5% $209 | +10% $273 |
| Rate | -1.0pp $228 | -0.5pp $186 | base $144 | +0.5pp $102 | +1.0pp $58 |
UW: 25.0% down · 7.5% · 30yr · 1.5% tax · 5.0% vac · 8.0% maint · 8.0% mgmt
Financing live
Cash to close
- Down payment
- $41,250
- Closing costs
- $4,950
- Reserves months
- —
- Total cash needed
- —
Loan-product check · same deal, 3 products live
Conventional
25% down · 7.5% · 30yr
- Down + closing
- —
- Monthly P&I
- —
- Monthly cashflow
- —
- DSCR
- —
- Eligible?
- —
Personal DTI + credit; lowest rate.
DSCR
20% down · 8.5% · 30yr
- Down + closing
- —
- Monthly P&I
- —
- Monthly cashflow
- —
- DSCR
- —
- Eligible?
- —
No personal income docs; deal must DSCR.
Hard money
10% down · 12.0% · 12mo
- Down + closing
- —
- Monthly P&I
- —
- Monthly cashflow
- —
- DSCR
- —
- Eligible?
- —
Short-term bridge; refi at stabilization.
Listing history 19 events
-
2026-06-22days on market $165,000 Active 55 DOM
-
2026-06-21days on market $165,000 Active 54 DOM
-
2026-06-21days on market $165,000 Active 53 DOM
-
2026-06-18days on market $165,000 Active 51 DOM
-
2026-06-17days on market $165,000 Active 50 DOM
-
2026-06-16days on market $165,000 Active 49 DOM
-
2026-06-15days on market $165,000 Active 48 DOM
-
2026-06-13days on market $165,000 Active 46 DOM
-
2026-06-12pricedays on market $165,000 Active 45 DOM
-
2026-06-09days on market $175,000 Active 42 DOM
-
2026-06-08days on market $175,000 Active 41 DOM
-
2026-06-07days on market $175,000 Active 40 DOM
-
2026-06-07days on market $175,000 Active 39 DOM
-
2026-06-04days on market $175,000 Active 36 DOM
-
2026-06-02days on market $175,000 Active 35 DOM
-
2026-06-01days on market $175,000 Active 34 DOM
-
2026-05-31days on market $175,000 Active 33 DOM
-
2026-05-31days on market $175,000 Active 32 DOM
-
2026-04-28$185,000 Active 356-char remark
ⓘ Source: listings_history table (triggers on properties + properties_extension) + one-shot
backfill from property_details.listing_events for pre-trigger history.
Nearby sold comps map
Loading sold comps map…
Walkable amenities ~0.75 mi
Loading nearby amenities…
Taxation est. · year 1
- Rental income
- $19,514
- − Mortgage interest
- −$9,243
- − Property taxes
- −$2,475
- − Insurance
- −$825
- − Repairs & maintenance
- −$1,561
- − Management
- −$1,561
- − Depreciation
- −$4,800
- Taxable loss
- −$950
- Est. tax savings @ 24.0%
- +$228
- After-tax cash flow
- $1,961/yr
For passive investors: Depreciation is non-cash, so a rental often shows a tax loss while cash-flowing — sheltering income. Rental losses are passive: they offset passive income freely, and up to $25,000/yr can offset ordinary (W-2) income if you actively participate and your MAGI is under $100k (phasing out to $0 by $150k); unused losses carry forward. On sale, claimed depreciation is recaptured at up to 25%, and gains may owe capital-gains tax (a 1031 exchange can defer both). Figures are a year-1 estimate at your 24.0% rate — not tax advice; consult a CPA.
Condition & rehab AI · 13 photos
This home requires significant repairs and maintenance, including a new roof and exterior siding. A fresh paint job and repairs will improve its curb appeal and increase its value.
Repairs flagged
- Major roof — Significant wear and tear
- Major exterior siding — Peeling paint and siding
- Major interior walls — Chipped and uneven paint
Value-add opportunities
- Both paint job — Fresh paint can improve curb appeal and interior aesthetics
- Both roof replacement — A new roof will increase the home's value and reduce maintenance costs
- Both exterior siding repair — Repairing peeling siding will improve the home's appearance and increase its value
Renovation cost estimate screening
| Repair item | Severity | Est. cost |
|---|---|---|
| roof · Significant wear and tear | Major | $15,000–50,000 |
| exterior siding · Peeling paint and siding | Major | $15,000–50,000 |
| interior walls · Chipped and uneven paint | Major | $15,000–50,000 |
| Total estimated repair cost · 3 items | $45,000–150,000 |
Value-add ROI direction
- Both paint job — Fresh paint can improve curb appeal and interior aesthetics ↑
- Both roof replacement — A new roof will increase the home's value and reduce maintenance costs ↑
- Both exterior siding repair — Repairing peeling siding will improve the home's appearance and increase its value ↑
ⓘ Cost ranges are severity-bucket heuristics (US national rule-of-thumb). Get contractor quotes + a written scope before underwriting a rehab budget.
Schools (NCES district)
- District
- Willmar Public School District
- NCES district ID
- 2742720
- Math proficiency
- 34% ▼ -14.00%
- Reading proficiency
- 38% ▼ -8.00%
- Median HH income
- $46,727
- Composite
- 30.85/100
- National rank
- #6128
- State rank
- #246 of 301 in MN
Livability — Willmar
- Score
- 73/100
- State rank
- #233
- US rank
- #4984
Category grades
Schools grade is shown separately in the Schools card above.
Census & demographics
- Census place
- Willmar, MN
- City population
- 24,860
- Population (ZIP)
- 24,860
Population outlook (Kandiyohi County) Hauer SSP2
- Today (2025)
- 42,956 people
- By 2030
- 42,825 · -0.3%
- By 2040
- 42,343 · -1.4%
- By 2050
- 42,124 · -1.9%
- By 2075
- 43,726 · +1.8%
- By 2100
- 45,974 · +7.0%
Race, ethnicity, and origin ACS 2023
- Neighborhood character
- Majority White (64%)
- Race & ethnicity
- White 64% Hispanic / Latino 22% Black 10% Two or more races 6% Asian 2%
- Hispanic origin (detail)
- Mexican 15%
- Common ancestry
- Portuguese 15% Iranian 3% Scottish 2%
- Foreign-born
- 15% · Canada, Philippines
- Languages at home
- 78% English-only · Spanish 14% Other Asian/Pacific 2%
Political lean MEDSL · Kandiyohi
- 2024 margin
- Solid R (+31.0) · D 33.7% · R 64.7% · Other 1.7%
- 2008→2024 swing
- -25.6pp toward R · 2008: -5.5pp · 2024: -31.0pp
- All cycles
- 2024: R+31.0 2020: R+25.7 2016: R+25.5 2012: R+6.7 2008: R+5.5
Not yet ingested
- Civics
- —
Market trends
- HPI YoY
- ▼ -151.48%
- Current HPI
- 161.1663
- Rent YoY
- —
- Metro
- —
- State GDP YoY
- ▲ 2.41%
- F500 in state
- 34
Industry mix (Fortune 500 HQ in MN)
| Industry | F500 HQs | Revenue |
|---|---|---|
| Healthcare | 2 | $407B |
|
||
| Retail | 2 | $150B |
|
||
| Consumer Goods | 2 | $32B |
|
||
| Industrial Machinery | 2 | $6B |
|
||
| Agriculture | 1 | $40B |
|
||
| Healthcare / Medical Devices | 1 | $32B |
|
||
Price history
-10.8% since first listed4 events — show timeline
- 2026-06-11 Price Changed $165,000 NORTHSTARMLS as Distributed by MLS Grid
- 2026-05-26 Price Changed $175,000 NORTHSTARMLS as Distributed by MLS Grid
- 2026-05-23 Price Changed $180,000 NORTHSTARMLS as Distributed by MLS Grid
- 2026-04-28 Listed $185,000 NORTHSTARMLS as Distributed by MLS Grid
Cash-flow waterfall
monthlySold comps — $/sqft
last 12 mo · ≤1 miLoading sold comps…