 Duplex
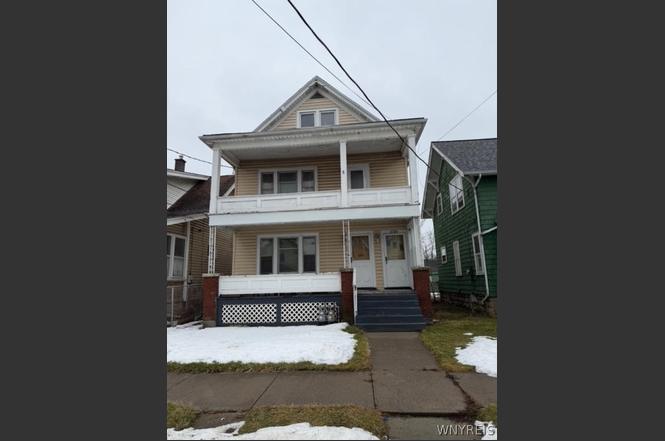
2725 Pierce Ave · Niagara Falls, NY
Flood risk 1/10 · Minimal
- FEMA flood zone
- X (unshaded)
- Chance of flooding over 30 yrs
- 0.0%
- Est. flood insurance / yr
- $473 – $860
Fire risk 1/10 · Minimal
- Est. fire insurance / yr
- $691 – $1,283
Heat risk 3/10 · Minor
- Hot days now (above 94°F)
- 7 days/yr
- Hot days in 30 yrs
- 15 days/yr
Wind risk 1/10 · Minimal
- Chance of severe wind over 30 yrs
- —
Air-quality risk 3/10 · Minor
- Unhealthy air days now
- 2 days/yr
- Unhealthy air days in 30 yrs
- 3 days/yr
Risk factors via First Street. Map © Google.
Why this score? — see what drove the B+ grade
The composite is a weighted blend of 9 inputs, each scored 0–100. Each bar is that input's sub-score; the figure is the points it added to the 100-point composite (weight × sub-score).
- Cash flow +30.0/30.0
- 1% rule +10.0/10.0
- DSCR +10.0/10.0
- Appreciation +10.0/10.0
- Rent growth +4.7/5.0
- ARV discount +3.2/15.0
- Livability +3.0/5.0
- Schools +2.5/10.0
- Condition / age +2.5/5.0
$119,900
🖨 Deal sheet 📄 Offer letter ✓ Due diligence
Multi-family units
County records classify this as Multi-Family (2-4 Unit). Listing-text estimate: 2 units. confirmed
Listing remarks MLS
Investors and home owners alike: Low maintenance, both units rented and ready for you to take ownership or live in one unit and let the other pay for your mortgage. Get this home before it to, is gone.
Key facts
- New furnace
- Off street parking
- Newer roof
Tags
Property features AI
Finance
- Financial info: Property contains 2 total units with separate gas and electric meters (2 each); Units are rented month-to-month; Current reported actual rent $700 for each unit; Owner pays water; tenants pay all utilities; Operating expenses include water
Exterior
- Parking: Attached garage with automatic garage door opener; 2 garage spaces
- Utilities: Electricity connected (circuit breakers); Public water connected; Sewer connected
- Home design: Two-story multifamily building; Residential resale property
- Construction: Vinyl siding exterior; Asphalt roof; Poured foundation; Existing (previously built) structure
- Exterior features: Fully fenced yard; Covered and open porch
Interior
- Kitchen: Each unit includes a dining area with kitchen and an eat-in kitchen
- Bedrooms: Two 2-bedroom units
- Flooring: Carpet; Laminate; Varies through the property
- Bathrooms: Unit breakdown: one unit with 1 full bathroom; one unit with 2 full bathrooms; total of 3 full bathrooms
- Heating & cooling: Gas heating; Central air conditioning
- Interior features: Full basement
- Laundry & utility: Gas water heater
Neighborhood map
What this means for you Summary
Snapshot
- This is a 2 × 2-bed/1.5-bath units multifamily listed at $120k.
Deal economics
- At list price, monthly cash flow is $935 ($11k/yr) — positive. Per door: $467/mo.
- The deal already cash-flows at list — no discount required.
- Meets the 1% rule at list price ($2k rent vs $120k).
- Recommended offer: $113k (6.0% below list) — sets the bar for market timing.
- Cap rate 15.7% vs local median 7.7% in Niagara Falls — top-decile yield for the area; either an underpriced asset or a hidden risk that comps aren't pricing in. Stress-test before assuming the spread holds.
Location & tenants
- Location reads 60/100 on livability (#956 in NY) — a middle-class / working-renter tenant base. Strengths: cost of living A+, housing A+; Watch: schools F, crime F, amenities F.
- Niagara Falls City School District (urban): math 26% / reading 34% proficiency, ranked #578 of 590 in NY (top 98%) — families likely to look elsewhere, expect single-tenant / working-renter base with shorter leases; 66% free/reduced lunch — lower-income household profile, screen leases tightly.
- Market conditions: Rents rising fast (+8.8%/yr); 164 active listings in the ZIP; 5 comparable units currently listed for rent nearby; rentals leasing fast (median 3d on market — plan ~1-2 weeks tenant-placement turnaround); lower-income renter base — watch delinquency; 167 units permitted in Niagara County in 2024 (0 in 5+ unit buildings).
- At $2,475/mo this rent would consume 86% of the median local household income ($35k/yr) (locally 954% of renters already pay >50% of income on rent) — very limited rent-growth headroom before tenants either downsize or default.
Forward outlook
- In year one you build about $13k of equity ($829 loan paydown + $12k appreciation (10.0% local appreciation)).
- Niagara County population projected at -19% by 2050 — secular population decline; favor cash flow + early exit over multi-decade hold.
- At projected returns (10.0% appreciation + 8.0% rent growth), your $34k cash investment doubles in ~2 years — after that, you're playing with house money.
- By year 3, paydown + projected appreciation supports a ~$32k cash-out refi (75% LTV) — recoverable capital for the next deal without selling this one.
Negotiation context
- It's been on market 66 days — a 6% lower offer ($113k) is reasonable based on typical stale-listing flexibility.
- 5 sale attempts since 13y ago; this cycle's ask has dropped $55k (31%) from the opening price — seller is motivated, your offer sets the floor, not the list.
- Current owner paid $42k; list at $120k implies a 185% gain — meaningful room to come down on a strong offer.
Risks & watch-outs
- Watch-outs: property tax is 3.4% of price; built in 1915 — expect roof / HVAC / electrical / plumbing capex.
Questions for the listing agent
- It's been on market 66 days. Have you received any prior offers? Is the seller open to a 6% concession, seller financing, or rate buy-down credit?
- Can we see the unit-by-unit rent roll, current vacancy, and any below-market leases? What's the average tenancy length?
- What capital expenditures (roof, boiler, parking lot, exteriors) have been made in the last 5 years, and what's planned in the next 2?
- Built in 1915 — when were the roof, HVAC, electrical panel, plumbing, and water heater last replaced?
- Property tax is high relative to price — has the assessment been appealed recently, and will the sale trigger a re-assessment?
- Why hasn't it sold? Are there any deal-killer items the seller is aware of (foundation, flood, title, zoning, code violations)?
- Is there a deadline driving the sale (1031 exchange, divorce, estate, relocation)? That informs how much negotiation room exists.
- Schools are F-rated, which usually means shorter tenancies and higher turnover. Who's the typical renter profile here, and what's been the actual vacancy rate?
- Crime grade is F in this area — have there been break-ins, vandalism, or insurance claims at this property in the last 3 years? What carrier currently insures it and at what premium?
- What's the average days-on-market for RENTAL listings here right now (not sales)? A rising rental-DOM trend means longer vacancies and softer asking-rent achievability than the comps imply.
- What's the recent tenant-quality profile in this submarket — average credit score on applications, eviction rate, late-payment / NSF rate, and stable-employment percentage? A property-management company in the area should have these aggregated.
- How much new apartment / multifamily construction is in the pipeline within 1–3 miles? Heavy new supply (>2% of stock underway) typically softens rents 12–24 months out; light construction supports rent growth.
Investment metrics
- 1% rule
- 2.06% ✓
- Cap rate
- 15.65%
- Cash-on-cash
- 33.42%
- DSCR
- 2.49
- GRM
- 4.0
CMA / ARV
- ARV (on-the-fly)
- $109,440
- Comps found
- 12
Show comp detail 12 sales within ~0.75 mi
| Address | Dist | Beds/Ba | Sqft | Sold | Price | $/sf | Match |
|---|---|---|---|---|---|---|---|
| 2459 La Salle Ave | 0.19mi | 4/2.0 | 1,920 (0%) | 2mo | $160,000 | $83 | 90 |
| 2463 South Ave | 0.33mi | 4/2.0 | 2,016 (+5%) | 3mo | $137,500 | $68 | 73 |
| 2449 Grand Ave | 0.42mi | 5/2.0 (+1) | 1,918 (-0%) | 4mo | $135,000 | $70 | 72 |
| 2443 Pierce Ave | 0.18mi | 4/2.0 | 2,112 (+10%) | 4mo | $120,000 | $57 | 71 |
| 2208 Weston Ave | 0.47mi | 4/2.0 | 2,016 (+5%) | 1mo | $55,000 | $27 | 69 |
| 2455 La Salle Ave | 0.20mi | 4/2.0 | 2,152 (+12%) | 3mo | $112,000 | $52 | 68 |
| 609 24th St | 0.58mi | 4/2.0 | 2,000 (+4%) | 4mo | $140,000 | $70 | 62 |
| 1867 Michigan Ave | 0.48mi | 4/2.0 | 2,100 (+9%) | 2mo | $87,000 | $41 | 60 |
| 1623 Linwood Ave | 0.69mi | 4/2.0 | 1,994 (+4%) | 3mo | $100,000 | $50 | 59 |
| 2615 Ferry Ave | 0.71mi | 4/2.0 | 1,848 (-4%) | 6mo | $115,000 | $62 | 56 |
| 1535 Pierce Ave | 0.73mi | 4/2.0 | 1,724 (-10%) | 2mo | $35,000 | $20 | 47 |
| 1635 South Ave | 0.72mi | 5/2.0 (+1) | 2,208 (+15%) | 2mo | $85,000 | $38 | 35 |
Match score weights: distance 35% · size 25% · config 20% · recency 20%. Top-matched comps best support the ARV.
Projected returns pro-forma
10.0% appreciation · 8.0% rent growth · sell at horizon
- IRR
- 53.5%
- Equity multiple
- 5.11×
- Total profit
- $138,083
- Equity at exit
- $108,015
- IRR
- 49.4%
- Equity multiple
- 12.69×
- Total profit
- $392,517
- Equity at exit
- $232,939
Cash invested: $33,572 (down + closing). Projections, not guarantees.
Landlord ↔ Tenant lean methodology
- Overall (STATE)
- 15 Strongly Tenant-Friendly
- State New York
- 15 Strongly Tenant-Friendly · D+10
- County
- — inherits STATE
- City
- — inherits STATE
ZIP-level market 14301
- Home prices YoY
- 6.2%
- Rents YoY
- 8.8%
- Active inventory
- 164
- Price-to-rent
- 8.1×
Monthly cashflow live
- Estimated rent
- $2,475 high interval (Pro) →
- Mortgage (P&I)
- −$629
- Tax from tax record
- −$342 /mo · $4,099/yr
- Insurance
- −$50
- HOA
- −$0
- Vacancy / Maint / Mgmt
- −$520
- Net cashflow
- $935
Break-even live
2-unit breakdown (identical units grouped — click to expand)
| Units | Beds | Baths | Est. rent |
|---|---|---|---|
| 2× units | 2 | 1.5 | $2,474 |
| #1 | 2 | 1.5 | $1,237 |
| #2 | 2 | 1.5 | $1,237 |
| Total (2 units) | $2,475 | ||
UW: 25.0% down · 7.5% · 30yr · 1.5% tax · 5.0% vac · 8.0% maint · 8.0% mgmt
Financing live
Cash to close
- Down payment
- $29,975
- Closing costs
- $3,597
- Reserves months
- —
- Total cash needed
- —
Loan-product check · same deal, 3 products live
Conventional
25% down · 7.5% · 30yr
- Down + closing
- —
- Monthly P&I
- —
- Monthly cashflow
- —
- DSCR
- —
- Eligible?
- —
Personal DTI + credit; lowest rate.
DSCR
20% down · 8.5% · 30yr
- Down + closing
- —
- Monthly P&I
- —
- Monthly cashflow
- —
- DSCR
- —
- Eligible?
- —
No personal income docs; deal must DSCR.
Hard money
10% down · 12.0% · 12mo
- Down + closing
- —
- Monthly P&I
- —
- Monthly cashflow
- —
- DSCR
- —
- Eligible?
- —
Short-term bridge; refi at stabilization.
Rent comps 5 comps
| Address | Beds | Baths | Sqft | Rent | $/sqft | DOM | Units | Dist |
|---|---|---|---|---|---|---|---|---|
| 2020 Forest Ave Niagara Falls, NY | 4.0 | 2.0 | 1600 | $1,500 | $0.94 | 16d | 1 | 0.49mi |
| 784 15th St Niagara Falls, NY | 3.0 | 1.5 | 1380 | $1,350 | $0.98 | 3d | 1 | 0.85mi |
| 3225 Belden Pl Niagara Falls, NY | 5.0 | 1.5 | 1344 | $1,750 | $1.30 | 1d | 1 | 0.89mi |
| 2420 Mackenna Ave Unit 1 Niagara Falls, NY | 4.0 | 1.0 | 1300 | $1,390 | $1.07 | 1d | 1 | 1.11mi |
| 642 Ashland Ave Niagara Falls, NY | 3.0 | 1.0 | 1238 | $1,100 | $0.89 | 3d | 1 | 1.47mi |
Listing history 22 events
-
2026-04-29status Pending
-
2026-04-13price $119,900
-
2026-04-11price $129,900
-
2026-04-06price $139,900
-
2026-04-03price $144,900
-
2026-03-24price $149,900
-
2026-03-19price $154,900
-
2026-03-13price $159,900
-
2026-03-09price $164,500
-
2026-03-03price $167,000
-
2026-02-22$174,900 Active
-
2020-11-02historical
-
2020-10-19price $106,900
-
2020-10-01$96,900 Active
-
2020-03-31soldstatus $42,000
-
2020-03-30soldstatus $42,000 Closed Sale or Rented 201-char remark
Show marketing remark (201 chars)
Investors and home owners alike: Low maintenance, both units rented and ready for you to take ownership or live in one unit and let the other pay for your mortgage. Get this home before it to, is gone.
-
2020-02-11status Pending Sale 201-char remark
Show marketing remark (201 chars)
Investors and home owners alike: Low maintenance, both units rented and ready for you to take ownership or live in one unit and let the other pay for your mortgage. Get this home before it to, is gone.
-
2019-12-27$62,900 Active 201-char remark
Show marketing remark (201 chars)
Investors and home owners alike: Low maintenance, both units rented and ready for you to take ownership or live in one unit and let the other pay for your mortgage. Get this home before it to, is gone.
-
2015-03-30soldstatus $40,000
-
2015-03-25soldstatus $40,000
-
2014-06-07$44,900
-
2013-07-05$54,900
ⓘ Source: listings_history table (triggers on properties + properties_extension) + one-shot
backfill from property_details.listing_events for pre-trigger history.
Tax reassessment forecast NY · Partial reset (capped growth)
- Current annual tax
- $4,099 · $342/mo
- Projected year-2 tax
- $4,099 · $342/mo
- Expected delta
- $0/yr ($0/mo · 0.0%)
ⓘ Screening estimate from a state-policy table — verify with the county assessor before closing.
Climate risk First Street
- Flood 1/10 Low FEMA zone X (unshaded) · 0% chance over 30 yrs
- Wildfire 1/10 Low
- Heat 3/10 Moderate 7 d/yr ≥94°F today · 15 d/yr by 30 yrs out
- Wind 1/10 Low
- Air quality 3/10 Moderate 2 unhealthy d/yr today · 3 by 30 yrs out
Nearby sold comps map
Loading sold comps map…
Walkable amenities ~0.75 mi
Loading nearby amenities…
Taxation est. · year 1
- Rental income
- $29,700
- − Mortgage interest
- −$6,716
- − Property taxes
- −$4,099
- − Insurance
- −$600
- − Repairs & maintenance
- −$2,376
- − Management
- −$2,376
- − Depreciation
- −$3,488
- Taxable income
- $10,045
- Est. tax owed @ 24.0%
- −$2,411
- After-tax cash flow
- $8,809/yr
For passive investors: Depreciation is non-cash, so a rental often shows a tax loss while cash-flowing — sheltering income. Rental losses are passive: they offset passive income freely, and up to $25,000/yr can offset ordinary (W-2) income if you actively participate and your MAGI is under $100k (phasing out to $0 by $150k); unused losses carry forward. On sale, claimed depreciation is recaptured at up to 25%, and gains may owe capital-gains tax (a 1031 exchange can defer both). Figures are a year-1 estimate at your 24.0% rate — not tax advice; consult a CPA.
Schools (NCES district)
- District
- Niagara Falls City School District
- NCES district ID
- 3620820
- Math proficiency
- 26% ▼ -10.00%
- Reading proficiency
- 34% ▲ 3.00%
- Median HH income
- $32,488
- Composite
- 24.5/100
- National rank
- #7655
- State rank
- #578 of 590 in NY
Livability — Niagara Falls
- Score
- 60/100
- State rank
- #956
- US rank
- #18749
Category grades
Schools grade is shown separately in the Schools card above.
Census & demographics
- Census place
- Niagara Falls, NY
- County
- Niagara County · 157,377 people
- City population
- 62,983
- Metro
- Buffalo-Cheektowaga, NY
- Population (ZIP)
- 10,923
- Household income
- $34,549
- Rent vs Own
- Severe rent burden
- 954.0
Population outlook (Niagara County) Hauer SSP2
- Today (2025)
- 204,149 people
- By 2030
- 197,900 · -3.1%
- By 2040
- 182,239 · -10.7%
- By 2050
- 165,198 · -19.1%
- By 2075
- 129,416 · -36.6%
- By 2100
- 96,222 · -52.9%
Race, ethnicity, and origin ACS 2023
- Neighborhood character
- Diverse neighborhood (Simpson 0.58)
- Race & ethnicity
- White 59% Black 25% Two or more races 8% Hispanic / Latino 8% Asian 2%
- Hispanic origin (detail)
- Puerto Rican 3% Cuban 2%
- Common ancestry
- Romanian 6% Slovak 2% Lithuanian 1%
- Foreign-born
- 5% · Canada, China, Dominican Republic
- Languages at home
- 90% English-only · Spanish 6% Other Indo-European 3% Chinese 1%
Political lean MEDSL · Niagara
- 2024 margin
- R (+14.9) · D 42.5% · R 57.5%
- 2008→2024 swing
- -15.9pp toward R · 2008: 1.0pp · 2024: -14.9pp
- All cycles
- 2024: R+14.9 2020: R+9.7 2016: R+19.0 2012: D+0.6 2008: D+1.0
Not yet ingested
- Civics
- —
Market trends
- HPI YoY
- ▲ 15.41%
- Current HPI
- 266.1457
- Rent YoY
- ▲ 8.79%
- Metro
- Buffalo-Cheektowaga, NY
- State GDP YoY
- ▲ 2.60%
- F500 in state
- 92
Industry mix (Fortune 500 HQ in NY)
| Industry | F500 HQs | Revenue |
|---|---|---|
| Financial Services | 10 | $950B |
|
||
| Consumer Goods | 9 | $162B |
|
||
| Insurance | 4 | $225B |
|
||
| Telecommunications | 2 | $144B |
|
||
| Pharmaceuticals | 2 | $112B |
|
||
| Media / Entertainment | 2 | $69B |
|
||
Price history
+118.4% since first listed22 events — show timeline
- 2026-04-29 Pending — WNYREIS
- 2026-04-13 Price Changed $119,900 WNYREIS
- 2026-04-11 Price Changed $129,900 WNYREIS
- 2026-04-06 Price Changed $139,900 WNYREIS
- 2026-04-03 Price Changed $144,900 WNYREIS
- 2026-03-24 Price Changed $149,900 WNYREIS
- 2026-03-19 Price Changed $154,900 WNYREIS
- 2026-03-13 Price Changed $159,900 WNYREIS
- 2026-03-09 Price Changed $164,500 WNYREIS
- 2026-03-03 Price Changed $167,000 WNYREIS
- 2026-02-22 Listed $174,900 WNYREIS
- 2020-11-02 Listing Removed — WNYREIS
- 2020-10-19 Price Changed $106,900 WNYREIS
- 2020-10-01 Listed $96,900 WNYREIS
- 2020-03-31 Sold (Public Records) $42,000 Public Records
- 2020-03-30 Sold (MLS) $42,000 WNYREIS
- 2020-02-11 Pending — WNYREIS
- 2019-12-27 Listed $62,900 WNYREIS
- 2015-03-30 Sold (MLS) $40,000 WNYREIS
- 2015-03-25 Sold (Public Records) $40,000 Public Records
- 2014-06-07 Listed $44,900 WNYREIS
- 2013-07-05 Listed $54,900 WNYREIS
Property tax history
+14.8%/yrLatest (2025): $4,099 · +19.3% YoY. Source: county tax records.
Cash-flow waterfall
monthlySold comps — $/sqft
last 12 mo · ≤1 miLoading sold comps…