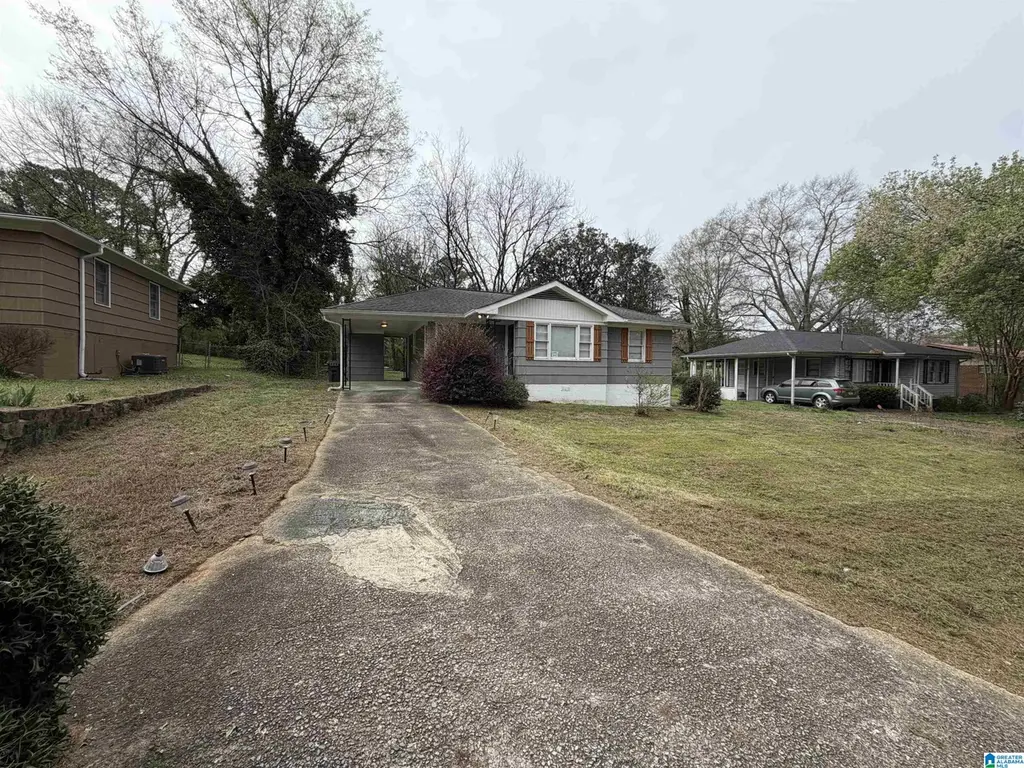
1013 Inzer Dr · Forestdale, AL
Flood risk 1/10 · Minimal
- FEMA flood zone
- X (unshaded)
- Chance of flooding over 30 yrs
- 0.0%
- Est. flood insurance / yr
- $507 – $1,088
Fire risk 4/10 · Minor
- Est. fire insurance / yr
- $916 – $1,700
Heat risk 5/10 · Moderate
- Hot days now (above 107°F)
- 7 days/yr
- Hot days in 30 yrs
- 18 days/yr
Wind risk 6/10 · Moderate
- Chance of severe wind over 30 yrs
- 27.0%
Air-quality risk 4/10 · Minor
- Unhealthy air days now
- 4 days/yr
- Unhealthy air days in 30 yrs
- 8 days/yr
Risk factors via First Street. Map © Google.
Why this score? — see what drove the C- grade
The composite is a weighted blend of 9 inputs, each scored 0–100. Each bar is that input's sub-score; the figure is the points it added to the 100-point composite (weight × sub-score).
- Cash flow +26.7/30.0
- DSCR +9.2/10.0
- 1% rule +6.0/10.0
- Livability +2.9/5.0
- Rent growth +2.7/5.0
- Condition / age +2.5/5.0
- Schools +1.8/10.0
- ARV discount +0.0/15.0
- Appreciation +0.0/10.0
$119,900
🖨 Deal sheet 📄 Offer letter ✓ Due diligence
Listing remarks MLS
Charming single-level home offering 3 bedrooms and 1 bath, set on a spacious lot with a welcoming front porch and a convenient carport. The interior features a bright kitchen with ample cabinet space and sleek countertops that flow through the main living areas, creating a clean and inviting atmosphere. Natural light fills the home, enhancing its comfortable layout and everyday functionality. Outside, the property includes a fenced yard with plenty of room for outdoor enjoyment, gardening, or pets. With its practical design and solid features, this home presents a great opportunity for buyers looking to personalize a space and make it their own while enjoying the benefits of an established neighborhood setting.
Key facts
- Bright kitchen
- Fenced yard
- Front porch
Tags
Neighborhood map
What this means for you Summary
Snapshot
- This is a 3-bed/1.0-bath single-family listed at $120k.
Deal economics
- At list price, monthly cash flow is $324 ($4k/yr) — positive.
- The deal already cash-flows at list — no discount required.
- Meets the 1% rule at list price ($1k rent vs $120k).
- Recommended offer: $113k (6.0% below list) — sets the bar for market timing.
- Cap rate 9.5% vs local median 6.5% in Forestdale — top-decile yield for the area; either an underpriced asset or a hidden risk that comps aren't pricing in. Stress-test before assuming the spread holds.
Location & tenants
- Location reads 58/100 on livability (#367 in AL) — a working-class tenant base; expect higher turnover. Strengths: cost of living A+, housing A+; Watch: employment D+, schools D-, amenities F.
- Jefferson County (suburban): math 9% / reading 32% proficiency, ranked #104 of 129 in AL (top 81%) — low school quality limits family demand, transient renter base, plan for 1-2y turnover.
- Market conditions: Rents flat; 116 active listings in the ZIP; 9 comparable units currently listed for rent nearby; rentals at typical pace (median 19d on market — plan ~3-4 weeks tenant-placement turnaround); 2,114 units permitted in Jefferson County in 2024 (556 in 5+ unit buildings).
Forward outlook
- Local home prices are declining (-3.0%/yr); year-one equity from $829 of loan paydown is wiped out by about $4k of value loss. Plan a longer hold.
- Jefferson County population projected to shrink 4% by 2050 — rents likely to lag national; underwrite the cash flow, not the appreciation.
Negotiation context
- It's been on market 78 days — a 6% lower offer ($113k) is reasonable based on typical stale-listing flexibility.
- 3 sale attempts since 5y ago; this cycle's ask has dropped $10k (8%) from the opening price — seller is motivated, your offer sets the floor, not the list.
Risks & watch-outs
- Watch-outs: built in 1958 — expect roof / HVAC / electrical / plumbing capex.
- Climate carrying-cost: major wind risk, 27% chance of damaging wind over 30y; extreme-heat days projected 7→18/yr by 2055 (HVAC capex compounding) — expect insurance premiums to compound above CPI over the hold.
Questions for the listing agent
- It's been on market 78 days. Have you received any prior offers? Is the seller open to a 6% concession, seller financing, or rate buy-down credit?
- Built in 1958 — when were the roof, HVAC, electrical panel, plumbing, and water heater last replaced?
- Why hasn't it sold? Are there any deal-killer items the seller is aware of (foundation, flood, title, zoning, code violations)?
- Is there a deadline driving the sale (1031 exchange, divorce, estate, relocation)? That informs how much negotiation room exists.
- Schools are D-rated, which usually means shorter tenancies and higher turnover. Who's the typical renter profile here, and what's been the actual vacancy rate?
- What's the average days-on-market for RENTAL listings here right now (not sales)? A rising rental-DOM trend means longer vacancies and softer asking-rent achievability than the comps imply.
- What's the recent tenant-quality profile in this submarket — average credit score on applications, eviction rate, late-payment / NSF rate, and stable-employment percentage? A property-management company in the area should have these aggregated.
- How much new for-sale + rental construction is in the pipeline within 1–3 miles? Heavy new supply typically softens prices + rents 12–24 months out; constrained supply supports both.
Investment metrics
- 1% rule
- 1.10% ✓
- Cap rate
- 9.53%
- Cash-on-cash
- 11.58%
- DSCR
- 1.52
- GRM
- 7.6
CMA / ARV
- ARV (median comp)
- $94,246
- List price
- $119,900
- Delta
- 27.22%
- Verdict
- OVERPRICED
- Comps
- 20 within 1.0 mi
Show comp detail 8 sales within ~0.75 mi
| Address | Dist | Beds/Ba | Sqft | Sold | Price | $/sf | Match |
|---|---|---|---|---|---|---|---|
| 1117 Graham Dr | 0.25mi | 3/1.0 | 1,102 (+1%) | 15mo | $82,000 | $74 | 75 |
| 929 Heflin Ave E | 0.24mi | 3/1.0 | 1,080 (-1%) | 20mo | $60,000 | $56 | 70 |
| 779 Heflin Ave E | 0.50mi | 3/1.0 | 1,052 (-4%) | 1mo | $114,429 | $109 | 69 |
| 1500 Cherry Ave | 0.47mi | 3/1.0 | 1,144 (+5%) | 4mo | $81,750 | $71 | 67 |
| 759 Hopkins Dr | 0.50mi | 3/2.0 | 1,024 (-6%) | 13mo | $105,000 | $103 | 52 |
| 750 Circlewood Ln | 0.61mi | 3/2.0 | 1,050 (-4%) | 14mo | $129,000 | $123 | 49 |
| 1724 Horn Dr | 0.58mi | 3/1.0 | 1,208 (+10%) | 17mo | $65,000 | $54 | 41 |
| 1706 Huitt St | 0.65mi | 3/1.0 | 1,216 (+11%) | 21mo | $77,500 | $64 | 33 |
Match score weights: distance 35% · size 25% · config 20% · recency 20%. Top-matched comps best support the ARV.
Projected returns pro-forma
-3.0% appreciation · 0.74% rent growth · sell at horizon
- IRR
- -1.4%
- Equity multiple
- 0.95×
- Total profit
- $-1,777
- Equity at exit
- $17,877
- IRR
- 5.9%
- Equity multiple
- 1.40×
- Total profit
- $13,334
- Equity at exit
- $10,367
Cash invested: $33,572 (down + closing). Projections, not guarantees.
Landlord ↔ Tenant lean methodology
- Overall (STATE)
- 90 Strongly Landlord-Friendly
- State Alabama
- 90 Strongly Landlord-Friendly · R+15
- County
- — inherits STATE
- City
- — inherits STATE
ZIP-level market 35214
- Home prices YoY
- -20.0%
- Rents YoY
- 0.7%
- Active inventory
- 116
- Price-to-rent
- 7.6×
Monthly cashflow live
- Estimated rent
- $1,317 high interval (Pro) →
- Mortgage (P&I)
- −$629
- Tax from tax record
- −$38 /mo · $450/yr
- Insurance
- −$50
- HOA
- −$0
- Vacancy / Maint / Mgmt
- −$276
- Net cashflow
- $324
Break-even live
UW: 25.0% down · 7.5% · 30yr · 1.5% tax · 5.0% vac · 8.0% maint · 8.0% mgmt
Financing live
Cash to close
- Down payment
- $29,975
- Closing costs
- $3,597
- Reserves months
- —
- Total cash needed
- —
Loan-product check · same deal, 3 products live
Conventional
25% down · 7.5% · 30yr
- Down + closing
- —
- Monthly P&I
- —
- Monthly cashflow
- —
- DSCR
- —
- Eligible?
- —
Personal DTI + credit; lowest rate.
DSCR
20% down · 8.5% · 30yr
- Down + closing
- —
- Monthly P&I
- —
- Monthly cashflow
- —
- DSCR
- —
- Eligible?
- —
No personal income docs; deal must DSCR.
Hard money
10% down · 12.0% · 12mo
- Down + closing
- —
- Monthly P&I
- —
- Monthly cashflow
- —
- DSCR
- —
- Eligible?
- —
Short-term bridge; refi at stabilization.
Rent comps 9 comps
| Address | Beds | Baths | Sqft | Rent | $/sqft | DOM | Units | Dist |
|---|---|---|---|---|---|---|---|---|
| 1647 Cherry Ave Birmingham, AL | 3.0 | 2.0 | 1079 | $1,150 | $1.07 | 11d | 1 | 0.10mi |
| 944 Cagle Rd Birmingham, AL | 3.0 | 2.0 | 1174 | $1,425 | $1.21 | 23d | 1 | 0.32mi |
| 1512 Cherry Ave Birmingham, AL | 4.0 | 1.0 | 1146 | $1,200 | $1.05 | 44d | 1 | 0.43mi |
| 1500 Cherry Ave Birmingham, AL | 3.0 | 1.0 | 1144 | $1,225 | $1.07 | 3d | 1 | 0.49mi |
| 779 Heflin Ave E Birmingham, AL | 3.0 | 1.5 | 1052 | $1,100 | $1.05 | 19d | 1 | 0.50mi |
| 1533 Choctaw Dr Birmingham, AL | 3.0 | 1.0 | 1241 | $1,175 | $0.95 | 44d | 1 | 1.17mi |
| 1712 Riderwood Trl Birmingham, AL | 3.0 | 1.0 | 1456 | $1,150 | $0.79 | 16d | 1 | 1.29mi |
| 115 Crabapple Ln Birmingham, AL | 1.0–3.0 | 1.0–2.0 | 906 | $1,027 | $1.13 | 11d | 19 | 1.44mi |
| 161 Cindy Ln Birmingham, AL | 3.0 | 2.0 | 1388 | $1,425 | $1.03 | 23d | 1 | 1.47mi |
Listing history 23 events
-
2026-06-18days on market $119,900 Active 78 DOM
-
2026-06-17days on market $119,900 Active 77 DOM
-
2026-06-16days on market $119,900 Active 76 DOM
-
2026-06-15days on market $119,900 Active 75 DOM
-
2026-06-13days on market $119,900 Active 73 DOM
-
2026-06-10days on market $119,900 Active 70 DOM
-
2026-06-09days on market $119,900 Active 69 DOM
-
2026-06-08days on market $119,900 Active 68 DOM
-
2026-06-07pricedays on market $119,900 Active 67 DOM
-
2026-06-03days on market $124,900 Active 63 DOM
-
2026-06-02days on market $124,900 Active 62 DOM
-
2026-06-01days on market $124,900 Active 61 DOM
-
2026-05-31days on market $124,900 Active 60 DOM
-
2026-05-05price $124,900 720-char remark
Show marketing remark (720 chars)
Charming single-level home offering 3 bedrooms and 1 bath, set on a spacious lot with a welcoming front porch and a convenient carport. The interior features a bright kitchen with ample cabinet space and sleek countertops that flow through the main living areas, creating a clean and inviting atmosphere. Natural light fills the home, enhancing its comfortable layout and everyday functionality. Outside, the property includes a fenced yard with plenty of room for outdoor enjoyment, gardening, or pets. With its practical design and solid features, this home presents a great opportunity for buyers looking to personalize a space and make it their own while enjoying the benefits of an established neighborhood setting.
-
2026-03-30$129,900 Active 720-char remark
Show marketing remark (720 chars)
Charming single-level home offering 3 bedrooms and 1 bath, set on a spacious lot with a welcoming front porch and a convenient carport. The interior features a bright kitchen with ample cabinet space and sleek countertops that flow through the main living areas, creating a clean and inviting atmosphere. Natural light fills the home, enhancing its comfortable layout and everyday functionality. Outside, the property includes a fenced yard with plenty of room for outdoor enjoyment, gardening, or pets. With its practical design and solid features, this home presents a great opportunity for buyers looking to personalize a space and make it their own while enjoying the benefits of an established neighborhood setting.
-
2022-02-01soldstatus $150,000
-
2022-01-30soldstatus $150,000 Sold 197-char remark
Show marketing remark (197 chars)
Charming 3 bedroom, 1 bath home with hardwood floors, updated kitchen with stainless appliances and granite countertops, attached carport, and a large, fenced backyard. Renovated and move in ready!
-
2021-12-03historical Contingent 197-char remark
Show marketing remark (197 chars)
Charming 3 bedroom, 1 bath home with hardwood floors, updated kitchen with stainless appliances and granite countertops, attached carport, and a large, fenced backyard. Renovated and move in ready!
-
2021-11-29$145,000 Active 197-char remark
Show marketing remark (197 chars)
Charming 3 bedroom, 1 bath home with hardwood floors, updated kitchen with stainless appliances and granite countertops, attached carport, and a large, fenced backyard. Renovated and move in ready!
-
2021-08-15soldstatus $70,000 Sold
-
2021-08-06soldstatus $70,000
-
2021-07-25historical
-
2021-07-13$69,900 Active
ⓘ Source: listings_history table (triggers on properties + properties_extension) + one-shot
backfill from property_details.listing_events for pre-trigger history.
Tax reassessment forecast AL · Resets to sale price
- Current annual tax
- $450 · $38/mo
- Projected year-2 tax
- $492 · $41/mo
- Expected delta
- +$42/yr (+$3/mo · 9.2%)
ⓘ Screening estimate from a state-policy table — verify with the county assessor before closing.
Climate risk First Street
- Flood 1/10 Low FEMA zone X (unshaded) · 0% chance over 30 yrs
- Wildfire 4/10 Moderate
- Heat 5/10 Major 7 d/yr ≥107°F today · 18 d/yr by 30 yrs out
- Wind 6/10 Major 27% chance of damaging wind over 30 yrs
- Air quality 4/10 Moderate 4 unhealthy d/yr today · 8 by 30 yrs out
Nearby sold comps map
Loading sold comps map…
Walkable amenities ~0.75 mi
Loading nearby amenities…
Taxation est. · year 1
- Rental income
- $15,799
- − Mortgage interest
- −$6,716
- − Property taxes
- −$450
- − Insurance
- −$600
- − Repairs & maintenance
- −$1,264
- − Management
- −$1,264
- − Depreciation
- −$3,488
- Taxable income
- $2,018
- Est. tax owed @ 24.0%
- −$484
- After-tax cash flow
- $3,402/yr
For passive investors: Depreciation is non-cash, so a rental often shows a tax loss while cash-flowing — sheltering income. Rental losses are passive: they offset passive income freely, and up to $25,000/yr can offset ordinary (W-2) income if you actively participate and your MAGI is under $100k (phasing out to $0 by $150k); unused losses carry forward. On sale, claimed depreciation is recaptured at up to 25%, and gains may owe capital-gains tax (a 1031 exchange can defer both). Figures are a year-1 estimate at your 24.0% rate — not tax advice; consult a CPA.
Schools (NCES district)
- District
- Jefferson County
- NCES district ID
- 0101920
- Math proficiency
- 9% ▼ -24.00%
- Reading proficiency
- 32% ▼ -5.00%
- Median HH income
- $51,712
- Composite
- 18.4/100
- National rank
- #8937
- State rank
- #104 of 129 in AL
Livability — Forestdale
- Score
- 58/100
- State rank
- #367
- US rank
- #21236
Category grades
Schools grade is shown separately in the Schools card above.
Census & demographics
- Census place
- Forestdale, AL
- County
- Jefferson County · 527,445 people
- City population
- 17,027
- Metro
- Birmingham-Hoover, AL
- Population (ZIP)
- 17,027
- Household income
- $56,383
- Rent vs Own
- Severe rent burden
- 578.0
Population outlook (Jefferson County) Hauer SSP2
- Today (2025)
- 669,185 people
- By 2030
- 669,694 · +0.1%
- By 2040
- 661,388 · -1.2%
- By 2050
- 643,086 · -3.9%
- By 2075
- 577,267 · -13.7%
- By 2100
- 474,758 · -29.1%
Race, ethnicity, and origin ACS 2023
- Neighborhood character
- Predominantly Black (77%)
- Race & ethnicity
- Black 77% White 18% Two or more races 2%
- Foreign-born
- 1% · Canada
- Languages at home
- 98% English-only · Spanish 2%
Political lean MEDSL · Jefferson
- 2024 margin
- D (+10.4) · D 54.6% · R 44.2% · Other 1.2%
- 2008→2024 swing
- +5.4pp toward D · 2008: 5.1pp · 2024: 10.4pp
- All cycles
- 2024: D+10.4 2020: D+13.2 2016: D+7.2 2012: D+6.0 2008: D+5.1
Not yet ingested
- Civics
- —
Market trends
- HPI YoY
- ▼ -54.48%
- Current HPI
- 218.5233
- Rent YoY
- ▲ 0.74%
- Metro
- Birmingham-Hoover, AL
- State GDP YoY
- ▲ 2.94%
- F500 in state
- 4
Industry mix (Fortune 500 HQ in AL)
| Industry | F500 HQs | Revenue |
|---|---|---|
| Financial Services | 1 | $8B |
|
||
| Healthcare | 1 | $5B |
|
||
Price history
+78.7% since first listed10 events — show timeline
- 2026-05-05 Price Changed $124,900 Greater Alabama MLS
- 2026-03-30 Listed $129,900 Greater Alabama MLS
- 2022-02-01 Sold (Public Records) $150,000 Public Records
- 2022-01-30 Sold (MLS) $150,000 Greater Alabama MLS
- 2021-12-03 Contingent — Greater Alabama MLS
- 2021-11-29 Listed $145,000 Greater Alabama MLS
- 2021-08-15 Sold (MLS) $70,000 Greater Alabama MLS
- 2021-08-06 Sold (Public Records) $70,000 Public Records
- 2021-07-25 Delisted — Greater Alabama MLS
- 2021-07-13 Listed $69,900 Greater Alabama MLS
Property tax history
+3.9%/yrLatest (2025): $450 · +0.0% YoY. Source: county tax records.
Cash-flow waterfall
monthlySold comps — $/sqft
last 12 mo · ≤1 miLoading sold comps…