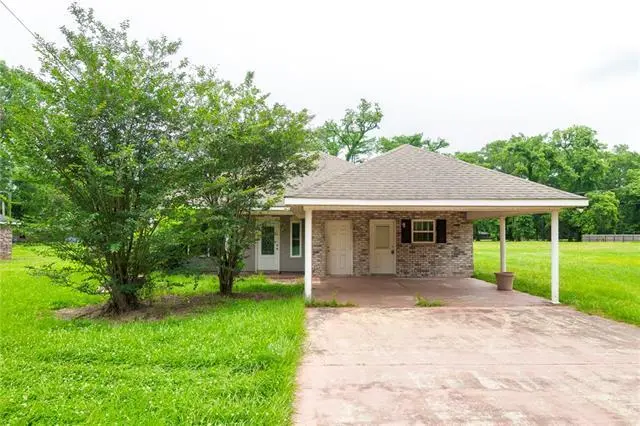
544 Hudson Blvd · Alexandria, LA
Flood risk 1/10 · Minimal
- FEMA flood zone
- X (shaded)
- Chance of flooding over 30 yrs
- 0.0%
- Est. flood insurance / yr
- $507 – $1,088
Fire risk 3/10 · Minor
- Est. fire insurance / yr
- $1,269 – $2,357
Heat risk 8/10 · Major
- Hot days now (above 111°F)
- 7 days/yr
- Hot days in 30 yrs
- 19 days/yr
Wind risk 8/10 · Major
- Chance of severe wind over 30 yrs
- 99.0%
Air-quality risk 1/10 · Minimal
- Unhealthy air days now
- 0 days/yr
- Unhealthy air days in 30 yrs
- 0 days/yr
Risk factors via First Street. Map © Google.
Why this score? — see what drove the D grade
The composite is a weighted blend of 9 inputs, each scored 0–100. Each bar is that input's sub-score; the figure is the points it added to the 100-point composite (weight × sub-score).
- Cash flow +18.7/30.0
- DSCR +5.9/10.0
- 1% rule +4.4/10.0
- Livability +3.2/5.0
- Schools +3.1/10.0
- Rent growth +2.5/5.0
- Condition / age +2.5/5.0
- ARV discount +0.1/15.0
- Appreciation +0.0/10.0
$175,000
🖨 Deal sheet 📄 Offer letter ✓ Due diligence
Listing remarks
This move in ready 3 bedroom, 2 bathroom brick home combines a highly functional layout with modern charm, making it a standout option for buyers seeking value and style. Built in 2018, the property features a spacious 2 car carport and an open concept interior designed for effortless living and entertaining. The heart of the home is a bright, expansive living area that flows seamlessly into the kitchen, which boasts a convenient breakfast bar and easy access to a dedicated laundry room. Designed with a desirable split floorplan, the home offers maximum privacy for the primary suite. This primary retreat features an elegant trey ceiling and a full ensuite bathroom complete with a double van
Key facts
- Split floorplan
- Brick home
- Spacious carport
Tags
Property features AI
Exterior
- Parking: Carport
- Home design: Single-family residence
- Exterior features: Covered porch/patio; Wood fencing; Composition roof
Interior
- Bedrooms: Two bedrooms (Bedroom 1, Bedroom 2)
- Bathrooms: 2 full bathrooms
- Heating & cooling: Central heating; Central air conditioning
- Interior features: Living Room; Dining Room; Bedroom 1; Bedroom 2
Neighborhood map
What this means for you Summary
Snapshot
- This is a 3-bed/2.0-bath single-family listed at $175k.
Deal economics
- At list price, monthly cash flow is $174 ($2k/yr) — positive.
- The deal already cash-flows at list — no discount required.
- To meet the 1% rule (rent ≥ 1% of price), the offer needs to be $164k (6.1% below list).
- Recommended offer: $164k (6.1% below list) — sets the bar for 1% rule.
- Cap rate 7.5% vs local median 4.9% in Alexandria — top-decile yield for the area; either an underpriced asset or a hidden risk that comps aren't pricing in. Stress-test before assuming the spread holds.
Location & tenants
- Location reads 64/100 on livability (#160 in LA) — a middle-class / working-renter tenant base. Strengths: cost of living A+, housing A+, health & safety A+; Watch: crime F, amenities F, commute F.
- Rapides Parish (urban): math 29% / reading 44% proficiency, ranked #31 of 98 in LA (top 32%) — families likely to look elsewhere, expect single-tenant / working-renter base with shorter leases; 64% free/reduced lunch — lower-income household profile, screen leases tightly.
- Market conditions: 51 active listings in the ZIP; 239 units permitted in Rapides Parish in 2024 (0 in 5+ unit buildings).
Forward outlook
- Local home prices are declining (-3.0%/yr); year-one equity from $1k of loan paydown is wiped out by about $5k of value loss. Plan a longer hold.
- Rapides County population projected to shrink 6% by 2050 — rents likely to lag national; underwrite the cash flow, not the appreciation.
Negotiation context
- It's been on market 17 days — a 2% lower offer ($172k) is reasonable based on typical stale-listing flexibility.
- 2 sale attempts since 8y ago with the ask held roughly flat each time — persistent listings suggest the price (not the market) is what's stuck; bring a comps-based counter.
- Current owner paid $15k; list at $175k implies a 1067% gain — meaningful room to come down on a strong offer.
Risks & watch-outs
- Climate carrying-cost: severe wind risk, 99% chance of damaging wind over 30y; extreme-heat days projected 7→19/yr by 2055 (HVAC capex compounding) — expect insurance premiums to compound above CPI over the hold.
Questions for the listing agent
- Is there a deadline driving the sale (1031 exchange, divorce, estate, relocation)? That informs how much negotiation room exists.
- Crime grade is F in this area — have there been break-ins, vandalism, or insurance claims at this property in the last 3 years? What carrier currently insures it and at what premium?
- The area grade is low — what's the realistic commute time and amenity access for the typical tenant pool here? Any planned neighborhood developments (good or bad) we should know about?
- What's the average days-on-market for RENTAL listings here right now (not sales)? A rising rental-DOM trend means longer vacancies and softer asking-rent achievability than the comps imply.
- What's the recent tenant-quality profile in this submarket — average credit score on applications, eviction rate, late-payment / NSF rate, and stable-employment percentage? A property-management company in the area should have these aggregated.
- How much new for-sale + rental construction is in the pipeline within 1–3 miles? Heavy new supply typically softens prices + rents 12–24 months out; constrained supply supports both.
Investment metrics
- 1% rule
- 0.94% ✗
- Cap rate
- 7.48%
- Cash-on-cash
- 4.25%
- DSCR
- 1.19
- GRM
- 8.9
CMA / ARV
- ARV (on-the-fly)
- $150,183
- Comps found
- 6
Show comp detail 6 sales within ~0.75 mi
| Address | Dist | Beds/Ba | Sqft | Sold | Price | $/sf | Match |
|---|---|---|---|---|---|---|---|
| 520 Hudson | 0.08mi | 3/2.0 | 1,525 (+0%) | 11mo | $145,000 | $95 | 87 |
| 817 Lafitte Dr | 0.22mi | 3/1.5 | 1,437 (-5%) | 3mo | $135,000 | $94 | 76 |
| 624 Rene Dr | 0.20mi | 3/2.0 | 1,300 (-14%) | 1mo | $128,500 | $99 | 66 |
| 805 Rampart St | 0.14mi | 4/2.0 (+1) | 1,324 (-13%) | 4mo | $145,000 | $110 | 64 |
| 624 Avoyelles Dr | 0.15mi | 4/1.5 (+1) | 1,293 (-15%) | 1mo | $129,999 | $101 | 60 |
| 4411 3rd St | 0.66mi | 3/2.0 | 1,697 (+12%) | 3mo | $68,000 | $40 | 47 |
Match score weights: distance 35% · size 25% · config 20% · recency 20%. Top-matched comps best support the ARV.
Projected returns pro-forma
-3.0% appreciation · 3.0% rent growth · sell at horizon
- IRR
- -9.7%
- Equity multiple
- 0.65×
- Total profit
- $-17,322
- Equity at exit
- $26,093
- IRR
- -0.3%
- Equity multiple
- 0.98×
- Total profit
- $-950
- Equity at exit
- $15,131
Cash invested: $49,000 (down + closing). Projections, not guarantees.
Landlord ↔ Tenant lean methodology
- Overall (STATE)
- 90 Strongly Landlord-Friendly
- State Louisiana
- 90 Strongly Landlord-Friendly · R+12
- County
- — inherits STATE
- City
- — inherits STATE
ZIP-level market 71302
- Home prices YoY
- -12.7%
- Active inventory
- 51
- Price-to-rent
- 8.9×
Monthly cashflow live
- Estimated rent
- $1,644 medium interval (Pro) →
- Mortgage (P&I)
- −$918
- Tax from tax record
- −$134 /mo · $1,611/yr
- Insurance
- −$73
- HOA
- −$0
- Vacancy / Maint / Mgmt
- −$345
- Net cashflow
- $174
Break-even live
UW: 25.0% down · 7.5% · 30yr · 1.5% tax · 5.0% vac · 8.0% maint · 8.0% mgmt
Financing live
Cash to close
- Down payment
- $43,750
- Closing costs
- $5,250
- Reserves months
- —
- Total cash needed
- —
Loan-product check · same deal, 3 products live
Conventional
25% down · 7.5% · 30yr
- Down + closing
- —
- Monthly P&I
- —
- Monthly cashflow
- —
- DSCR
- —
- Eligible?
- —
Personal DTI + credit; lowest rate.
DSCR
20% down · 8.5% · 30yr
- Down + closing
- —
- Monthly P&I
- —
- Monthly cashflow
- —
- DSCR
- —
- Eligible?
- —
No personal income docs; deal must DSCR.
Hard money
10% down · 12.0% · 12mo
- Down + closing
- —
- Monthly P&I
- —
- Monthly cashflow
- —
- DSCR
- —
- Eligible?
- —
Short-term bridge; refi at stabilization.
Listing history 9 events
-
2026-06-07statusdays on market $175,000 Pending 17 DOM
-
2026-06-03days on market $175,000 Active 16 DOM
-
2026-06-02days on market $175,000 Active 15 DOM
-
2026-06-01days on market $175,000 Active 14 DOM
-
2026-05-31days on market $175,000 Active 13 DOM
-
2026-05-30days on market $175,000 Active 12 DOM
-
2026-05-18$175,000 Active
-
2018-01-18$130,000
-
2017-10-13soldstatus $15,000
ⓘ Source: listings_history table (triggers on properties + properties_extension) + one-shot
backfill from property_details.listing_events for pre-trigger history.
Tax reassessment forecast LA · Resets to sale price
- Current annual tax
- $1,611 · $134/mo
- Projected year-2 tax
- $1,611 · $134/mo
- Expected delta
- $0/yr ($0/mo · 0.0%)
ⓘ Screening estimate from a state-policy table — verify with the county assessor before closing.
Climate risk First Street
- Flood 1/10 Low FEMA zone X (shaded) · 0% chance over 30 yrs
- Wildfire 3/10 Moderate
- Heat 8/10 Severe 7 d/yr ≥111°F today · 19 d/yr by 30 yrs out
- Wind 8/10 Severe 99% chance of damaging wind over 30 yrs
- Air quality 1/10 Low 0 unhealthy d/yr today · 0 by 30 yrs out
Nearby sold comps map
Loading sold comps map…
Walkable amenities ~0.75 mi
Loading nearby amenities…
Taxation est. · year 1
- Rental income
- $19,725
- − Mortgage interest
- −$9,803
- − Property taxes
- −$1,611
- − Insurance
- −$875
- − Repairs & maintenance
- −$1,578
- − Management
- −$1,578
- − Depreciation
- −$5,091
- Taxable loss
- −$810
- Est. tax savings @ 24.0%
- +$195
- After-tax cash flow
- $2,279/yr
For passive investors: Depreciation is non-cash, so a rental often shows a tax loss while cash-flowing — sheltering income. Rental losses are passive: they offset passive income freely, and up to $25,000/yr can offset ordinary (W-2) income if you actively participate and your MAGI is under $100k (phasing out to $0 by $150k); unused losses carry forward. On sale, claimed depreciation is recaptured at up to 25%, and gains may owe capital-gains tax (a 1031 exchange can defer both). Figures are a year-1 estimate at your 24.0% rate — not tax advice; consult a CPA.
Schools (NCES district)
- District
- Rapides Parish
- NCES district ID
- 2201290
- Math proficiency
- 29% ▼ -34.00%
- Reading proficiency
- 44% ▼ -29.00%
- Median HH income
- $41,057
- Composite
- 30.68/100
- National rank
- #6179
- State rank
- #31 of 98 in LA
Livability — Alexandria
- Score
- 64/100
- State rank
- #160
- US rank
- #13698
Category grades
Schools grade is shown separately in the Schools card above.
Census & demographics
- Census place
- Alexandria, LA
- City population
- 25,138
- Population (ZIP)
- 14,128
Population outlook (Rapides County) Hauer SSP2
- Today (2025)
- 133,047 people
- By 2030
- 132,333 · -0.5%
- By 2040
- 129,355 · -2.8%
- By 2050
- 124,535 · -6.4%
- By 2075
- 110,338 · -17.1%
- By 2100
- 88,641 · -33.4%
Race, ethnicity, and origin ACS 2023
- Neighborhood character
- Predominantly Black (83%)
- Race & ethnicity
- Black 83% White 14% Two or more races 3% Hispanic / Latino 1%
- Common ancestry
- Lithuanian 2%
- Foreign-born
- 1% · Canada
- Languages at home
- 98% English-only · Spanish 1%
Political lean MEDSL · Rapides
- 2024 margin
- Solid R (+36.8) · D 31.0% · R 67.7% · Other 1.3%
- 2008→2024 swing
- -8.1pp toward R · 2008: -28.7pp · 2024: -36.8pp
- All cycles
- 2024: R+36.8 2020: R+32.1 2016: R+32.5 2012: R+29.6 2008: R+28.7
Not yet ingested
- Civics
- —
Market trends
- HPI YoY
- ▼ -28.36%
- Current HPI
- 195.3699
- Rent YoY
- —
- Metro
- —
- State GDP YoY
- ▲ 3.29%
- F500 in state
- 10
Industry mix (Fortune 500 HQ in LA)
| Industry | F500 HQs | Revenue |
|---|---|---|
| Telecommunications | 2 | $23B |
|
||
| Utilities | 1 | $12B |
|
||
| Wholesale / Distribution | 1 | $5B |
|
||
| Advertising | 1 | $2B |
|
||
Price history
+1066.7% since first listed3 events — show timeline
- 2026-05-18 Listed $175,000 AcadianaMLS
- 2018-01-18 Listed $130,000 AcadianaMLS
- 2017-10-13 Sold (Public Records) $15,000 Public Records
Property tax history
+36.0%/yrLatest (2025): $1,611 · -1.0% YoY. Source: county tax records.
Cash-flow waterfall
monthlySold comps — $/sqft
last 12 mo · ≤1 miLoading sold comps…