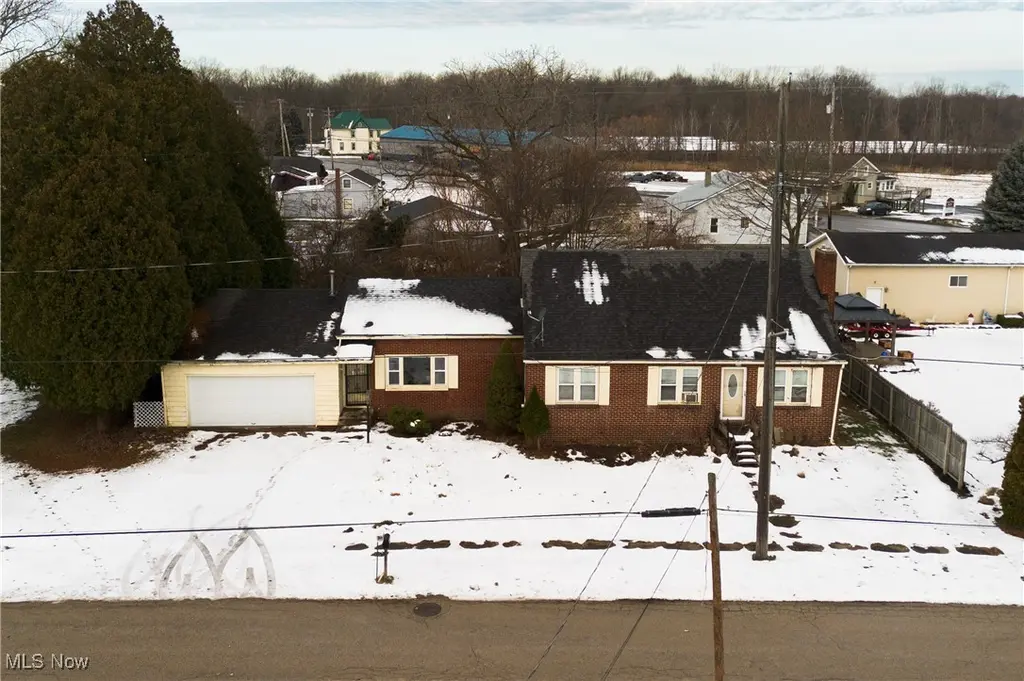
6123 Lucas Ave · Ashtabula, OH
Flood risk 1/10 · Minimal
- FEMA flood zone
- X (unshaded)
- Chance of flooding over 30 yrs
- 0.0%
- Est. flood insurance / yr
- $473 – $860
Fire risk 1/10 · Minimal
- Est. fire insurance / yr
- $713 – $1,323
Heat risk 3/10 · Minor
- Hot days now (above 95°F)
- 7 days/yr
- Hot days in 30 yrs
- 18 days/yr
Wind risk 1/10 · Minimal
- Chance of severe wind over 30 yrs
- —
Air-quality risk 3/10 · Minor
- Unhealthy air days now
- 2 days/yr
- Unhealthy air days in 30 yrs
- 5 days/yr
Risk factors via First Street. Map © Google.
Why this score? — see what drove the D grade
The composite is a weighted blend of 9 inputs, each scored 0–100. Each bar is that input's sub-score; the figure is the points it added to the 100-point composite (weight × sub-score).
- ARV discount +15.0/15.0
- Cash flow +11.0/30.0
- Livability +3.6/5.0
- DSCR +3.2/10.0
- 1% rule +3.0/10.0
- Rent growth +2.5/5.0
- Condition / age +2.5/5.0
- Schools +2.4/10.0
- Appreciation +0.0/10.0
$160,000
🖨 Deal sheet 📄 Offer letter ✓ Due diligence
Listing remarks MLS
Come and see this large brick home! The kitchen has tile countertops, a walk in pantry, a serving window, black cabinetry, and black appliances. The dining room has hardwood floors. The living room has tall ceilings and a white brick fireplace with a wooden mantle. The first bathroom has tile walls, shower, and vanity. The second bathroom has tile flooring and a chocolate vanity. The large foyer area could be used as a second living room and extra cabinet space for the kitchen. The heated garage is convenient for keeping your vehicle warm and out of the weather elements. 1st floor laundry so you don't have to walk up and down large stairs to do the laundry. The privacy fence and treeline give the back yard a nice private feel. Come and make this your home today!
Key facts
- Black appliances
- Tile countertops
- Serving window
Tags
Neighborhood map
What this means for you Summary
Snapshot
- This is a 2-bed/2.5-bath single-family listed at $160k.
Deal economics
- At list price, monthly cash flow is $-68 ($-819/yr) — negative.
- To cash-flow at today's rent, offer at most $148k (7.5% below list).
- To meet the 1% rule (rent ≥ 1% of price), the offer needs to be $128k (20.2% below list).
- Recommended offer: $128k (20.2% below list) — sets the bar for 1% rule.
- Cap rate 5.8% vs local median 8.2% in Ashtabula — below-typical yield; the buyer is paying a premium for something (appreciation thesis, condition, location) that the cap rate doesn't capture.
Location & tenants
- Location reads 71/100 on livability (#420 in OH) — a middle-class / working-renter tenant base. Strengths: cost of living A+, health & safety A+, housing A; Watch: schools C-, amenities F, commute F.
- Ashtabula Area City (town): math 24% / reading 35% proficiency, ranked #588 of 656 in OH (top 90%) — low school quality limits family demand, transient renter base, plan for 1-2y turnover; 63% free/reduced lunch — lower-income household profile, screen leases tightly.
- Market conditions: 162 active listings in the ZIP; 155 units permitted in Ashtabula County in 2024 (0 in 5+ unit buildings).
- This rent runs 31% of the median local income ($50k/yr) — at the standard rent-burdened threshold; future hikes will face affordability resistance.
Forward outlook
- Local home prices are declining (-3.0%/yr); year-one equity from $1k of loan paydown is wiped out by about $5k of value loss. Plan a longer hold.
- Ashtabula County population projected at -22% by 2050 — secular population decline; favor cash flow + early exit over multi-decade hold.
Negotiation context
- It's been on market 177 days — a 12% lower offer ($141k) is reasonable based on typical stale-listing flexibility.
- 8 sale attempts since 24y ago; this cycle's ask has dropped $10k (6%) from the opening price — seller is motivated, your offer sets the floor, not the list.
- Current owner paid $115k; 39% above their basis — modest negotiation headroom, anchor on the comps not their cost.
Risks & watch-outs
- Watch-outs: built in 1948 — expect roof / HVAC / electrical / plumbing capex.
Questions for the listing agent
- What do current leases actually rent for vs. the listed asking? Can we see a recent rent roll and the last 12 months of T-12 income?
- It's been on market 177 days. Have you received any prior offers? Is the seller open to a 20% concession, seller financing, or rate buy-down credit?
- Built in 1948 — when were the roof, HVAC, electrical panel, plumbing, and water heater last replaced?
- Why hasn't it sold? Are there any deal-killer items the seller is aware of (foundation, flood, title, zoning, code violations)?
- Is there a deadline driving the sale (1031 exchange, divorce, estate, relocation)? That informs how much negotiation room exists.
- The area grade is low — what's the realistic commute time and amenity access for the typical tenant pool here? Any planned neighborhood developments (good or bad) we should know about?
- What's the average days-on-market for RENTAL listings here right now (not sales)? A rising rental-DOM trend means longer vacancies and softer asking-rent achievability than the comps imply.
- What's the recent tenant-quality profile in this submarket — average credit score on applications, eviction rate, late-payment / NSF rate, and stable-employment percentage? A property-management company in the area should have these aggregated.
- How much new for-sale + rental construction is in the pipeline within 1–3 miles? Heavy new supply typically softens prices + rents 12–24 months out; constrained supply supports both.
Investment metrics
- 1% rule
- 0.80% ✗
- Cap rate
- 5.78%
- Cash-on-cash
- -1.83%
- DSCR
- 0.92
- GRM
- 10.4
CMA / ARV
- ARV (median comp)
- $247,233
- List price
- $160,000
- Delta
- -35.28%
- Verdict
- UNDERPRICED
- Comps
- 20 within 1.0 mi
Projected returns pro-forma
-3.0% appreciation · 3.0% rent growth · sell at horizon
- IRR
- -19.3%
- Equity multiple
- 0.32×
- Total profit
- $-30,274
- Equity at exit
- $23,857
- IRR
- -12.0%
- Equity multiple
- 0.29×
- Total profit
- $-31,957
- Equity at exit
- $13,834
Cash invested: $44,800 (down + closing). Projections, not guarantees.
Landlord ↔ Tenant lean methodology
- Overall (STATE)
- 73 Landlord-Friendly
- State Ohio
- 73 Landlord-Friendly · R+6
- County
- — inherits STATE
- City
- — inherits STATE
ZIP-level market 44004
- Home prices YoY
- -30.5%
- Active inventory
- 162
- Price-to-rent
- 10.4×
Monthly cashflow live
- Estimated rent
- $1,276 medium interval (Pro) →
- Mortgage (P&I)
- −$839
- Tax from tax record
- −$171 /mo · $2,049/yr
- Insurance
- −$67
- HOA
- −$0
- Vacancy / Maint / Mgmt
- −$268
- Net cashflow
- $-68
Break-even live
UW: 25.0% down · 7.5% · 30yr · 1.5% tax · 5.0% vac · 8.0% maint · 8.0% mgmt
Financing live
Cash to close
- Down payment
- $40,000
- Closing costs
- $4,800
- Reserves months
- —
- Total cash needed
- —
Loan-product check · same deal, 3 products live
Conventional
25% down · 7.5% · 30yr
- Down + closing
- —
- Monthly P&I
- —
- Monthly cashflow
- —
- DSCR
- —
- Eligible?
- —
Personal DTI + credit; lowest rate.
DSCR
20% down · 8.5% · 30yr
- Down + closing
- —
- Monthly P&I
- —
- Monthly cashflow
- —
- DSCR
- —
- Eligible?
- —
No personal income docs; deal must DSCR.
Hard money
10% down · 12.0% · 12mo
- Down + closing
- —
- Monthly P&I
- —
- Monthly cashflow
- —
- DSCR
- —
- Eligible?
- —
Short-term bridge; refi at stabilization.
Listing history 35 events
-
2026-06-18days on market $160,000 Active 177 DOM
-
2026-06-17days on market $160,000 Active 176 DOM
-
2026-06-13days on market $160,000 Active 175 DOM
-
2026-06-12days on market $160,000 Active 174 DOM
-
2026-06-09days on market $160,000 Active 171 DOM
-
2026-06-08days on market $160,000 Active 170 DOM
-
2026-06-07days on market $160,000 Active 169 DOM
-
2026-06-07days on market $160,000 Active 168 DOM
-
2026-06-04days on market $160,000 Active 165 DOM
-
2026-06-02days on market $160,000 Active 164 DOM
-
2026-06-01status $160,000 Active 163 DOM
-
2026-06-01days on market $160,000 Contingent 163 DOM
-
2026-05-31days on market $160,000 Contingent 162 DOM
-
2026-04-16price $160,000 772-char remark
Show marketing remark (772 chars)
Come and see this large brick home! The kitchen has tile countertops, a walk in pantry, a serving window, black cabinetry, and black appliances. The dining room has hardwood floors. The living room has tall ceilings and a white brick fireplace with a wooden mantle. The first bathroom has tile walls, shower, and vanity. The second bathroom has tile flooring and a chocolate vanity. The large foyer area could be used as a second living room and extra cabinet space for the kitchen. The heated garage is convenient for keeping your vehicle warm and out of the weather elements. 1st floor laundry so you don't have to walk up and down large stairs to do the laundry. The privacy fence and treeline give the back yard a nice private feel. Come and make this your home today!
-
2025-12-20$170,000 Active 772-char remark
Show marketing remark (772 chars)
Come and see this large brick home! The kitchen has tile countertops, a walk in pantry, a serving window, black cabinetry, and black appliances. The dining room has hardwood floors. The living room has tall ceilings and a white brick fireplace with a wooden mantle. The first bathroom has tile walls, shower, and vanity. The second bathroom has tile flooring and a chocolate vanity. The large foyer area could be used as a second living room and extra cabinet space for the kitchen. The heated garage is convenient for keeping your vehicle warm and out of the weather elements. 1st floor laundry so you don't have to walk up and down large stairs to do the laundry. The privacy fence and treeline give the back yard a nice private feel. Come and make this your home today!
-
2025-10-28soldstatus $115,000
-
2013-02-09historical
-
2012-08-09$109,900
-
2010-12-06soldstatus $98,500
-
2010-12-06soldstatus $98,500
-
2010-07-01$102,000
-
2008-06-30historical
-
2008-03-30historical
-
2008-01-04$58,727
-
2007-12-22historical
-
2007-06-22$69,091
-
2007-03-30$85,500
-
2003-12-23soldstatus $93,000
-
2003-12-23soldstatus $93,000
-
2003-12-08historical
-
2003-06-03$89,900
-
2003-04-22historical
-
2002-10-22$109,900
-
1997-01-08soldstatus $62,000
-
1995-07-11soldstatus $35,000
ⓘ Source: listings_history table (triggers on properties + properties_extension) + one-shot
backfill from property_details.listing_events for pre-trigger history.
Tax reassessment forecast OH · Partial reset (capped growth)
- Current annual tax
- $2,049 · $171/mo
- Projected year-2 tax
- $2,273 · $189/mo
- Expected delta
- +$223/yr (+$19/mo · 10.9%)
ⓘ Screening estimate from a state-policy table — verify with the county assessor before closing.
Climate risk First Street
- Flood 1/10 Low FEMA zone X (unshaded) · 0% chance over 30 yrs
- Wildfire 1/10 Low
- Heat 3/10 Moderate 7 d/yr ≥95°F today · 18 d/yr by 30 yrs out
- Wind 1/10 Low
- Air quality 3/10 Moderate 2 unhealthy d/yr today · 5 by 30 yrs out
Nearby sold comps map
Loading sold comps map…
Walkable amenities ~0.75 mi
Loading nearby amenities…
Taxation est. · year 1
- Rental income
- $15,314
- − Mortgage interest
- −$8,962
- − Property taxes
- −$2,049
- − Insurance
- −$800
- − Repairs & maintenance
- −$1,225
- − Management
- −$1,225
- − Depreciation
- −$4,655
- Taxable loss
- −$3,602
- Est. tax savings @ 24.0%
- +$864
- After-tax cash flow
- $45/yr
For passive investors: Depreciation is non-cash, so a rental often shows a tax loss while cash-flowing — sheltering income. Rental losses are passive: they offset passive income freely, and up to $25,000/yr can offset ordinary (W-2) income if you actively participate and your MAGI is under $100k (phasing out to $0 by $150k); unused losses carry forward. On sale, claimed depreciation is recaptured at up to 25%, and gains may owe capital-gains tax (a 1031 exchange can defer both). Figures are a year-1 estimate at your 24.0% rate — not tax advice; consult a CPA.
Schools (NCES district)
- District
- Ashtabula Area City
- NCES district ID
- 3904351
- Math proficiency
- 24% ▼ -27.00%
- Reading proficiency
- 35% ▼ -13.00%
- Median HH income
- $34,812
- Composite
- 24.3/100
- National rank
- #7712
- State rank
- #588 of 656 in OH
Livability — Ashtabula
- Score
- 71/100
- State rank
- #420
- US rank
- #6883
Category grades
Schools grade is shown separately in the Schools card above.
Census & demographics
- County
- Ashtabula · 97,617 people
- City population
- 31,076
- Metro
- Cleveland, OH
- Population (ZIP)
- 31,076
- Household income
- $49,507
- Rent vs Own
- Severe rent burden
- 14.1
Population outlook (Ashtabula County) Hauer SSP2
- Today (2025)
- 92,950 people
- By 2030
- 89,146 · -4.1%
- By 2040
- 80,715 · -13.2%
- By 2050
- 72,270 · -22.2%
- By 2075
- 55,780 · -40.0%
- By 2100
- 40,928 · -56.0%
Race, ethnicity, and origin ACS 2023
- Neighborhood character
- Predominantly White (79%)
- Race & ethnicity
- White 79% Hispanic / Latino 9% Two or more races 7% Black 6%
- Hispanic origin (detail)
- Mexican 3% Puerto Rican 5%
- Common ancestry
- Romanian 4% Iranian 2% Slovak 1%
- Foreign-born
- 3% · Canada
- Languages at home
- 94% English-only · Spanish 4%
Political lean MEDSL · Ashtabula
- 2024 margin
- Strong R (+28.4) · D 35.4% · R 63.8%
- 2008→2024 swing
- -41.9pp toward R · 2008: 13.5pp · 2024: -28.4pp
- All cycles
- 2024: R+28.4 2020: R+23.5 2016: R+19.0 2012: D+12.1 2008: D+13.5
Not yet ingested
- Civics
- —
Market trends
- HPI YoY
- ▼ -114.51%
- Current HPI
- 260.7146
- Rent YoY
- —
- Metro
- —
- State GDP YoY
- ▲ 1.98%
- F500 in state
- 48
Industry mix (Fortune 500 HQ in OH)
| Industry | F500 HQs | Revenue |
|---|---|---|
| Insurance | 3 | $145B |
|
||
| Industrial Machinery | 3 | $49B |
|
||
| Financial Services | 3 | $24B |
|
||
| Consumer Goods | 2 | $93B |
|
||
| Aerospace / Defense | 2 | $47B |
|
||
| Utilities | 2 | $33B |
|
||
Price history
+357.1% since first listed22 events — show timeline
- 2026-04-16 Price Changed $160,000 MLSNOW
- 2025-12-20 Listed $170,000 MLSNOW
- 2025-10-28 Sold (Public Records) $115,000 Public Records
- 2013-02-09 Listing Removed — MLSNOW
- 2012-08-09 Listed $109,900 MLSNOW
- 2010-12-06 Sold (Public Records) $98,500 Public Records
- 2010-12-06 Sold (MLS) $98,500 MLSNOW
- 2010-07-01 Listed $102,000 MLSNOW
- 2008-06-30 Listing Removed — MLSNOW
- 2008-03-30 Listing Removed — MLSNOW
- 2008-01-04 Listed $58,727 MLSNOW
- 2007-12-22 Listing Removed — MLSNOW
- 2007-06-22 Listed $69,091 MLSNOW
- 2007-03-30 Listed $85,500 MLSNOW
- 2003-12-23 Sold (Public Records) $93,000 Public Records
- 2003-12-23 Sold (MLS) $93,000 MLSNOW
- 2003-12-08 Listing Removed — MLSNOW
- 2003-06-03 Listed $89,900 MLSNOW
- 2003-04-22 Listing Removed — MLSNOW
- 2002-10-22 Listed $109,900 MLSNOW
- 1997-01-08 Sold (Public Records) $62,000 Public Records
- 1995-07-11 Sold (Public Records) $35,000 Public Records
Property tax history
+5.3%/yrLatest (2025): $2,049 · +38.3% YoY. Source: county tax records.
Cash-flow waterfall
monthlySold comps — $/sqft
last 12 mo · ≤1 miLoading sold comps…