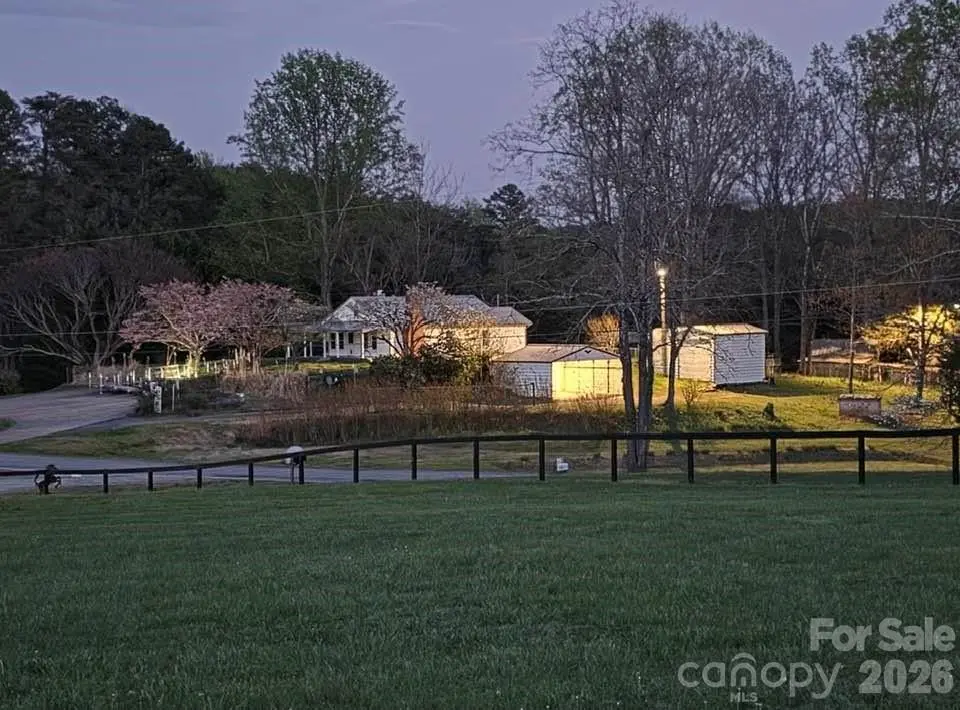
620 Smith Waldrop Rd · Columbus, NC
Flood risk 1/10 · Minimal
- FEMA flood zone
- X (unshaded)
- Chance of flooding over 30 yrs
- 0.0%
- Est. flood insurance / yr
- $507 – $1,088
Fire risk 4/10 · Minor
- Est. fire insurance / yr
- $906 – $1,684
Heat risk 5/10 · Moderate
- Hot days now (above 105°F)
- 7 days/yr
- Hot days in 30 yrs
- 17 days/yr
Wind risk 2/10 · Minimal
- Chance of severe wind over 30 yrs
- —
Air-quality risk 2/10 · Minimal
- Unhealthy air days now
- 2 days/yr
- Unhealthy air days in 30 yrs
- 2 days/yr
Risk factors via First Street. Map © Google.
Why this score? — see what drove the D grade
The composite is a weighted blend of 9 inputs, each scored 0–100. Each bar is that input's sub-score; the figure is the points it added to the 100-point composite (weight × sub-score).
- Appreciation +10.0/10.0
- Cash flow +7.8/30.0
- ARV discount +7.5/15.0
- Schools +5.1/10.0
- Livability +3.7/5.0
- Rent growth +2.5/5.0
- Condition / age +2.5/5.0
- DSCR +1.9/10.0
- 1% rule +1.7/10.0
$249,999
🖨 Deal sheet (PDF) 📄 Offer letter ✓ Due diligence
Listing remarks
This charming 1950s hobby farm is nestled on 2.80 acres in Polk County, NC and offers the perfect blend of peaceful country living and convenient access to town and major highways. Perched atop a gentle hill, this 1,031 sf farmhouse enjoys year-round mountain views, while overlooking a picturesque horse farm. The classic wraparound porch invites you to sit a spell and enjoy the quiet surroundings before stepping inside this cozy home! The living room is complete with warm cedar paneling and a propane glass-rocks fireplace. From there, the home flows easily into the updated kitchen and dining area or toward the 2 small bedrooms, both bedrooms maintaining the home’s original charm (with
Key facts
- 2.80 acres
- Fenced yard
- Wood-burning stove
Tags
Property features AI
Finance
- Other: Property classified as residential single-family; Accessibility ramp to main level; Horse amenities noted (see remarks)
- HOA & community: No HOA
Exterior
- Parking: Attached garage (2 spaces) with garage door opener; garage faces side; Attached carport (2 spaces); Circular driveway and additional driveway parking; RV access/parking; tandem parking available; Ample parking around the driveway, side and rear near the sheds
- Security: Security system
- Utilities: Shared well / private well (see remarks); Septic system installed; Electric service connected; Propane available
- Home design: Single-family residence, site-built; One level
- Construction: Vinyl exterior; Metal roof; Basement and crawl space foundation
- Exterior features: Covered front, side and wrap-around porch; Storage buildings including barn(s), outbuilding(s), shed(s), and tractor shed; Generator on property; Fenced front and back yard with chain link fencing; Cleared areas, orchards, level and rolling terrain with wooded sections and views; Publicly maintained paved roads (asphalt/concrete)
Interior
- Kitchen: Electric range; Microwave; Refrigerator; Breakfast bar
- Bedrooms: 2 bedrooms on the main level
- Bathrooms: 1 full bathroom (main level)
- Heating & cooling: Electric and propane heating options; Heat pump; Wood stove; Central air conditioning; Heat pump cooling
- Interior features: Attic with fixed stairs and walk-in access; Breakfast bar; 6 total rooms; Basement shop, storage space, partial unfinished basement with dirt floor and both interior and exterior entry; Walk-out / walk-up basement access; Ceiling fan(s) in at least one room; Gas/propane fireplace in the living room (see remarks)
- Laundry & utility: Washer/Dryer located in the kitchen
Neighborhood map
What this means for you Summary
Snapshot
- This is a 2-bed/1.0-bath single-family listed at $250k.
Deal economics
- At list price, monthly cash flow is $-279 ($-3k/yr) — negative.
- To cash-flow at today's rent, offer at most $201k (19.7% below list).
- To meet the 1% rule (rent ≥ 1% of price), the offer needs to be $167k (33.1% below list).
- Recommended offer: $167k (33.1% below list) — sets the bar for 1% rule.
- Cap rate 5.0% vs local median 3.5% in Columbus — top-decile yield for the area; either an underpriced asset or a hidden risk that comps aren't pricing in. Stress-test before assuming the spread holds.
Location & tenants
- Location reads 74/100 on livability (#53 in NC, #4,439 nationally) — a middle-class / working-renter tenant base. Strengths: crime A+, cost of living A+, health & safety A+; Watch: employment D+, amenities F, commute F.
- Polk County Schools (rural): math 58% / reading 62% proficiency, ranked #32 of 178 in NC (top 18%) — acceptable for families but not a draw, mixed tenant base, ~2y average lease.
- Zoned schools: Tryon Elementary School (math 67% / reading 62%, grade B, #147 of 1,410 statewide, top 11%, 407 students, 99% FRL); Polk County Middle School (math 46% / reading 59%, grade C+, #94 of 475 statewide, top 20%, 475 students, 56% FRL); Polk County High School (math 72% / reading 67%, grade B, #121 of 535 statewide, top 24%, 579 students, 52% FRL) — zoned schools average 69% FRL vs 50% district-wide (19 pts higher); higher-poverty schools than district average — tighter screening recommended.
- Market conditions: 132 active listings in the ZIP; 143 units permitted in Polk County in 2024 (0 in 5+ unit buildings).
Forward outlook
- In year one you build about $27k of equity ($2k loan paydown + $25k appreciation (10.0% local appreciation)).
- Polk County population projected at -12% by 2050 — secular population decline; favor cash flow + early exit over multi-decade hold.
- By year 2, paydown + projected appreciation supports a ~$43k cash-out refi (75% LTV) — recoverable capital for the next deal without selling this one.
Negotiation context
- It's been on market 33 days — a 3% lower offer ($242k) is reasonable based on typical stale-listing flexibility.
- 6 sale attempts since 2y ago with the ask held roughly flat each time — persistent listings suggest the price (not the market) is what's stuck; bring a comps-based counter.
- Current owner paid $85k; list at $250k implies a 194% gain — meaningful room to come down on a strong offer.
Risks & watch-outs
- Watch-outs: built in 1950 — expect roof / HVAC / electrical / plumbing capex.
- Climate carrying-cost: extreme-heat days projected 7→17/yr by 2055 (HVAC capex compounding) — expect insurance premiums to compound above CPI over the hold.
Questions for the listing agent
- What do current leases actually rent for vs. the listed asking? Can we see a recent rent roll and the last 12 months of T-12 income?
- It's been on market 33 days. Have you received any prior offers? Is the seller open to a 33% concession, seller financing, or rate buy-down credit?
- Built in 1950 — when were the roof, HVAC, electrical panel, plumbing, and water heater last replaced?
- Is there a deadline driving the sale (1031 exchange, divorce, estate, relocation)? That informs how much negotiation room exists.
- Schools are D-rated, which usually means shorter tenancies and higher turnover. Who's the typical renter profile here, and what's been the actual vacancy rate?
- The area grade is low — what's the realistic commute time and amenity access for the typical tenant pool here? Any planned neighborhood developments (good or bad) we should know about?
- What's the average days-on-market for RENTAL listings here right now (not sales)? A rising rental-DOM trend means longer vacancies and softer asking-rent achievability than the comps imply.
- What's the recent tenant-quality profile in this submarket — average credit score on applications, eviction rate, late-payment / NSF rate, and stable-employment percentage? A property-management company in the area should have these aggregated.
- How much new for-sale + rental construction is in the pipeline within 1–3 miles? Heavy new supply typically softens prices + rents 12–24 months out; constrained supply supports both.
Investment metrics
- 1% rule
- 0.67% ✗
- Cap rate
- 4.95%
- Cash-on-cash
- -4.79%
- DSCR
- 0.79
- GRM
- 12.5
CMA / ARV
No comps found within radius.
Projected returns pro-forma
10.0% appreciation · 3.0% rent growth · sell at horizon
- IRR
- 20.9%
- Equity multiple
- 2.69×
- Total profit
- $118,303
- Equity at exit
- $225,219
- IRR
- 18.9%
- Equity multiple
- 6.18×
- Total profit
- $362,276
- Equity at exit
- $485,693
Cash invested: $70,000 (down + closing). Projections, not guarantees.
Landlord ↔ Tenant lean methodology
- Overall (STATE)
- 85 Strongly Landlord-Friendly
- State North Carolina
- 85 Strongly Landlord-Friendly · R+3
- County
- — inherits STATE
- City
- — inherits STATE
ZIP-level market 28722
- Home prices YoY
- 9.0%
- Active inventory
- 132
- Price-to-rent
- 12.5×
Monthly cashflow live
- Estimated rent
- $1,673 medium interval (Pro) →
- Mortgage (P&I)
- −$1,311
- Tax from tax record
- −$186 /mo · $2,231/yr
- Insurance
- −$104
- HOA
- −$0
- Vacancy / Maint / Mgmt
- −$351
- Net cashflow
- $-279
Break-even live
Sensitivity live
| Price | -10% $-138 | -5% $-209 | +0% $-279 | +5% $-350 | +10% $-421 |
|---|---|---|---|---|---|
| Rent | -10% $-412 | -5% $-346 | +0% $-279 | +5% $-213 | +10% $-147 |
| Rate | -1.0pp $-154 | -0.5pp $-216 | base $-279 | +0.5pp $-344 | +1.0pp $-410 |
UW: 25.0% down · 7.5% · 30yr · 1.5% tax · 5.0% vac · 8.0% maint · 8.0% mgmt
Financing live
Cash to close
- Down payment
- $62,500
- Closing costs
- $7,500
- Reserves months
- —
- Total cash needed
- —
Loan-product check · same deal, 3 products live
Conventional
25% down · 7.5% · 30yr
- Down + closing
- —
- Monthly P&I
- —
- Monthly cashflow
- —
- DSCR
- —
- Eligible?
- —
Personal DTI + credit; lowest rate.
DSCR
20% down · 8.5% · 30yr
- Down + closing
- —
- Monthly P&I
- —
- Monthly cashflow
- —
- DSCR
- —
- Eligible?
- —
No personal income docs; deal must DSCR.
Hard money
10% down · 12.0% · 12mo
- Down + closing
- —
- Monthly P&I
- —
- Monthly cashflow
- —
- DSCR
- —
- Eligible?
- —
Short-term bridge; refi at stabilization.
Listing history 29 events
-
2026-06-22days on market $249,999 Active 33 DOM
-
2026-06-18days on market $249,999 Active 30 DOM
-
2026-06-17days on market $249,999 Active 29 DOM
-
2026-06-16days on market $249,999 Active 28 DOM
-
2026-06-15days on market $249,999 Active 27 DOM
-
2026-06-14days on market $249,999 Active 25 DOM
-
2026-06-10days on market $249,999 Active 22 DOM
-
2026-06-09days on market $249,999 Active 21 DOM
-
2026-06-08days on market $249,999 Active 20 DOM
-
2026-06-07days on market $249,999 Active 19 DOM
-
2026-06-03days on market $249,999 Active 15 DOM
-
2026-06-02days on market $249,999 Active 14 DOM
-
2026-06-01days on market $249,999 Active 13 DOM
-
2026-05-31days on market $249,999 Active 12 DOM
-
2026-05-30days on market $249,999 Active 11 DOM
-
2026-05-19$249,999 Active
-
2026-02-02status Active
-
2026-01-16historical Active Under Contract
-
2025-10-14price $525,000
-
2025-10-13status Active
-
2025-10-09status Pending
-
2025-07-02status Active
-
2025-05-14price $550,000
-
2025-04-14price $665,000
-
2025-01-24soldstatus $85,000
-
2025-01-07$695,000 Active
-
2024-08-14price $989,000
-
2024-07-23price $1,100,000
-
2024-07-13$1,500,000 Active
ⓘ Source: listings_history table (triggers on properties + properties_extension) + one-shot
backfill from property_details.listing_events for pre-trigger history.
Tax reassessment forecast NC · Resets to sale price
- Current annual tax
- $2,231 · $186/mo
- Projected year-2 tax
- $2,231 · $186/mo
- Expected delta
- $0/yr ($0/mo · 0.0%)
ⓘ Screening estimate from a state-policy table — verify with the county assessor before closing.
Climate risk First Street
- Flood 1/10 Low FEMA zone X (unshaded) · 0% chance over 30 yrs
- Wildfire 4/10 Moderate
- Heat 5/10 Major 7 d/yr ≥105°F today · 17 d/yr by 30 yrs out
- Wind 2/10 Low
- Air quality 2/10 Low 2 unhealthy d/yr today · 2 by 30 yrs out
Nearby sold comps map
Loading sold comps map…
Walkable amenities ~0.75 mi
Loading nearby amenities…
Taxation est. · year 1
- Rental income
- $20,075
- − Mortgage interest
- −$14,004
- − Property taxes
- −$2,231
- − Insurance
- −$1,250
- − Repairs & maintenance
- −$1,606
- − Management
- −$1,606
- − Depreciation
- −$7,273
- Taxable loss
- −$7,894
- Est. tax savings @ 24.0%
- +$1,895
- After-tax cash flow
- $-1,459/yr
For passive investors: Depreciation is non-cash, so a rental often shows a tax loss while cash-flowing — sheltering income. Rental losses are passive: they offset passive income freely, and up to $25,000/yr can offset ordinary (W-2) income if you actively participate and your MAGI is under $100k (phasing out to $0 by $150k); unused losses carry forward. On sale, claimed depreciation is recaptured at up to 25%, and gains may owe capital-gains tax (a 1031 exchange can defer both). Figures are a year-1 estimate at your 24.0% rate — not tax advice; consult a CPA.
Schools (NCES district)
- District
- Polk County Schools
- NCES district ID
- 3703720
- Math proficiency
- 58% ▬ 0.00%
- Reading proficiency
- 62% ▬ 0.00%
- Median HH income
- $44,641
- Composite
- 50.56/100
- National rank
- #1847
- State rank
- #32 of 178 in NC
Livability — Columbus
- Score
- 74/100
- State rank
- #53
- US rank
- #4439
Category grades
Schools grade is shown separately in the Schools card above.
Census & demographics
- Population (ZIP)
- 5,998
Population outlook (Polk County) Hauer SSP2
- Today (2025)
- 20,043 people
- By 2030
- 19,764 · -1.4%
- By 2040
- 18,836 · -6.0%
- By 2050
- 17,529 · -12.5%
- By 2075
- 14,741 · -26.5%
- By 2100
- 11,461 · -42.8%
Race, ethnicity, and origin ACS 2023
- Neighborhood character
- Predominantly White (91%)
- Race & ethnicity
- White 91% Two or more races 4% Hispanic / Latino 4% Black 3%
- Common ancestry
- Iranian 4% Slovak 4% Italian 4%
- Foreign-born
- 4% · Canada
- Languages at home
- 93% English-only · German/W. Germanic 3% Spanish 3%
Political lean MEDSL · Polk
- 2024 margin
- Strong R (+25.2) · D 37.0% · R 62.2%
- 2008→2024 swing
- -10.1pp toward R · 2008: -15.1pp · 2024: -25.2pp
- All cycles
- 2024: R+25.2 2020: R+25.7 2016: R+28.2 2012: R+21.5 2008: R+15.1
Not yet ingested
- Civics
- —
Market trends
- HPI YoY
- ▲ 27.76%
- Current HPI
- 336.4252
- Rent YoY
- —
- Metro
- —
- State GDP YoY
- ▲ 3.28%
- F500 in state
- 26
Industry mix (Fortune 500 HQ in NC)
| Industry | F500 HQs | Revenue |
|---|---|---|
| Financial Services | 2 | $213B |
|
||
| Retail | 2 | $95B |
|
||
| Industrial Conglomerate | 1 | $38B |
|
||
| Metals / Steel | 1 | $35B |
|
||
| Utilities | 1 | $30B |
|
||
| Industrial Machinery | 1 | $19B |
|
||
Price history
-83.3% since first listed14 events — show timeline
- 2026-05-19 Listed $249,999 CANOPYMLS as Distributed by MLS Grid
- 2026-02-02 Relisted — CANOPYMLS as Distributed by MLS Grid
- 2026-01-16 Contingent — CANOPYMLS as Distributed by MLS Grid
- 2025-10-14 Price Changed $525,000 CANOPYMLS as Distributed by MLS Grid
- 2025-10-13 Relisted — CANOPYMLS as Distributed by MLS Grid
- 2025-10-09 Pending — CANOPYMLS as Distributed by MLS Grid
- 2025-07-02 Relisted — CANOPYMLS as Distributed by MLS Grid
- 2025-05-14 Price Changed $550,000 CANOPYMLS as Distributed by MLS Grid
- 2025-04-14 Price Changed $665,000 CANOPYMLS as Distributed by MLS Grid
- 2025-01-24 Sold (Public Records) $85,000 Public Records
- 2025-01-07 Listed $695,000 CANOPYMLS as Distributed by MLS Grid
- 2024-08-14 Price Changed $989,000 CANOPYMLS as Distributed by MLS Grid
- 2024-07-23 Price Changed $1,100,000 CANOPYMLS as Distributed by MLS Grid
- 2024-07-13 Listed $1,500,000 CANOPYMLS as Distributed by MLS Grid
Property tax history
+5.3%/yrLatest (2025): $2,231 · +21.1% YoY. Source: county tax records.
Cash-flow waterfall
monthlySold comps — $/sqft
last 12 mo · ≤1 miLoading sold comps…