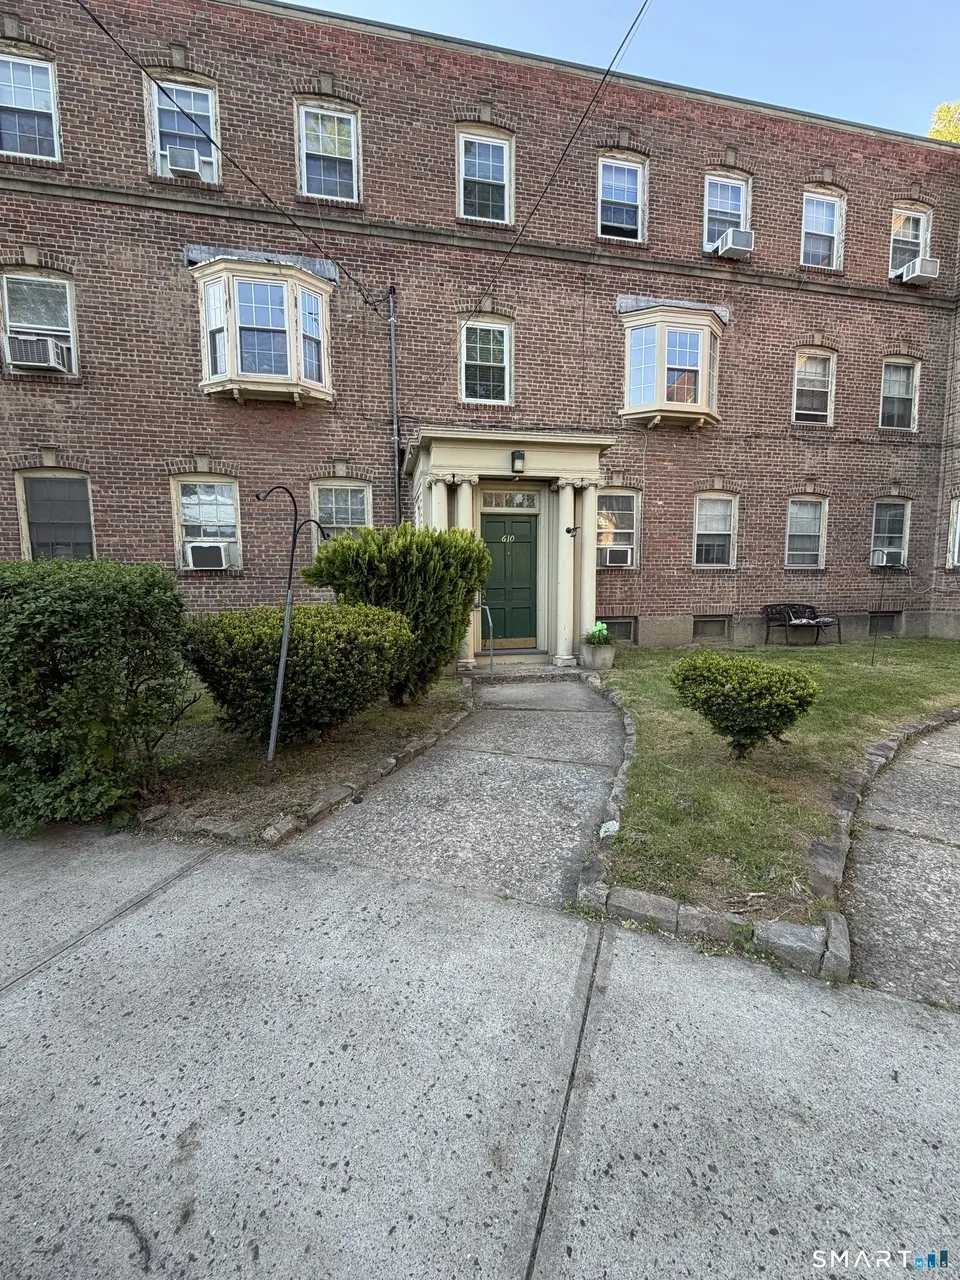
610 Wilmot Ave #6 · Bridgeport, CT
Flood risk No data
- FEMA flood zone
- —
- Chance of flooding over 30 yrs
- —
- Est. flood insurance / yr
- —
Fire risk No data
- Est. fire insurance / yr
- —
Heat risk No data
- Hot days now (above threshold)
- —
- Hot days in 30 yrs
- —
Wind risk No data
- Chance of severe wind over 30 yrs
- —
Air-quality risk No data
- Unhealthy air days now
- —
- Unhealthy air days in 30 yrs
- —
Risk factors via First Street. Map © Google.
Why this score? — see what drove the B grade
The composite is a weighted blend of 9 inputs, each scored 0–100. Each bar is that input's sub-score; the figure is the points it added to the 100-point composite (weight × sub-score).
- Cash flow +30.0/30.0
- 1% rule +10.0/10.0
- DSCR +10.0/10.0
- Appreciation +10.0/10.0
- Livability +4.0/5.0
- Rent growth +2.5/5.0
- Condition / age +2.2/5.0
- Schools +1.2/10.0
- ARV discount +0.0/15.0
$65,500
🖨 Deal sheet 📄 Offer letter ✓ Due diligence
Listing remarks
Enjoy this well-kept 2 bedroom, 1 bath ranch apartment-style co-op offering comfortable and convenient living. This home features an enclosed porch, perfect for use as an additional room ideal for a home office or laundry area. Enjoy added storage in the basement and the ease of maintenance-free living, with heat, hot water, and grounds upkeep included in the HOA. A great opportunity for low-maintenance living.
Key facts
- Added storage
- Additional room
- Enclosed porch
Tags
Property features AI
Finance
- HOA & community: Monthly HOA fee of $595; HOA covers grounds maintenance, trash pickup, snow removal, heat, hot water, water, sewer, property management, and taxes; Professional off-site property management; No pets allowed
Exterior
- Parking: On-street parking; Off-street parking; Assigned parking (1 space)
- Utilities: Public water; Public sewer; Natural gas
- Home design: Co-op condominium; Unit located on 3rd floor; One-level unit
- Construction: Brick construction
- Exterior features: Brick siding; Level lot
Interior
- Kitchen: Oven/Range; Microwave; Refrigerator
- Bedrooms: 2 bedrooms
- Bathrooms: 1 full bathroom
- Heating & cooling: Gas heating; Natural gas hot water
- Interior features: Partial shared basement with storage
- Laundry & utility: In-unit laundry (washer and electric dryer) located on the main level
Neighborhood map
What this means for you Summary
Snapshot
- This is a 2-bed/1.0-bath condo listed at $66k. Condition is rated fair.
Deal economics
- At list price, monthly cash flow is $370 ($4k/yr) — positive.
- The deal already cash-flows at list — no discount required.
- Meets the 1% rule at list price ($2k rent vs $66k).
- Recommended offer: $64k (3.0% below list) — sets the bar for market timing.
- Cap rate 13.1% vs local median 5.0% in Bridgeport — top-decile yield for the area; either an underpriced asset or a hidden risk that comps aren't pricing in. Stress-test before assuming the spread holds.
Location & tenants
- Location reads 81/100 on livability (#15 in CT, #1,374 nationally) — a professional / high-income tenant draw. Strengths: amenities A+, commute A+, health & safety A+; Watch: crime C-, employment D+, schools D-.
- Bridgeport School District (urban): math 9% / reading 19% proficiency, ranked #151 of 153 in CT (top 99%) — low school quality limits family demand, transient renter base, plan for 1-2y turnover; 97% free/reduced lunch — lower-income household profile, screen leases tightly.
- Market conditions: 33 active listings in the ZIP; 29 comparable units currently listed for rent nearby; rentals at typical pace (median 15d on market — plan ~3-4 weeks tenant-placement turnaround); 852 units permitted in Greater Bridgeport Planning Region in 2024 (698 in 5+ unit buildings).
- This rent runs 43% of the median local income ($50k/yr) — at the standard rent-burdened threshold; future hikes will face affordability resistance.
Forward outlook
- In year one you build about $7k of equity ($453 loan paydown + $7k appreciation (10.0% local appreciation)).
- At projected returns (10.0% appreciation + 3.0% rent growth), your $18k cash investment doubles in ~2 years — after that, you're playing with house money.
- By year 5, paydown + projected appreciation supports a ~$33k cash-out refi (75% LTV) — recoverable capital for the next deal without selling this one.
Negotiation context
- It's been on market 43 days — a 3% lower offer ($64k) is reasonable based on typical stale-listing flexibility.
Risks & watch-outs
- Watch-outs: HOA is 33% of rent; built in 1908 — expect roof / HVAC / electrical / plumbing capex.
Questions for the listing agent
- It's been on market 43 days. Have you received any prior offers? Is the seller open to a 3% concession, seller financing, or rate buy-down credit?
- Have any recent inspections been done? Can we get a copy of the seller's disclosures and any deferred-maintenance estimates?
- Built in 1908 — when were the roof, HVAC, electrical panel, plumbing, and water heater last replaced?
- What does the HOA fee cover, when was the last increase, and are there any pending special assessments or reserve-fund shortfalls?
- Any open or pending special assessments — roof, HVAC, plumbing, elevator, façade? What's the per-unit balance and payoff schedule, and is the seller paying it off at close or rolling it to the buyer?
- Is there a deadline driving the sale (1031 exchange, divorce, estate, relocation)? That informs how much negotiation room exists.
- Schools are D-rated, which usually means shorter tenancies and higher turnover. Who's the typical renter profile here, and what's been the actual vacancy rate?
- What's the average days-on-market for RENTAL listings here right now (not sales)? A rising rental-DOM trend means longer vacancies and softer asking-rent achievability than the comps imply.
- What's the recent tenant-quality profile in this submarket — average credit score on applications, eviction rate, late-payment / NSF rate, and stable-employment percentage? A property-management company in the area should have these aggregated.
- How much new apartment / multifamily construction is in the pipeline within 1–3 miles? Heavy new supply (>2% of stock underway) typically softens rents 12–24 months out; light construction supports rent growth.
Investment metrics
- 1% rule
- 2.74% ✓
- Cap rate
- 13.08%
- Cash-on-cash
- 24.24%
- DSCR
- 2.08
- GRM
- 3.0
CMA / ARV
- ARV (median comp)
- $54,021
- List price
- $65,500
- Delta
- 21.25%
- Verdict
- OVERPRICED
- Comps
- 20 within 1.0 mi
Projected returns pro-forma
10.0% appreciation · 3.0% rent growth · sell at horizon
- IRR
- 42.7%
- Equity multiple
- 4.25×
- Total profit
- $59,656
- Equity at exit
- $59,008
- IRR
- 37.1%
- Equity multiple
- 9.61×
- Total profit
- $157,908
- Equity at exit
- $127,252
Cash invested: $18,340 (down + closing). Projections, not guarantees.
Landlord ↔ Tenant lean methodology
- Overall (STATE)
- 27 Tenant-Leaning
- State Connecticut
- 27 Tenant-Leaning · D+7
- County
- — inherits STATE
- City
- — inherits STATE
ZIP-level market 06607
- Home prices YoY
- 4.7%
- Active inventory
- 33
- Price-to-rent
- 3.0×
Monthly cashflow live
- Estimated rent
- $1,795 high interval (Pro) →
- Mortgage (P&I)
- −$343
- Tax est. 1.5%
- −$82 /mo · $982/yr
- Insurance
- −$27
- HOA
- −$595
- Vacancy / Maint / Mgmt
- −$377
- Net cashflow
- $370
Break-even live
UW: 25.0% down · 7.5% · 30yr · 1.5% tax · 5.0% vac · 8.0% maint · 8.0% mgmt
Financing live
Cash to close
- Down payment
- $16,375
- Closing costs
- $1,965
- Reserves months
- —
- Total cash needed
- —
Loan-product check · same deal, 3 products live
Conventional
25% down · 7.5% · 30yr
- Down + closing
- —
- Monthly P&I
- —
- Monthly cashflow
- —
- DSCR
- —
- Eligible?
- —
Personal DTI + credit; lowest rate.
DSCR
20% down · 8.5% · 30yr
- Down + closing
- —
- Monthly P&I
- —
- Monthly cashflow
- —
- DSCR
- —
- Eligible?
- —
No personal income docs; deal must DSCR.
Hard money
10% down · 12.0% · 12mo
- Down + closing
- —
- Monthly P&I
- —
- Monthly cashflow
- —
- DSCR
- —
- Eligible?
- —
Short-term bridge; refi at stabilization.
Rent comps 29 comps
| Address | Beds | Baths | Sqft | Rent | $/sqft | DOM | Units | Dist |
|---|---|---|---|---|---|---|---|---|
| 647 Union Ave Unit 2 Bridgeport, CT | 2.0 | 1.0 | 750 | $1,675 | $2.23 | 3d | 1 | 0.14mi |
| 145 Cowles St Unit B7 Bridgeport, CT | 1.0 | 1.0 | 600 | $1,325 | $2.21 | 3d | 1 | 0.31mi |
| 1525 Central Ave Bridgeport, CT | 1.0 | 1.0 | 625 | $1,550 | $2.48 | 44d | 3 | 0.48mi |
| 222 Beardsley St Unit 3rd floor Bridgeport, CT | 2.0 | 1.0 | 732 | $2,000 | $2.73 | 44d | 1 | 0.49mi |
| 1150 Ogden Street Ext Unit 102 Bridgeport, CT | 1.0 | 1.0 | 700 | $1,425 | $2.04 | 14d | 1 | 0.67mi |
| 556 Hollister St Stratford, CT | 1.0–2.0 | 1.0 | 725 | $2,295 | $3.17 | 12d | 4 | 0.69mi |
| 192 Peace St Unit 1st floor Stratford, CT | 2.0 | 1.0 | 712 | $2,000 | $2.81 | 44d | 1 | 0.82mi |
| 588-612 E Main St Unit 598 Bridgeport, CT | 2.0 | 1.0 | 750 | $1,975 | $2.63 | 10d | 1 | 0.92mi |
| 588-612 E Main St Unit D Bridgeport, CT | 2.0 | 1.0 | 750 | $2,125 | $2.83 | 44d | 1 | 0.92mi |
| 86 Birdsey St Unit 3R Bridgeport, CT | 1.0 | 1.0 | 650 | $1,350 | $2.08 | 44d | 1 | 0.95mi |
| 1254 Pembroke St Unit 1st Floor Bridgeport, CT | 2.0 | 1.0 | 738 | $1,850 | $2.51 | 14d | 1 | 0.97mi |
| 855 Main St Bridgeport, CT | 1.0 | 1.0 | 490 | $2,380 | $4.86 | 3d | 10 | 0.99mi |
| 855 Main St Bridgeport, CT | 1.0 | 1.0 | 490 | $2,380 | $4.86 | 19d | 10 | 0.99mi |
| 250 N Bishop Ave Bridgeport, CT | 1.0 | 1.0 | 611 | $1,425 | $2.33 | 24d | 2 | 1.04mi |
| 250 N Bishop Ave #19 Bridgeport, CT | 1.0 | 1.0 | 638 | $1,650 | $2.59 | 44d | 1 | 1.04mi |
| 250 N Bishop Ave #1 Bridgeport, CT | 1.0 | 1.0 | 583 | $1,650 | $2.83 | 12d | 1 | 1.04mi |
| 55 E Main St Bridgeport, CT | 3.0 | 1.0–3.0 | 1115 | $6,712 | $6.02 | 3d | 189 | 1.06mi |
| 1333 E Main St Apt 1 Bridgeport, CT | 2.0 | 1.0 | 700 | $1,700 | $2.43 | 3d | 1 | 1.19mi |
| 1333 E Main St #5 Bridgeport, CT | 2.0 | 1.0 | 700 | $1,650 | $2.36 | 3d | 1 | 1.19mi |
| 105 William St Unit A Bridgeport, CT | 1.0 | 1.0 | 582 | $1,350 | $2.32 | 44d | 1 | 1.27mi |
| 116 Knowlton St Unit 2C Bridgeport, CT | 3.0 | 1.0 | 750 | $1,200 | $1.60 | 19d | 1 | 1.28mi |
| 235 Henry Ave Unit 12E Stratford, CT | 1.0 | 1.0 | 692 | $1,695 | $2.45 | 10d | 1 | 1.38mi |
| 116 Ogden St Unit 120 Bridgeport, CT | 2.0 | 1.0 | 688 | $2,375 | $3.45 | 3d | 1 | 1.41mi |
| 144 Golden Hill St Bridgeport, CT | 1.0 | 1.0 | 592 | $1,675 | $2.83 | 14d | 1 | 1.42mi |
| 600 Bond St Unit 112 Bridgeport, CT | 1.0 | 1.0 | 545 | $2,250 | $4.13 | 44d | 1 | 1.45mi |
| 231 Goddard Ave Unit 3RD Bridgeport, CT | 2.0 | 1.0 | 618 | $1,700 | $2.75 | 3d | 1 | 1.46mi |
| 432 Main St Unit 438 Bridgeport, CT | 3.0 | 1.0 | 565 | $1,950 | $3.45 | 44d | 1 | 1.47mi |
| 213 Golden Hill St Unit 4D Bridgeport, CT | 2.0 | 1.0 | 750 | $1,800 | $2.40 | 44d | 1 | 1.49mi |
| 225 Golden Hill St Apt 4D Bridgeport, CT | 2.0 | 1.0 | 750 | $1,800 | $2.40 | 44d | 1 | 1.49mi |
HOA detail condo
- Monthly dues
- $595 · $7,140/yr
- Likely covers
- waterlandscaping
- Assessments
- None detected in remarks — confirm with the listing agent.
Listing history 16 events
-
2026-06-18days on market $65,500 Active 43 DOM
-
2026-06-17pricedays on market $65,500 Active 42 DOM
-
2026-06-16days on market $68,500 Active 41 DOM
-
2026-06-15days on market $68,500 Active 40 DOM
-
2026-06-13days on market $68,500 Active 38 DOM
-
2026-06-13days on market $68,500 Active 37 DOM
-
2026-06-10days on market $68,500 Active 35 DOM
-
2026-06-09days on market $68,500 Active 34 DOM
-
2026-06-08days on market $68,500 Active 33 DOM
-
2026-06-07days on market $68,500 Active 32 DOM
-
2026-06-05days on market $68,500 Active 29 DOM
-
2026-06-03days on market $68,500 Active 28 DOM
-
2026-06-03days on market $68,500 Active 27 DOM
-
2026-06-01days on market $68,500 Active 26 DOM
-
2026-05-31days on market $68,500 Active 25 DOM
-
2026-05-05$68,500 Active 414-char remark
ⓘ Source: listings_history table (triggers on properties + properties_extension) + one-shot
backfill from property_details.listing_events for pre-trigger history.
Nearby sold comps map
Loading sold comps map…
Walkable amenities ~0.75 mi
Loading nearby amenities…
Taxation est. · year 1
- Rental income
- $21,540
- − Mortgage interest
- −$3,669
- − Property taxes
- −$982
- − Insurance
- −$328
- − Repairs & maintenance
- −$1,723
- − Management
- −$1,723
- − HOA
- −$7,140
- − Depreciation
- −$1,905
- Taxable income
- $4,069
- Est. tax owed @ 24.0%
- −$977
- After-tax cash flow
- $3,468/yr
For passive investors: Depreciation is non-cash, so a rental often shows a tax loss while cash-flowing — sheltering income. Rental losses are passive: they offset passive income freely, and up to $25,000/yr can offset ordinary (W-2) income if you actively participate and your MAGI is under $100k (phasing out to $0 by $150k); unused losses carry forward. On sale, claimed depreciation is recaptured at up to 25%, and gains may owe capital-gains tax (a 1031 exchange can defer both). Figures are a year-1 estimate at your 24.0% rate — not tax advice; consult a CPA.
Condition & rehab AI · 5 photos
This townhouse requires moderate renovations to improve its condition and increase its value. Key areas for improvement include the kitchen, bathroom, and flooring. Painting the interior walls and updating the kitchen and bathroom will significantly enhance the home's appeal and value.
Repairs flagged
- Major kitchen cabinets — poor condition
- Major kitchen countertops — worn and dated
- Moderate bathroom fixtures — basic and dated
- Major flooring — dated and worn carpet
Value-add opportunities
- Both paint interior walls — refreshes the space and makes it more appealing
- Both update kitchen cabinets and countertops — modernizes the kitchen and improves functionality
- Both update bathroom fixtures — enhances the bathroom and adds value
- Both replace flooring — improves the living space and adds value
Renovation cost estimate screening
| Repair item | Severity | Est. cost |
|---|---|---|
| kitchen cabinets · poor condition | Major | $15,000–50,000 |
| kitchen countertops · worn and dated | Major | $15,000–50,000 |
| bathroom fixtures · basic and dated | Moderate | $3,000–15,000 |
| flooring · dated and worn carpet | Major | $15,000–50,000 |
| Total estimated repair cost · 4 items | $48,000–165,000 |
Value-add ROI direction
- Both paint interior walls — refreshes the space and makes it more appealing ↑
- Both update kitchen cabinets and countertops — modernizes the kitchen and improves functionality ↑
- Both update bathroom fixtures — enhances the bathroom and adds value ↑
- Both replace flooring — improves the living space and adds value ↑
ⓘ Cost ranges are severity-bucket heuristics (US national rule-of-thumb). Get contractor quotes + a written scope before underwriting a rehab budget.
Schools (NCES district)
- District
- Bridgeport School District
- NCES district ID
- 0900450
- Math proficiency
- 9% ▼ -7.00%
- Reading proficiency
- 19% ▼ -10.00%
- Median HH income
- $41,507
- Composite
- 12.09/100
- National rank
- #9656
- State rank
- #151 of 153 in CT
Livability — Bridgeport
- Score
- 81/100
- State rank
- #15
- US rank
- #1374
Category grades
Schools grade is shown separately in the Schools card above.
Census & demographics
- Census place
- Bridgeport, CT
- County
- Fairfield County · 765,532 people
- City population
- 149,153
- Metro
- Bridgeport-Stamford-Norwalk, CT
- Population (ZIP)
- 7,979
- Household income
- $50,000
- Rent vs Own
- Severe rent burden
- 534.0
Population outlook (Greater Bridgeport County) Hauer SSP2
- By 2040
- 365,581
Race, ethnicity, and origin ACS 2023
- Neighborhood character
- Diverse neighborhood (Simpson 0.58)
- Race & ethnicity
- Hispanic / Latino 57% Black 31% Two or more races 19% Asian 6% White 3%
- Hispanic origin (detail)
- Mexican 2% Puerto Rican 32% Cuban 4% Dominican 4%
- Common ancestry
- Estonian 1% Russian 1%
- Foreign-born
- 25% · Canada, Vietnam, Jamaica
- Languages at home
- 52% English-only · Spanish 42% Other Asian/Pacific 2% Other Indo-European 2%
Political lean MEDSL · Greater Bridgeport
- 2024 margin
- Strong D (+23.3) · D 60.9% · R 37.6% · Other 1.5%
- All cycles
- 2024: D+23.3
Not yet ingested
- Civics
- —
Market trends
- HPI YoY
- ▲ 26.05%
- Current HPI
- 584.8108
- Rent YoY
- —
- Metro
- Bridgeport-Stamford-Norwalk, CT
- State GDP YoY
- ▲ 1.06%
- F500 in state
- 38
Industry mix (Fortune 500 HQ in CT)
| Industry | F500 HQs | Revenue |
|---|---|---|
| Industrial Machinery | 4 | $38B |
|
||
| Insurance | 3 | $71B |
|
||
| Financial Services | 2 | $25B |
|
||
| Transportation / Logistics | 2 | $18B |
|
||
| Healthcare | 1 | $247B |
|
||
| Telecommunications | 1 | $55B |
|
||
Price history
-4.4% since first listed2 events — show timeline
- 2026-06-16 Price Changed $65,500 Smart MLS
- 2026-05-05 Listed $68,500 Smart MLS
Cash-flow waterfall
monthlySold comps — $/sqft
last 12 mo · ≤1 miLoading sold comps…