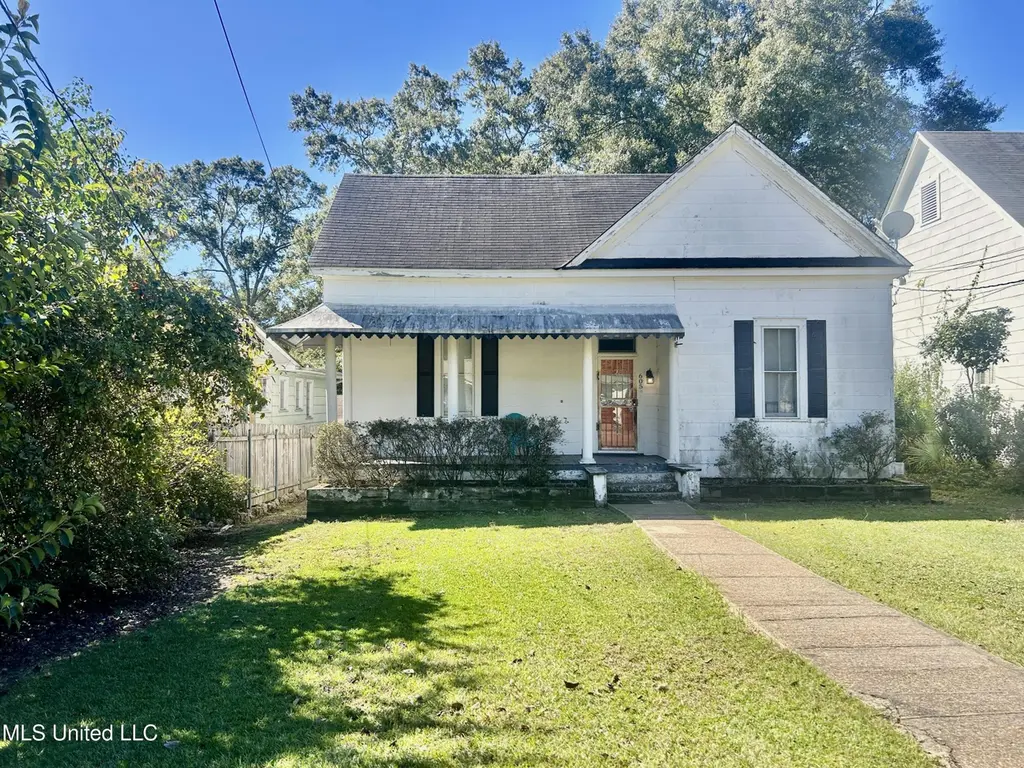
605 Virginia Avenue Ave · McComb, MS
Flood risk 1/10 · Minimal
- FEMA flood zone
- X (unshaded)
- Chance of flooding over 30 yrs
- 0.0%
- Est. flood insurance / yr
- $507 – $1,088
Fire risk 4/10 · Minor
- Est. fire insurance / yr
- $1,241 – $2,305
Heat risk 8/10 · Major
- Hot days now (above 109°F)
- 7 days/yr
- Hot days in 30 yrs
- 20 days/yr
Wind risk 8/10 · Major
- Chance of severe wind over 30 yrs
- 99.0%
Air-quality risk 1/10 · Minimal
- Unhealthy air days now
- 0 days/yr
- Unhealthy air days in 30 yrs
- 0 days/yr
Risk factors via First Street. Map © Google.
Why this score? — see what drove the B grade
The composite is a weighted blend of 9 inputs, each scored 0–100. Each bar is that input's sub-score; the figure is the points it added to the 100-point composite (weight × sub-score).
- Cash flow +30.0/30.0
- ARV discount +15.0/15.0
- DSCR +10.0/10.0
- 1% rule +9.1/10.0
- Livability +3.5/5.0
- Rent growth +2.5/5.0
- Condition / age +2.5/5.0
- Schools +1.2/10.0
- Appreciation +0.0/10.0
$60,000
🖨 Deal sheet 📄 Offer letter ✓ Due diligence
Listing remarks MLS
This 3 bedroom 1 bath home features wood floors and a spacious back yard. Could use a little TLC
Key facts
- 9,583 sq ft lot
- Built 1960
- Listed 227 days
Neighborhood map
What this means for you Summary
Snapshot
- This is a 3-bed/1.0-bath single-family listed at $60k.
Deal economics
- At list price, monthly cash flow is $283 ($3k/yr) — positive.
- The deal already cash-flows at list — no discount required.
- Meets the 1% rule at list price ($846 rent vs $60k).
- Recommended offer: $53k (12.0% below list) — sets the bar for market timing.
- Cap rate 12.0% vs local median 6.5% in McComb — top-decile yield for the area; either an underpriced asset or a hidden risk that comps aren't pricing in. Stress-test before assuming the spread holds.
Location & tenants
- Location reads 69/100 on livability (#50 in MS) — a middle-class / working-renter tenant base. Strengths: cost of living A+, health & safety A+, housing A-; Watch: schools D-, amenities F, commute F.
- Mccomb School District (town): math 15% / reading 16% proficiency, ranked #106 of 130 in MS (top 82%) — low school quality limits family demand, transient renter base, plan for 1-2y turnover; 93% free/reduced lunch — lower-income household profile, screen leases tightly.
- Market conditions: 190 active listings in the ZIP; 3 comparable units currently listed for rent nearby; rentals lingering (median 44d on market — plan ~5-8 weeks vacancy on turnover, expect pricing pressure); 100% of comp listings sitting > 30 days — soft ceiling on asking rent; 10 units permitted in Pike County in 2024 (0 in 5+ unit buildings).
Forward outlook
- Local home prices are declining (-3.0%/yr); year-one equity from $415 of loan paydown is wiped out by about $2k of value loss. Plan a longer hold.
- Pike County population projected at -14% by 2050 — secular population decline; favor cash flow + early exit over multi-decade hold.
- At projected returns (-3.0% appreciation + 3.0% rent growth), your $17k cash investment doubles in ~6 years — after that, you're playing with house money.
Negotiation context
- It's been on market 227 days — a 12% lower offer ($53k) is reasonable based on typical stale-listing flexibility.
- 2 sale attempts since 18y ago with the ask held roughly flat each time — persistent listings suggest the price (not the market) is what's stuck; bring a comps-based counter.
Risks & watch-outs
- Climate carrying-cost: severe wind risk, 99% chance of damaging wind over 30y; extreme-heat days projected 7→20/yr by 2055 (HVAC capex compounding) — expect insurance premiums to compound above CPI over the hold.
Questions for the listing agent
- It's been on market 227 days. Have you received any prior offers? Is the seller open to a 12% concession, seller financing, or rate buy-down credit?
- Built in 1960 — when were the roof, HVAC, electrical panel, plumbing, and water heater last replaced?
- Why hasn't it sold? Are there any deal-killer items the seller is aware of (foundation, flood, title, zoning, code violations)?
- Is there a deadline driving the sale (1031 exchange, divorce, estate, relocation)? That informs how much negotiation room exists.
- Schools are D-rated, which usually means shorter tenancies and higher turnover. Who's the typical renter profile here, and what's been the actual vacancy rate?
- What's the average days-on-market for RENTAL listings here right now (not sales)? A rising rental-DOM trend means longer vacancies and softer asking-rent achievability than the comps imply.
- What's the recent tenant-quality profile in this submarket — average credit score on applications, eviction rate, late-payment / NSF rate, and stable-employment percentage? A property-management company in the area should have these aggregated.
- How much new for-sale + rental construction is in the pipeline within 1–3 miles? Heavy new supply typically softens prices + rents 12–24 months out; constrained supply supports both.
Investment metrics
- 1% rule
- 1.41% ✓
- Cap rate
- 11.95%
- Cash-on-cash
- 20.22%
- DSCR
- 1.90
- GRM
- 5.9
CMA / ARV
- ARV (median comp)
- $78,896
- List price
- $60,000
- Delta
- -23.95%
- Verdict
- UNDERPRICED
- Comps
- 20 within 1.0 mi
Show comp detail 12 sales within ~0.75 mi
| Address | Dist | Beds/Ba | Sqft | Sold | Price | $/sf | Match |
|---|---|---|---|---|---|---|---|
| 407 7th St | 0.18mi | 3/1.0 | 1,323 (+6%) | 4mo | $49,900 | $38 | 78 |
| 215 Peach Ave S | 0.34mi | 3/1.5 | 1,230 (-1%) | 3mo | $129,900 | $106 | 78 |
| 1206 21st St | 0.53mi | 3/1.0 | 1,240 (-0%) | 0mo | $119,950 | $97 | 74 |
| 707 Earl St | 0.41mi | 3/1.0 | 1,290 (+4%) | 2mo | $59,500 | $46 | 73 |
| 319 S 4th St | 0.14mi | 3/2.0 | 1,422 (+14%) | 8mo | $119,900 | $84 | 59 |
| 333 W Georgia Ave | 0.59mi | 2/2.0 (-1) | 1,284 (+3%) | 2mo | $52,000 | $40 | 57 |
| 411 New York Ave | 0.47mi | 3/1.0 | 1,368 (+10%) | 7mo | $95,000 | $69 | 55 |
| 923 Bendat Ave | 0.47mi | 2/1.0 (-1) | 1,184 (-5%) | 13mo | $35,500 | $30 | 55 |
| 211 Shannon Dr | 0.70mi | 3/2.0 | 1,182 (-5%) | 8mo | $125,000 | $106 | 49 |
| 109 11th St | 0.51mi | 3/2.0 | 1,427 (+15%) | 4mo | $98,000 | $69 | 45 |
| 218 Westview Cir | 0.71mi | 3/2.0 | 1,372 (+10%) | 9mo | $140,000 | $102 | 38 |
| 205 Butler St | 0.71mi | 3/2.0 | 1,428 (+15%) | 11mo | $147,500 | $103 | 30 |
Match score weights: distance 35% · size 25% · config 20% · recency 20%. Top-matched comps best support the ARV.
Projected returns pro-forma
-3.0% appreciation · 3.0% rent growth · sell at horizon
- IRR
- 12.4%
- Equity multiple
- 1.49×
- Total profit
- $8,297
- Equity at exit
- $8,946
- IRR
- 21.3%
- Equity multiple
- 2.81×
- Total profit
- $30,413
- Equity at exit
- $5,188
Cash invested: $16,800 (down + closing). Projections, not guarantees.
Landlord ↔ Tenant lean methodology
- Overall (STATE)
- 90 Strongly Landlord-Friendly
- State Mississippi
- 90 Strongly Landlord-Friendly · R+11
- County
- — inherits STATE
- City
- — inherits STATE
ZIP-level market 39648
- Active inventory
- 190
- Price-to-rent
- 5.9×
Monthly cashflow live
- Estimated rent
- $846 medium interval (Pro) →
- Mortgage (P&I)
- −$315
- Tax from tax record
- −$45 /mo · $545/yr
- Insurance
- −$25
- HOA
- −$0
- Vacancy / Maint / Mgmt
- −$178
- Net cashflow
- $283
Break-even live
UW: 25.0% down · 7.5% · 30yr · 1.5% tax · 5.0% vac · 8.0% maint · 8.0% mgmt
Financing live
Cash to close
- Down payment
- $15,000
- Closing costs
- $1,800
- Reserves months
- —
- Total cash needed
- —
Loan-product check · same deal, 3 products live
Conventional
25% down · 7.5% · 30yr
- Down + closing
- —
- Monthly P&I
- —
- Monthly cashflow
- —
- DSCR
- —
- Eligible?
- —
Personal DTI + credit; lowest rate.
DSCR
20% down · 8.5% · 30yr
- Down + closing
- —
- Monthly P&I
- —
- Monthly cashflow
- —
- DSCR
- —
- Eligible?
- —
No personal income docs; deal must DSCR.
Hard money
10% down · 12.0% · 12mo
- Down + closing
- —
- Monthly P&I
- —
- Monthly cashflow
- —
- DSCR
- —
- Eligible?
- —
Short-term bridge; refi at stabilization.
Rent comps 3 comps
| Address | Beds | Baths | Sqft | Rent | $/sqft | DOM | Units | Dist |
|---|---|---|---|---|---|---|---|---|
| 919 25th St McComb, MS | 3.0 | 3.0 | 1107 | $595 | $0.54 | 43d | 1 | 0.83mi |
| 1210 Parklane Rd McComb, MS | 1.0–2.0 | 1.0–2.0 | 844 | $1,171 | $1.39 | 43d | 5 | 1.25mi |
| 1240 Parklane Rd McComb, MS | 1.0–3.0 | 1.0–2.0 | 994 | $999 | $1.01 | 43d | 1 | 1.33mi |
Listing history 19 events
-
2026-06-18days on market $60,000 Active 227 DOM
-
2026-06-17days on market $60,000 Active 226 DOM
-
2026-06-16days on market $60,000 Active 225 DOM
-
2026-06-15days on market $60,000 Active 224 DOM
-
2026-06-13days on market $60,000 Active 222 DOM
-
2026-06-12days on market $60,000 Active 221 DOM
-
2026-06-09days on market $60,000 Active 218 DOM
-
2026-06-08days on market $60,000 Active 217 DOM
-
2026-06-07days on market $60,000 Active 216 DOM
-
2026-06-07days on market $60,000 Active 215 DOM
-
2026-06-04days on market $60,000 Active 212 DOM
-
2026-06-02days on market $60,000 Active 211 DOM
-
2026-06-01days on market $60,000 Active 210 DOM
-
2026-05-31days on market $60,000 Active 209 DOM
-
2026-01-15price $60,000 97-char remark
Show marketing remark (97 chars)
This 3 bedroom 1 bath home features wood floors and a spacious back yard. Could use a little TLC
-
2025-11-03$63,000 Active 97-char remark
Show marketing remark (97 chars)
This 3 bedroom 1 bath home features wood floors and a spacious back yard. Could use a little TLC
-
2008-12-04soldstatus 310-char remark
Show marketing remark (310 chars)
Adorable house located in the middle of the city of McComb. Beautiful hardwood floors, nice, large backyard. Easy access to underneath the house. Nice front porch to enjoy peaceful afternoons sitting on the swing. Call for appointment. This property is currently rented. The rental income is $700.00 per month.
-
2008-12-01soldstatus
-
2008-03-01$82,500 310-char remark
Show marketing remark (310 chars)
Adorable house located in the middle of the city of McComb. Beautiful hardwood floors, nice, large backyard. Easy access to underneath the house. Nice front porch to enjoy peaceful afternoons sitting on the swing. Call for appointment. This property is currently rented. The rental income is $700.00 per month.
ⓘ Source: listings_history table (triggers on properties + properties_extension) + one-shot
backfill from property_details.listing_events for pre-trigger history.
Tax reassessment forecast MS · Resets to sale price
- Current annual tax
- $545 · $45/mo
- Projected year-2 tax
- $545 · $45/mo
- Expected delta
- $0/yr ($0/mo · 0.0%)
ⓘ Screening estimate from a state-policy table — verify with the county assessor before closing.
Climate risk First Street
- Flood 1/10 Low FEMA zone X (unshaded) · 0% chance over 30 yrs
- Wildfire 4/10 Moderate
- Heat 8/10 Severe 7 d/yr ≥109°F today · 20 d/yr by 30 yrs out
- Wind 8/10 Severe 99% chance of damaging wind over 30 yrs
- Air quality 1/10 Low 0 unhealthy d/yr today · 0 by 30 yrs out
Nearby sold comps map
Loading sold comps map…
Walkable amenities ~0.75 mi
Loading nearby amenities…
Taxation est. · year 1
- Rental income
- $10,148
- − Mortgage interest
- −$3,361
- − Property taxes
- −$545
- − Insurance
- −$300
- − Repairs & maintenance
- −$812
- − Management
- −$812
- − Depreciation
- −$1,745
- Taxable income
- $2,573
- Est. tax owed @ 24.0%
- −$617
- After-tax cash flow
- $2,779/yr
For passive investors: Depreciation is non-cash, so a rental often shows a tax loss while cash-flowing — sheltering income. Rental losses are passive: they offset passive income freely, and up to $25,000/yr can offset ordinary (W-2) income if you actively participate and your MAGI is under $100k (phasing out to $0 by $150k); unused losses carry forward. On sale, claimed depreciation is recaptured at up to 25%, and gains may owe capital-gains tax (a 1031 exchange can defer both). Figures are a year-1 estimate at your 24.0% rate — not tax advice; consult a CPA.
Schools (NCES district)
- District
- Mccomb School District
- NCES district ID
- 2802880
- Math proficiency
- 15% ▼ -20.00%
- Reading proficiency
- 16% ▼ -5.00%
- Median HH income
- $29,855
- Composite
- 12.26/100
- National rank
- #9645
- State rank
- #106 of 130 in MS
Livability — McComb
- Score
- 69/100
- State rank
- #50
- US rank
- #8347
Category grades
Schools grade is shown separately in the Schools card above.
Census & demographics
- Census place
- McComb, MS
- Population (ZIP)
- 19,767
Population outlook (Pike County) Hauer SSP2
- Today (2025)
- 38,766 people
- By 2030
- 37,874 · -2.3%
- By 2040
- 35,743 · -7.8%
- By 2050
- 33,276 · -14.2%
- By 2075
- 26,799 · -30.9%
- By 2100
- 18,562 · -52.1%
Race, ethnicity, and origin ACS 2023
- Neighborhood character
- Majority Black (64%)
- Race & ethnicity
- Black 64% White 32% Two or more races 2% Hispanic / Latino 2%
- Common ancestry
- Slovak 2% Lithuanian 1% Italian 1%
- Foreign-born
- 1%
- Languages at home
- 98% English-only · Spanish 1%
Political lean MEDSL · Pike
- 2024 margin
- Toss-up / Even · D 47.8% · R 51.3%
- 2008→2024 swing
- -7.0pp toward R · 2008: 3.5pp · 2024: -3.5pp
- All cycles
- 2024: R+3.5 2020: D+1.0 2016: R+0.7 2012: D+7.6 2008: D+3.5
Not yet ingested
- Civics
- —
Market trends
- HPI YoY
- ▼ -88.61%
- Current HPI
- 92.2495
- Rent YoY
- —
- Metro
- —
- State GDP YoY
- —
- F500 in state
- 0
Price history
-27.3% since first listed5 events — show timeline
- 2026-01-15 Price Changed $60,000 MLSU
- 2025-11-03 Listed $63,000 MLSU
- 2008-12-04 Sold (MLS) — MLSU
- 2008-12-01 Sold (Public Records) — Public Records
- 2008-03-01 Listed $82,500 MLSU
Property tax history
+2.1%/yrLatest (2025): $545 · +14.7% YoY. Source: county tax records.
Cash-flow waterfall
monthlySold comps — $/sqft
last 12 mo · ≤1 miLoading sold comps…