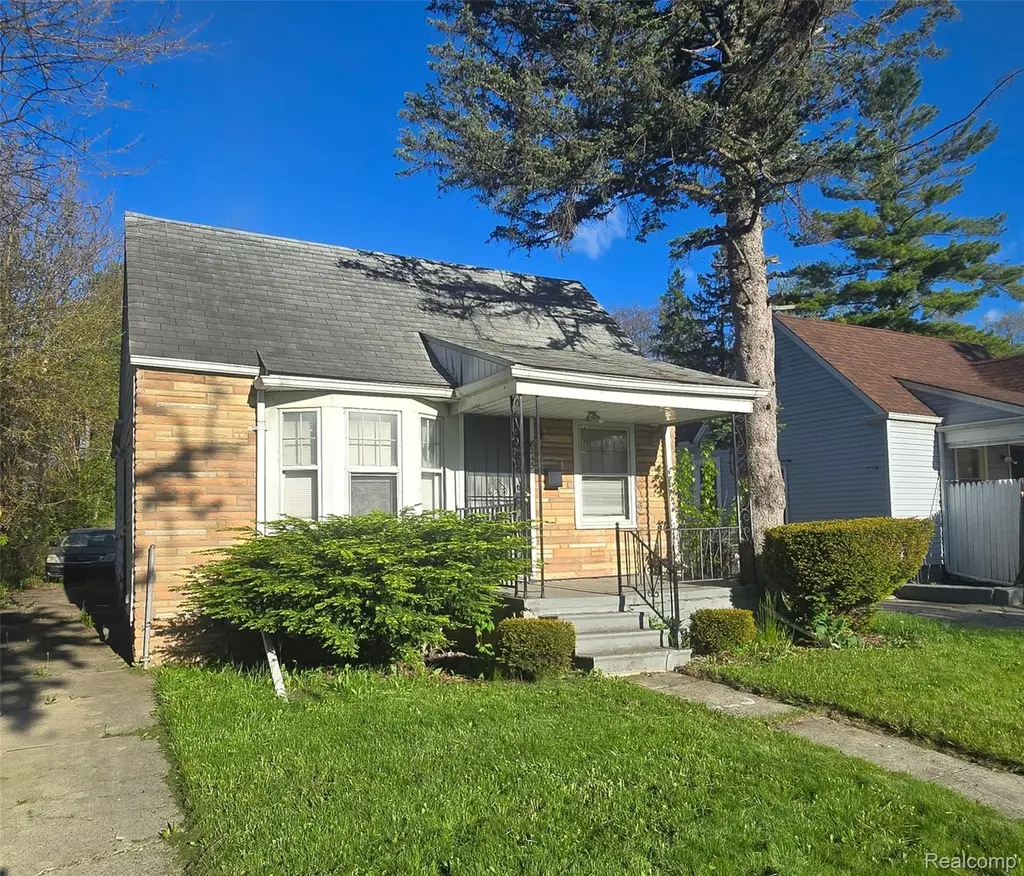
8245 Brace St · Detroit, MI
Flood risk 5/10 · Moderate
- FEMA flood zone
- X (unshaded)
- Chance of flooding over 30 yrs
- 0.48%
- Est. flood insurance / yr
- $473 – $860
Fire risk 1/10 · Minimal
- Est. fire insurance / yr
- $784 – $1,456
Heat risk 3/10 · Minor
- Hot days now (above 97°F)
- 7 days/yr
- Hot days in 30 yrs
- 15 days/yr
Wind risk 2/10 · Minimal
- Chance of severe wind over 30 yrs
- —
Air-quality risk 3/10 · Minor
- Unhealthy air days now
- 2 days/yr
- Unhealthy air days in 30 yrs
- 5 days/yr
Risk factors via First Street. Map © Google.
Why this score? — see what drove the C grade
The composite is a weighted blend of 9 inputs, each scored 0–100. Each bar is that input's sub-score; the figure is the points it added to the 100-point composite (weight × sub-score).
- Cash flow +30.0/30.0
- 1% rule +10.0/10.0
- DSCR +10.0/10.0
- Livability +3.7/5.0
- Condition / age +2.5/5.0
- Rent growth +1.9/5.0
- Schools +1.3/10.0
- ARV discount +0.0/15.0
- Appreciation +0.0/10.0
$60,900
🖨 Deal sheet (PDF) 📄 Offer letter ✓ Due diligence
Listing remarks MLS
CHARMING RANCH HOME LOCATED SOUTH OF JOY AND WEST OF SOUTHFIELD! THIS HOME FEATURES A COVERED FRONT PORCH, INVITING LIVING ROOM, DINING ROOM, THREE BEDROOMS, ONE BATHROOM, AND AN UNFINISHED BASEMENT! THIS WOULD MAKE A GREAT ADDITION TO YOUR INVESTMENT PORTFOLIO! PROPERTY IS SOLD AS-IS. ALL DIMENSIONS ARE ESTIMATED AND SHOULD BE VERIFIED. ALL SHOWINGS REQUIRE A LICENSED AGENT TO BE PRESENT. BUYER TO PAY DETROIT INVESTMENT CO A 295 PROCESSING FEE AT CLOSING.
Key facts
- Covered front porch
- Unfinished basement
- Inviting living room
Tags
Property features AI
Finance
- Other: Lot approximately 0.1 acre (41 x 109); Located in Bonaparte Park; three blocks south of Joy Road, west of Southfield Road
Exterior
- Parking: No garage
- Utilities: Public water; Public sewer; Paved road access
- Home design: Single-family residence; One story; Ground-level entry with steps; Aluminum siding and brick veneer exterior
- Construction: Block foundation
- Exterior features: Covered porch
Interior
- Bathrooms: One full bathroom
- Heating & cooling: Forced air heating (natural gas); No central cooling
- Interior features: Unfinished basement; Six total rooms
Neighborhood map
What this means for you Summary
Snapshot
- This is a 3-bed/1.0-bath single-family listed at $61k.
Deal economics
- At list price, monthly cash flow is $544 ($7k/yr) — positive.
- The deal already cash-flows at list — no discount required.
- Meets the 1% rule at list price ($1k rent vs $61k).
- Recommended offer: $59k (3.0% below list) — sets the bar for market timing.
- Cap rate 17.0% vs local median 10.0% in Detroit — top-decile yield for the area; either an underpriced asset or a hidden risk that comps aren't pricing in. Stress-test before assuming the spread holds.
Location & tenants
- Location reads 73/100 on livability (#218 in MI) — a middle-class / working-renter tenant base. Strengths: amenities A+, commute A+, cost of living A+; Watch: crime F, employment F.
- Detroit Public Schools Community District (urban): math 10% / reading 24% proficiency, ranked #499 of 540 in MI (top 92%) — low school quality limits family demand, transient renter base, plan for 1-2y turnover; 90% free/reduced lunch — lower-income household profile, screen leases tightly.
- Zoned schools: Neinas Dual Language Learning Academy (math 8% / reading 8%, grade F, #1,300 of 1,397 statewide, top 94%, 400 students, 85% FRL); Cody High School (math 24% / reading 24%, grade F, #481 of 713 statewide, top 81%, 466 students, 88% FRL) — zoned schools at 86% FRL track the district average.
- Market conditions: Rents soft (-2.3%/yr); 367 active listings in the ZIP; 38 comparable units currently listed for rent nearby; rentals lingering (median 46d on market — plan ~5-8 weeks vacancy on turnover, expect pricing pressure); 58% of comp listings sitting > 30 days — soft ceiling on asking rent; lower-income renter base — watch delinquency; 2,639 units permitted in Wayne County in 2024 (1,216 in 5+ unit buildings).
Forward outlook
- Local home prices are declining (-3.0%/yr); year-one equity from $421 of loan paydown is wiped out by about $2k of value loss. Plan a longer hold.
- Wayne County population projected at -17% by 2050 — secular population decline; favor cash flow + early exit over multi-decade hold.
- At projected returns (-3.0% appreciation + 0.0% rent growth), your $17k cash investment doubles in ~4 years — after that, you're playing with house money.
Negotiation context
- It's been on market 40 days — a 3% lower offer ($59k) is reasonable based on typical stale-listing flexibility.
- 27 sale attempts since 19y ago with the ask held roughly flat each time — persistent listings suggest the price (not the market) is what's stuck; bring a comps-based counter.
- Current owner paid $14k; list at $61k implies a 335% gain — meaningful room to come down on a strong offer.
Risks & watch-outs
- Watch-outs: built in 1943 — expect roof / HVAC / electrical / plumbing capex.
- Climate carrying-cost: moderate flood risk — expect insurance premiums to compound above CPI over the hold.
Questions for the listing agent
- It's been on market 40 days. Have you received any prior offers? Is the seller open to a 3% concession, seller financing, or rate buy-down credit?
- Built in 1943 — when were the roof, HVAC, electrical panel, plumbing, and water heater last replaced?
- Is there a deadline driving the sale (1031 exchange, divorce, estate, relocation)? That informs how much negotiation room exists.
- Schools are F-rated, which usually means shorter tenancies and higher turnover. Who's the typical renter profile here, and what's been the actual vacancy rate?
- Crime grade is F in this area — have there been break-ins, vandalism, or insurance claims at this property in the last 3 years? What carrier currently insures it and at what premium?
- What's the average days-on-market for RENTAL listings here right now (not sales)? A rising rental-DOM trend means longer vacancies and softer asking-rent achievability than the comps imply.
- What's the recent tenant-quality profile in this submarket — average credit score on applications, eviction rate, late-payment / NSF rate, and stable-employment percentage? A property-management company in the area should have these aggregated.
- How much new for-sale + rental construction is in the pipeline within 1–3 miles? Heavy new supply typically softens prices + rents 12–24 months out; constrained supply supports both.
Investment metrics
- 1% rule
- 2.01% ✓
- Cap rate
- 17.02%
- Cash-on-cash
- 38.30%
- DSCR
- 2.70
- GRM
- 4.2
CMA / ARV
- ARV (median comp)
- $41,566
- List price
- $60,900
- Delta
- 46.51%
- Verdict
- OVERPRICED
- Comps
- 20 within 1.0 mi
Show comp detail 12 sales within ~0.75 mi
| Address | Dist | Beds/Ba | Sqft | Sold | Price | $/sf | Match |
|---|---|---|---|---|---|---|---|
| 8309 Brace St | 0.06mi | 3/1.5 | 864 (0%) | 1mo | $28,500 | $33 | 94 |
| 8686 Artesian St | 0.30mi | 3/1.0 | 864 (0%) | 2mo | $35,000 | $41 | 84 |
| 7756 Westwood St | 0.43mi | 3/1.0 | 871 (+1%) | 2mo | $90,000 | $103 | 77 |
| 8630 Greenview Ave | 0.25mi | 3/1.0 | 924 (+7%) | 3mo | $50,000 | $54 | 74 |
| 8225 Grandville Ave | 0.31mi | 2/1.0 (-1) | 906 (+5%) | 2mo | $36,500 | $40 | 71 |
| 7667 Greenview Ave | 0.35mi | 3/1.0 | 960 (+11%) | 2mo | $65,100 | $68 | 63 |
| 8651 Brace Street St | 0.25mi | 3/1.0 | 987 (+14%) | 2mo | $60,000 | $61 | 63 |
| 8084 Evergreen Ave | 0.60mi | 3/1.0 | 909 (+5%) | 3mo | $77,000 | $85 | 61 |
| 7313 Grandville Ave | 0.63mi | 2/1.0 (-1) | 765 (-12%) | 0mo | $70,000 | $92 | 46 |
| 9221 Grandville Ave | 0.69mi | 3/1.0 | 971 (+12%) | 2mo | $135,000 | $139 | 45 |
| 7296 Auburn St | 0.74mi | 3/1.0 | 968 (+12%) | 2mo | $38,000 | $39 | 44 |
| 7320 Westwood St | 0.64mi | 3/1.0 | 738 (-15%) | 2mo | $115,000 | $156 | 44 |
Match score weights: distance 35% · size 25% · config 20% · recency 20%. Top-matched comps best support the ARV.
Projected returns pro-forma
-3.0% appreciation · 0.0% rent growth · sell at horizon
- IRR
- 31.0%
- Equity multiple
- 2.25×
- Total profit
- $21,235
- Equity at exit
- $9,080
- IRR
- 36.4%
- Equity multiple
- 3.90×
- Total profit
- $49,367
- Equity at exit
- $5,266
Cash invested: $17,052 (down + closing). Projections, not guarantees.
Landlord ↔ Tenant lean methodology
- Overall (STATE)
- 62 Landlord-Friendly
- State Michigan
- 62 Landlord-Friendly · EVEN
- County
- — inherits STATE
- City
- — inherits STATE
ZIP-level market 48228
- Rents YoY
- -2.3%
- Active inventory
- 367
- Price-to-rent
- 4.2×
Monthly cashflow live
- Estimated rent
- $1,222 high interval (Pro) →
- Mortgage (P&I)
- −$319
- Tax est. 1.5%
- −$76 /mo · $914/yr
- Insurance
- −$25
- HOA
- −$0
- Vacancy / Maint / Mgmt
- −$257
- Net cashflow
- $544
Break-even live
Sensitivity live
| Price | -10% $586 | -5% $565 | +0% $544 | +5% $523 | +10% $502 |
|---|---|---|---|---|---|
| Rent | -10% $448 | -5% $496 | +0% $544 | +5% $593 | +10% $641 |
| Rate | -1.0pp $575 | -0.5pp $560 | base $544 | +0.5pp $529 | +1.0pp $512 |
UW: 25.0% down · 7.5% · 30yr · 1.5% tax · 5.0% vac · 8.0% maint · 8.0% mgmt
Financing live
Cash to close
- Down payment
- $15,225
- Closing costs
- $1,827
- Reserves months
- —
- Total cash needed
- —
Loan-product check · same deal, 3 products live
Conventional
25% down · 7.5% · 30yr
- Down + closing
- —
- Monthly P&I
- —
- Monthly cashflow
- —
- DSCR
- —
- Eligible?
- —
Personal DTI + credit; lowest rate.
DSCR
20% down · 8.5% · 30yr
- Down + closing
- —
- Monthly P&I
- —
- Monthly cashflow
- —
- DSCR
- —
- Eligible?
- —
No personal income docs; deal must DSCR.
Hard money
10% down · 12.0% · 12mo
- Down + closing
- —
- Monthly P&I
- —
- Monthly cashflow
- —
- DSCR
- —
- Eligible?
- —
Short-term bridge; refi at stabilization.
Rent comps 38 comps
| Address | Beds | Baths | Sqft | Rent | $/sqft | DOM | Units | Dist |
|---|---|---|---|---|---|---|---|---|
| 8262 Rosemont Ave Detroit, MI | 3.0 | 1.0 | 836 | $1,200 | $1.44 | 7d | 1 | 0.28mi |
| 8451 Rosemont Ave Detroit, MI | 3.0 | 1.0 | 867 | $1,150 | $1.33 | 46d | 1 | 0.29mi |
| 19301 Joy Rd Apt 1 Detroit, MI | 2.0 | 1.0 | 750 | $1,100 | $1.47 | 46d | 1 | 0.43mi |
| 8850 Rosemont Ave Detroit, MI | 3.0 | 1.0 | 933 | $1,100 | $1.18 | 20d | 1 | 0.48mi |
| 9090 Stahelin Ave Detroit, MI | 2.0 | 1.0 | 787 | $1,250 | $1.59 | 46d | 1 | 0.54mi |
| 8283 Vaughan St Detroit, MI | 3.0 | 1.0 | 1058 | $1,294 | $1.22 | 7d | 1 | 0.68mi |
| 7794 Vaughan St Detroit, MI | 3.0 | 1.0 | 1000 | $1,450 | $1.45 | 19d | 1 | 0.69mi |
| 7635 Evergreen Ave Detroit, MI | 3.0 | 1.0 | 690 | $1,350 | $1.96 | 46d | 1 | 0.72mi |
| 9108 Archdale St Detroit, MI | 3.0 | 1.0 | 1000 | $1,300 | $1.30 | 7d | 1 | 0.73mi |
| 20431 Tireman St Detroit, MI | 3.0 | 1.0 | 1020 | $1,350 | $1.32 | 19d | 1 | 0.84mi |
| 18450 W Chicago Detroit, MI | 1.0–2.0 | 1.0 | 687 | $1,117 | $1.62 | 0d | 15 | 0.85mi |
| 19449 W Chicago St Detroit, MI | 3.0 | 1.5 | 950 | $1,500 | $1.58 | 46d | 1 | 0.90mi |
| 7411 Stout St Detroit, MI | 3.0 | 1.0 | 888 | $1,428 | $1.61 | 14d | 1 | 0.92mi |
| 6490 Stahelin Ave Detroit, MI | 3.0 | 1.0 | 960 | $1,299 | $1.35 | 19d | 1 | 0.98mi |
| 6761 Memorial Ave Detroit, MI | 3.0 | 1.0 | 1060 | $1,100 | $1.04 | 26d | 1 | 1.07mi |
| 8270 Trinity St Detroit, MI | 3.0 | 1.0 | 806 | $1,528 | $1.90 | 46d | 1 | 1.15mi |
| 9401 Fielding St Detroit, MI | 2.0 | 1.0 | 1000 | $900 | $0.90 | 46d | 1 | 1.19mi |
| 20529 W Chicago Detroit, MI | 2.0 | 1.0 | 1000 | $900 | $0.90 | 46d | 1 | 1.20mi |
| 9410 Patton St Detroit, MI | 2.0 | 1.0 | 1000 | $900 | $0.90 | 46d | 1 | 1.20mi |
| 20541 W Chicago Detroit, MI | 2.0 | 1.0 | 1000 | $900 | $0.90 | 46d | 1 | 1.20mi |
| 20545 W Chicago Detroit, MI | 2.0 | 1.0 | 1000 | $900 | $0.90 | 46d | 1 | 1.21mi |
| 20547 W Chicago Detroit, MI | 2.0 | 1.0 | 1000 | $900 | $0.90 | 46d | 1 | 1.21mi |
| 9404 Patton St Detroit, MI | 2.0 | 1.0 | 1000 | $900 | $0.90 | 46d | 1 | 1.21mi |
| 20522 W Chicago Detroit, MI | 2.0 | 1.0 | 1000 | $950 | $0.95 | 46d | 1 | 1.21mi |
| 9059 Burt Rd Detroit, MI | 3.0 | 1.0 | 980 | $1,400 | $1.43 | 46d | 1 | 1.22mi |
| 20550 W Chicago Detroit, MI | 2.0 | 1.0 | 1000 | $900 | $0.90 | 46d | 1 | 1.23mi |
| 7419 Rutherford St Detroit, MI | 2.0 | 1.0 | 981 | $1,100 | $1.12 | 0d | 1 | 1.23mi |
| 20619 W Chicago Detroit, MI | 2.0 | 1.0 | 950 | $1,200 | $1.26 | 46d | 1 | 1.24mi |
| 9345 Rutherford St Unit 3 Detroit, MI | 2.0 | 1.0 | 850 | $1,050 | $1.24 | 26d | 1 | 1.33mi |
| 20921 W Chicago Detroit, MI | 2.0 | 1.0 | 1000 | $950 | $0.95 | 46d | 1 | 1.39mi |
| 20935 W Chicago Detroit, MI | 2.0 | 1.0 | 1000 | $900 | $0.90 | 46d | 1 | 1.41mi |
| 9222 Forrer St Detroit, MI | 3.0 | 1.0 | 947 | $1,450 | $1.53 | 19d | 1 | 1.41mi |
| 20937 W Chicago Detroit, MI | 2.0 | 1.0 | 1000 | $950 | $0.95 | 46d | 1 | 1.41mi |
| 9416 Trinity St Detroit, MI | 2.0 | 1.0 | 1000 | $950 | $0.95 | 46d | 1 | 1.41mi |
| 20945 W Chicago Detroit, MI | 2.0 | 1.0 | 1000 | $950 | $0.95 | 46d | 1 | 1.41mi |
| 11704 Greenview Ave Detroit, MI | 4.0 | 1.0 | 1046 | $1,300 | $1.24 | 26d | 1 | 1.43mi |
| 11741 Penrod St Detroit, MI | 3.0 | 1.0 | 1124 | $1,400 | $1.25 | 19d | 1 | 1.48mi |
| 5777 Southfield Fwy Detroit, MI | 2.0 | 1.0–2.0 | 667 | $1,530 | $2.29 | 0d | 7 | 1.49mi |
Listing history 50 events
-
2026-06-21days on market $60,900 Active 40 DOM
-
2026-06-18days on market $60,900 Active 37 DOM
-
2026-06-17days on market $60,900 Active 36 DOM
-
2026-06-15days on market $60,900 Active 34 DOM
-
2026-06-13days on market $60,900 Active 32 DOM
-
2026-06-13pricedays on market $60,900 Active 31 DOM
-
2026-06-09days on market $61,900 Active 28 DOM
-
2026-06-08days on market $61,900 Active 27 DOM
-
2026-06-07days on market $61,900 Active 26 DOM
-
2026-06-04days on market $61,900 Active 23 DOM
-
2026-06-03days on market $61,900 Active 22 DOM
-
2026-06-02days on market $61,900 Active 21 DOM
Show marketing remark (460 chars)
CHARMING RANCH HOME LOCATED SOUTH OF JOY AND WEST OF SOUTHFIELD! THIS HOME FEATURES A COVERED FRONT PORCH, INVITING LIVING ROOM, DINING ROOM, THREE BEDROOMS, ONE BATHROOM, AND AN UNFINISHED BASEMENT! THIS WOULD MAKE A GREAT ADDITION TO YOUR INVESTMENT PORTFOLIO! PROPERTY IS SOLD AS-IS. ALL DIMENSIONS ARE ESTIMATED AND SHOULD BE VERIFIED. ALL SHOWINGS REQUIRE A LICENSED AGENT TO BE PRESENT. BUYER TO PAY DETROIT INVESTMENT CO A 295 PROCESSING FEE AT CLOSING.
-
2026-06-02price $61,900 Active 20 DOM
Show marketing remark (460 chars)
CHARMING RANCH HOME LOCATED SOUTH OF JOY AND WEST OF SOUTHFIELD! THIS HOME FEATURES A COVERED FRONT PORCH, INVITING LIVING ROOM, DINING ROOM, THREE BEDROOMS, ONE BATHROOM, AND AN UNFINISHED BASEMENT! THIS WOULD MAKE A GREAT ADDITION TO YOUR INVESTMENT PORTFOLIO! PROPERTY IS SOLD AS-IS. ALL DIMENSIONS ARE ESTIMATED AND SHOULD BE VERIFIED. ALL SHOWINGS REQUIRE A LICENSED AGENT TO BE PRESENT. BUYER TO PAY DETROIT INVESTMENT CO A 295 PROCESSING FEE AT CLOSING.
-
2026-06-01days on market $62,900 Active 20 DOM
-
2026-05-31days on market $62,900 Active 19 DOM
-
2026-05-12$62,900 Active 460-char remark
Show marketing remark (460 chars)
CHARMING RANCH HOME LOCATED SOUTH OF JOY AND WEST OF SOUTHFIELD! THIS HOME FEATURES A COVERED FRONT PORCH, INVITING LIVING ROOM, DINING ROOM, THREE BEDROOMS, ONE BATHROOM, AND AN UNFINISHED BASEMENT! THIS WOULD MAKE A GREAT ADDITION TO YOUR INVESTMENT PORTFOLIO! PROPERTY IS SOLD AS-IS. ALL DIMENSIONS ARE ESTIMATED AND SHOULD BE VERIFIED. ALL SHOWINGS REQUIRE A LICENSED AGENT TO BE PRESENT. BUYER TO PAY DETROIT INVESTMENT CO A 295 PROCESSING FEE AT CLOSING.
-
2026-04-01historical
-
2026-04-01historical
-
2026-02-26price $69,900
-
2026-02-25price $69,900
-
2026-01-23price $73,400
-
2026-01-22price $73,400
-
2025-12-18$74,400 Active
-
2025-12-18$74,400 Active
-
2025-11-01historical
-
2025-11-01historical
-
2025-10-28price $70,000
-
2025-10-27price $70,000
-
2025-09-30price $72,000
-
2025-09-29price $72,000
-
2025-09-11price $73,000
-
2025-09-10price $73,000
-
2025-07-25$75,000 Active
-
2025-07-25$75,000 Active
-
2024-11-19historical
-
2024-11-19historical
-
2024-09-04$65,900 Active
-
2024-09-04$65,900 Active
-
2024-07-31historical
-
2024-07-30historical
-
2024-07-10status Active
-
2024-07-10status Active
-
2024-05-13status Pending
-
2024-05-13status Pending
-
2024-04-30$65,900 Active
-
2024-04-29$65,900 Active
-
2024-04-10historical
-
2024-04-10historical
-
2024-03-15price $65,900
ⓘ Source: listings_history table (triggers on properties + properties_extension) + one-shot
backfill from property_details.listing_events for pre-trigger history.
Climate risk First Street
- Flood 5/10 Major FEMA zone X (unshaded) · 48% chance over 30 yrs
- Wildfire 1/10 Low
- Heat 3/10 Moderate 7 d/yr ≥97°F today · 15 d/yr by 30 yrs out
- Wind 2/10 Low
- Air quality 3/10 Moderate 2 unhealthy d/yr today · 5 by 30 yrs out
Nearby sold comps map
Loading sold comps map…
Walkable amenities ~0.75 mi
Loading nearby amenities…
Taxation est. · year 1
- Rental income
- $14,661
- − Mortgage interest
- −$3,411
- − Property taxes
- −$914
- − Insurance
- −$304
- − Repairs & maintenance
- −$1,173
- − Management
- −$1,173
- − Depreciation
- −$1,772
- Taxable income
- $5,914
- Est. tax owed @ 24.0%
- −$1,419
- After-tax cash flow
- $5,112/yr
For passive investors: Depreciation is non-cash, so a rental often shows a tax loss while cash-flowing — sheltering income. Rental losses are passive: they offset passive income freely, and up to $25,000/yr can offset ordinary (W-2) income if you actively participate and your MAGI is under $100k (phasing out to $0 by $150k); unused losses carry forward. On sale, claimed depreciation is recaptured at up to 25%, and gains may owe capital-gains tax (a 1031 exchange can defer both). Figures are a year-1 estimate at your 24.0% rate — not tax advice; consult a CPA.
Schools (NCES district)
- District
- Detroit Public Schools Community District
- NCES district ID
- 2601103
- Math proficiency
- 10% ▼ -2.00%
- Reading proficiency
- 24% ▲ 6.00%
- Median HH income
- $25,815
- Composite
- 13.06/100
- National rank
- #9564
- State rank
- #499 of 540 in MI
Livability — Detroit
- Score
- 73/100
- State rank
- #218
- US rank
- #5427
Category grades
Schools grade is shown separately in the Schools card above.
Census & demographics
- Census place
- Detroit, MI
- County
- Wayne County · 1,562,939 people
- City population
- 572,865
- Metro
- Detroit-Warren-Dearborn, MI
- Population (ZIP)
- 50,117
- Household income
- $30,680
- Rent vs Own
- Severe rent burden
- 4144.0
Population outlook (Wayne County) Hauer SSP2
- Today (2025)
- 1,675,273 people
- By 2030
- 1,620,300 · -3.3%
- By 2040
- 1,502,341 · -10.3%
- By 2050
- 1,384,039 · -17.4%
- By 2075
- 1,124,592 · -32.9%
- By 2100
- 881,193 · -47.4%
Race, ethnicity, and origin ACS 2023
- Neighborhood character
- Predominantly Black (71%)
- Race & ethnicity
- Black 71% White 16% Two or more races 7% Hispanic / Latino 6%
- Hispanic origin (detail)
- Mexican 3% Puerto Rican 2%
- Common ancestry
- Arab 2% Romanian 2% Lithuanian 1%
- Foreign-born
- 11% · Canada
- Languages at home
- 82% English-only · Arabic 11% Spanish 5%
Political lean MEDSL · Wayne
- 2024 margin
- Strong D (+29.0) · D 62.7% · R 33.7% · Other 3.6%
- 2008→2024 swing
- -20.5pp toward R · 2008: 49.5pp · 2024: 29.0pp
- All cycles
- 2024: D+29.0 2020: D+38.1 2016: D+37.3 2012: D+46.9 2008: D+49.5
Not yet ingested
- Civics
- —
Market trends
- HPI YoY
- ▼ -160.81%
- Current HPI
- 168.6843
- Rent YoY
- ▼ -2.30%
- Metro
- Detroit-Warren-Dearborn, MI
- State GDP YoY
- ▲ 1.37%
- F500 in state
- 28
Industry mix (Fortune 500 HQ in MI)
| Industry | F500 HQs | Revenue |
|---|---|---|
| Automotive Parts | 3 | $48B |
|
||
| Automotive | 2 | $372B |
|
||
| Chemicals | 1 | $45B |
|
||
| Automotive Retail | 1 | $29B |
|
||
| Healthcare / Medical Devices | 1 | $23B |
|
||
| Automotive Technology | 1 | $20B |
|
||
Price history
+191.4% since first listed68 events — show timeline
- 2026-06-12 Price Changed $60,900 MiRealSource-MiMLS
- 2026-06-11 Price Changed $60,900 REALCOMP
- 2026-06-02 Price Changed $61,900 MiRealSource-MiMLS
- 2026-06-01 Price Changed $61,900 REALCOMP
- 2026-05-12 Listed $62,900 REALCOMP
- 2026-05-12 Listed $62,900 MiRealSource-MiMLS
- 2026-04-01 Listing Removed — MiRealSource-MiMLS
- 2026-04-01 Listing Removed — REALCOMP
- 2026-02-26 Price Changed $69,900 MiRealSource-MiMLS
- 2026-02-25 Price Changed $69,900 REALCOMP
- 2026-01-23 Price Changed $73,400 MiRealSource-MiMLS
- 2026-01-22 Price Changed $73,400 REALCOMP
- 2025-12-18 Listed $74,400 REALCOMP
- 2025-12-18 Listed $74,400 MiRealSource-MiMLS
- 2025-11-01 Listing Removed — REALCOMP
- 2025-11-01 Listing Removed — MiRealSource-MiMLS
- 2025-10-28 Price Changed $70,000 MiRealSource-MiMLS
- 2025-10-27 Price Changed $70,000 REALCOMP
- 2025-09-30 Price Changed $72,000 MiRealSource-MiMLS
- 2025-09-29 Price Changed $72,000 REALCOMP
- 2025-09-11 Price Changed $73,000 MiRealSource-MiMLS
- 2025-09-10 Price Changed $73,000 REALCOMP
- 2025-07-25 Listed $75,000 REALCOMP
- 2025-07-25 Listed $75,000 MiRealSource-MiMLS
- 2024-11-19 Listing Removed — MiRealSource-MiMLS
- 2024-11-19 Listing Removed — REALCOMP
- 2024-09-04 Listed $65,900 MiRealSource-MiMLS
- 2024-09-04 Listed $65,900 REALCOMP
- 2024-07-31 Listing Removed — MiRealSource-MiMLS
- 2024-07-30 Listing Removed — REALCOMP
- 2024-07-10 Relisted — MiRealSource-MiMLS
- 2024-07-10 Relisted — REALCOMP
- 2024-05-13 Pending — MiRealSource-MiMLS
- 2024-05-13 Pending — REALCOMP
- 2024-04-30 Listed $65,900 REALCOMP
- 2024-04-29 Listed $65,900 MiRealSource-MiMLS
- 2024-04-10 Listing Removed — MiRealSource-MiMLS
- 2024-04-10 Listing Removed — REALCOMP
- 2024-03-15 Price Changed $65,900 MiRealSource-MiMLS
- 2024-03-14 Price Changed $65,900 REALCOMP
- 2024-02-08 Listed $69,900 MiRealSource-MiMLS
- 2024-02-08 Listed $69,900 REALCOMP
- 2012-12-31 Listing Removed — REALCOMP
- 2012-12-31 Listing Removed — MiRealSource-MiMLS
- 2012-08-10 Listed $6,000 REALCOMP
- 2012-08-10 Listed $6,000 MiRealSource-MiMLS
- 2012-07-23 Listing Removed — MiRealSource-MiMLS
- 2012-07-23 Listing Removed — REALCOMP
- 2012-01-23 Listed $9,500 MiRealSource-MiMLS
- 2012-01-23 Listed $9,500 REALCOMP
- 2012-01-06 Listing Removed — REALCOMP
- 2012-01-06 Listing Removed — MiRealSource-MiMLS
- 2011-11-18 Listed $29,900 REALCOMP
- 2011-11-18 Listed $29,900 MiRealSource-MiMLS
- 2007-08-17 Sold (MLS) $14,000 REALCOMP
- 2007-07-01 Listing Removed — REALCOMP
- 2007-07-01 Listing Removed — MiRealSource-MiMLS
- 2007-05-01 Listing Removed — REALCOMP
- 2007-05-01 Listing Removed — MiRealSource-MiMLS
- 2007-05-01 Listed $19,900 REALCOMP
- 2007-05-01 Listed $19,900 MiRealSource-MiMLS
- 2007-04-30 Listing Removed — MiRealSource-MiMLS
- 2007-04-30 Listing Removed — REALCOMP
- 2007-02-28 Listed $19,900 REALCOMP
- 2007-01-29 Listed $20,900 MiRealSource-MiMLS
- 2007-01-29 Listed $20,900 REALCOMP
- 2007-01-29 Listed $20,900 REALCOMP
- 2007-01-29 Listed $20,900 MiRealSource-MiMLS
Property tax history
+13.0%/yrLatest (2025): $5,071 · +0.5% YoY. Source: county tax records.
Cash-flow waterfall
monthlySold comps — $/sqft
last 12 mo · ≤1 miLoading sold comps…