 Triplex
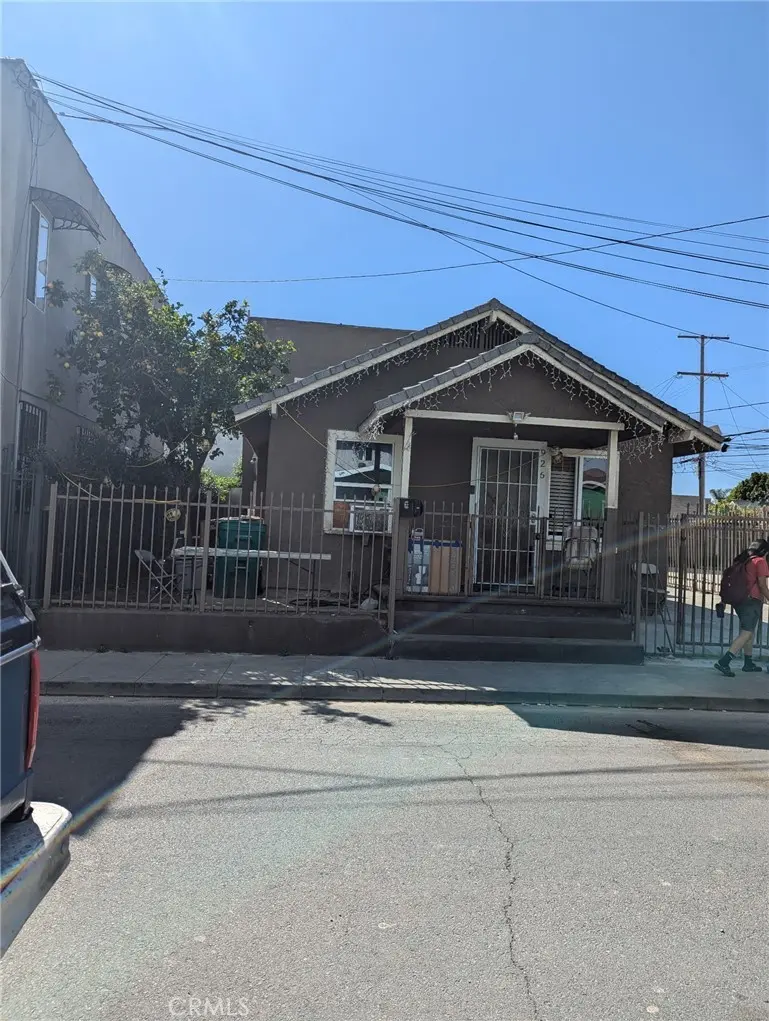
926 E 11th · Long Beach, CA
Flood risk 1/10 · Minimal
- FEMA flood zone
- X (unshaded)
- Chance of flooding over 30 yrs
- 0.0%
- Est. flood insurance / yr
- $507 – $1,088
Fire risk 1/10 · Minimal
- Est. fire insurance / yr
- $659 – $1,223
Heat risk 4/10 · Minor
- Hot days now (above 88°F)
- 7 days/yr
- Hot days in 30 yrs
- 23 days/yr
Wind risk 1/10 · Minimal
- Chance of severe wind over 30 yrs
- —
Air-quality risk 6/10 · Moderate
- Unhealthy air days now
- 9 days/yr
- Unhealthy air days in 30 yrs
- 10 days/yr
Risk factors via First Street. Map © Google.
Why this score? — see what drove the D grade
The composite is a weighted blend of 9 inputs, each scored 0–100. Each bar is that input's sub-score; the figure is the points it added to the 100-point composite (weight × sub-score).
- Cash flow +19.5/30.0
- DSCR +6.2/10.0
- 1% rule +4.7/10.0
- Schools +3.7/10.0
- Livability +3.4/5.0
- Condition / age +2.5/5.0
- Rent growth +2.4/5.0
- ARV discount +0.0/15.0
- Appreciation +0.0/10.0
$890,000
🖨 Deal sheet 📄 Offer letter ✓ Due diligence
Multi-family units
County records classify this as Multi-Family (2-4 Unit). Listing-text estimate: 3 units. confirmed
Listing remarks MLS
This Triplex property is Centrally located within minutes to downtown long beach easy access to 405 & 710 freeways completed major renovation on this property with foundation, electrical, plumbing, gas line, Granite counter tops, backsplash in kitchen window covering heating units. It's a cozy cottage style with Separate gas and electric meters. Front unit is a 2 bed/2 bath inside laundry recessed lights ceiling. 926 1/2 E. 11th: Downstairs back unit is 1 bed/1 bath, 928 E. 11th: Upstairs back unit is 1 bed/1 bath fully remodeled. landscape, fruit trees, floor lighting throughout!
Key facts
- Fully remodeled
- Centrally located
- Major renovation
Tags
Neighborhood map
What this means for you Summary
Snapshot
- This is a 3 × 4-bed/4.0-bath units multifamily listed at $890k.
Deal economics
- At list price, monthly cash flow is $1k ($12k/yr) — positive. Per door: $336/mo.
- The deal already cash-flows at list — no discount required.
- To meet the 1% rule (rent ≥ 1% of price), the offer needs to be $860k (3.4% below list).
- Recommended offer: $810k (9.0% below list) — sets the bar for market timing.
- Cap rate 7.7% vs local median 1.9% in Long Beach — top-decile yield for the area; either an underpriced asset or a hidden risk that comps aren't pricing in. Stress-test before assuming the spread holds.
Location & tenants
- Location reads 67/100 on livability (#319 in CA) — a middle-class / working-renter tenant base. Strengths: amenities A+, commute A+, employment B+; Watch: health & safety C-, crime F, cost of living F.
- Long Beach Unified (urban): math 34% / reading 50% proficiency, ranked #216 of 517 in CA (top 42%) — families likely to look elsewhere, expect single-tenant / working-renter base with shorter leases.
- Market conditions: Rents soft (-0.3%/yr); 82 active listings in the ZIP; 40 comparable units currently listed for rent nearby; rentals at typical pace (median 24d on market — plan ~3-4 weeks tenant-placement turnaround); 19,697 units permitted in Los Angeles County in 2024 (9,426 in 5+ unit buildings).
- At $8,596/mo this rent would consume 189% of the median local household income ($55k/yr) (locally 4941% of renters already pay >50% of income on rent) — very limited rent-growth headroom before tenants either downsize or default.
Forward outlook
- Local home prices are declining (-3.0%/yr); year-one equity from $6k of loan paydown is wiped out by about $27k of value loss. Plan a longer hold.
- Los Angeles County population projected at +9% by 2050 — modest demand growth; plan on rents tracking national, not racing it.
Negotiation context
- It's been on market 104 days — a 9% lower offer ($810k) is reasonable based on typical stale-listing flexibility.
- 12 sale attempts since 16y ago with the ask held roughly flat each time — persistent listings suggest the price (not the market) is what's stuck; bring a comps-based counter.
- Current owner paid $579k; list at $890k implies a 54% gain — meaningful room to come down on a strong offer.
Risks & watch-outs
- Watch-outs: built in 1922 — expect roof / HVAC / electrical / plumbing capex.
Questions for the listing agent
- It's been on market 104 days. Have you received any prior offers? Is the seller open to a 9% concession, seller financing, or rate buy-down credit?
- Can we see the unit-by-unit rent roll, current vacancy, and any below-market leases? What's the average tenancy length?
- What capital expenditures (roof, boiler, parking lot, exteriors) have been made in the last 5 years, and what's planned in the next 2?
- Built in 1922 — when were the roof, HVAC, electrical panel, plumbing, and water heater last replaced?
- Why hasn't it sold? Are there any deal-killer items the seller is aware of (foundation, flood, title, zoning, code violations)?
- Is there a deadline driving the sale (1031 exchange, divorce, estate, relocation)? That informs how much negotiation room exists.
- Crime grade is F in this area — have there been break-ins, vandalism, or insurance claims at this property in the last 3 years? What carrier currently insures it and at what premium?
- The area grade is low — what's the realistic commute time and amenity access for the typical tenant pool here? Any planned neighborhood developments (good or bad) we should know about?
- What's the average days-on-market for RENTAL listings here right now (not sales)? A rising rental-DOM trend means longer vacancies and softer asking-rent achievability than the comps imply.
- What's the recent tenant-quality profile in this submarket — average credit score on applications, eviction rate, late-payment / NSF rate, and stable-employment percentage? A property-management company in the area should have these aggregated.
- How much new apartment / multifamily construction is in the pipeline within 1–3 miles? Heavy new supply (>2% of stock underway) typically softens rents 12–24 months out; light construction supports rent growth.
Investment metrics
- 1% rule
- 0.97% ✗
- Cap rate
- 7.65%
- Cash-on-cash
- 4.86%
- DSCR
- 1.22
- GRM
- 8.6
CMA / ARV
- ARV (median comp)
- $697,213
- List price
- $890,000
- Delta
- 27.65%
- Verdict
- OVERPRICED
- Comps
- 20 within 1.0 mi
Projected returns pro-forma
-3.0% appreciation · 0.0% rent growth · sell at horizon
- IRR
- -12.0%
- Equity multiple
- 0.58×
- Total profit
- $-105,238
- Equity at exit
- $132,702
- IRR
- -7.8%
- Equity multiple
- 0.57×
- Total profit
- $-106,632
- Equity at exit
- $76,951
Cash invested: $249,200 (down + closing). Projections, not guarantees.
Landlord ↔ Tenant lean methodology
- Overall (STATE)
- 18 Strongly Tenant-Friendly
- State California
- 18 Strongly Tenant-Friendly · D+13
- County
- — inherits STATE
- City
- — inherits STATE
ZIP-level market 90813
- Rents YoY
- -0.3%
- Active inventory
- 82
- Price-to-rent
- 25.9×
Monthly cashflow live
- Estimated rent
- $8,596 high interval (Pro) →
- Mortgage (P&I)
- −$4,667
- Tax from tax record
- −$744 /mo · $8,924/yr
- Insurance
- −$371
- HOA
- −$0
- Vacancy / Maint / Mgmt
- −$1,805
- Net cashflow
- $1,009
Break-even live
3-unit breakdown (identical units grouped — click to expand)
| Units | Beds | Baths | Est. rent |
|---|---|---|---|
| 3× units | 4 | 4 | $8,595 |
| #1 | 4 | 4 | $2,865 |
| #2 | 4 | 4 | $2,865 |
| #3 | 4 | 4 | $2,865 |
| Total (3 units) | $8,596 | ||
UW: 25.0% down · 7.5% · 30yr · 1.5% tax · 5.0% vac · 8.0% maint · 8.0% mgmt
Financing live
Cash to close
- Down payment
- $222,500
- Closing costs
- $26,700
- Reserves months
- —
- Total cash needed
- —
Loan-product check · same deal, 3 products live
Conventional
25% down · 7.5% · 30yr
- Down + closing
- —
- Monthly P&I
- —
- Monthly cashflow
- —
- DSCR
- —
- Eligible?
- —
Personal DTI + credit; lowest rate.
DSCR
20% down · 8.5% · 30yr
- Down + closing
- —
- Monthly P&I
- —
- Monthly cashflow
- —
- DSCR
- —
- Eligible?
- —
No personal income docs; deal must DSCR.
Hard money
10% down · 12.0% · 12mo
- Down + closing
- —
- Monthly P&I
- —
- Monthly cashflow
- —
- DSCR
- —
- Eligible?
- —
Short-term bridge; refi at stabilization.
Rent comps 40 comps
| Address | Beds | Baths | Sqft | Rent | $/sqft | DOM | Units | Dist |
|---|---|---|---|---|---|---|---|---|
| 1022 Martin Luther King Junior Ave Unit 1024A Martin Luther King Jr Long Beach, CA | 2.0 | 1.0 | 696 | $1,950 | $2.80 | 21d | 1 | 0.11mi |
| 1128 E 12th St Apt 6 Long Beach, CA | 2.0 | 1.0 | 700 | $1,950 | $2.79 | 5d | 1 | 0.12mi |
| 1071 Olive Ave Unit 5 Long Beach, CA | 2.0 | 1.0 | 587 | $1,995 | $3.40 | 5d | 1 | 0.13mi |
| 1088 Alamitos Ave Unit G Long Beach, CA | 1.0 | 1.0 | 550 | $1,550 | $2.82 | 24d | 1 | 0.16mi |
| 936 N Washington Pl Long Beach, CA | 2.0 | 2.0 | 725 | $2,200 | $3.03 | 43d | 1 | 0.17mi |
| 920 N Washington Pl Unit 2 Long Beach, CA | 1.0 | 1.0 | 650 | $1,695 | $2.61 | 24d | 1 | 0.19mi |
| 935 Alamitos Ave Unit 935 Long Beach, CA | 1.0 | 1.0 | 400 | $1,450 | $3.62 | 43d | 1 | 0.19mi |
| 920 Martin Luther King Junior Ave Long Beach, CA | 2.0 | 1.5 | 695 | $2,295 | $3.30 | 24d | 1 | 0.20mi |
| 921 Alamitos Ave Unit 15 Long Beach, CA | 2.0 | 1.0 | 711 | $1,995 | $2.81 | 43d | 1 | 0.20mi |
| 1423 Martin Luther King Junior Ave Unit 3 Long Beach, CA | 2.0 | 1.0 | 650 | $1,950 | $3.00 | 24d | 1 | 0.20mi |
| 919 Alamitos Ave Apt 8 Long Beach, CA | 2.0 | 1.0 | 750 | $1,995 | $2.66 | 5d | 1 | 0.20mi |
| 908 Martin Luther King Junior Ave Apt 4 Long Beach, CA | 1.0 | 1.0 | 350 | $1,595 | $4.56 | 1d | 1 | 0.21mi |
| 905 Alamitos Ave Unit 911 Long Beach, CA | 1.0 | 1.0 | 475 | $1,425 | $3.00 | 12d | 1 | 0.22mi |
| 642 E 10th St Long Beach, CA | 1.0 | 1.0 | 720 | $1,950 | $2.71 | 18d | 1 | 0.22mi |
| 1388 Martin Luther King Junior Ave Unit 4 Long Beach, CA | 1.0 | 1.0 | 560 | $1,650 | $2.95 | 43d | 1 | 0.23mi |
| 904 Alamitos Ave Long Beach, CA | 1.0 | 1.0 | 585 | $1,750 | $2.99 | 5d | 1 | 0.23mi |
| 900 Alamitos Ave Long Beach, CA | 2.0 | 1.0 | 700 | $2,095 | $2.99 | 12d | 1 | 0.24mi |
| 842 Alamitos Ave Unit 06 Long Beach, CA | 1.0 | 1.0 | 450 | $1,450 | $3.22 | 12d | 1 | 0.25mi |
| 842 Alamitos Ave Unit 03 Long Beach, CA | 1.0 | 1.0 | 450 | $1,550 | $3.44 | 12d | 1 | 0.25mi |
| 1095 Orange Ave Unit 2 Long Beach, CA | 1.0 | 1.0 | 600 | $1,599 | $2.67 | 5d | 1 | 0.26mi |
| 1095 Orange Ave Unit 1 Long Beach, CA | 1.0 | 1.0 | 600 | $1,650 | $2.75 | 43d | 1 | 0.26mi |
| 847 Cerritos Ave Long Beach, CA | 1.0 | 1.0 | 500 | $1,395 | $2.79 | 43d | 1 | 0.27mi |
| 1168 E 10th St Unit 224B Long Beach, CA | 2.0 | 2.0 | 694 | $2,295 | $3.31 | 43d | 1 | 0.27mi |
| 533 E 11th St Unit 06 Long Beach, CA | 2.0 | 2.0 | 620 | $2,095 | $3.38 | 24d | 1 | 0.29mi |
| 1028 Orange Ave Unit 12 Long Beach, CA | 1.0 | 1.0 | 600 | $1,800 | $3.00 | 43d | 1 | 0.30mi |
| 1020 Orange Ave Long Beach, CA | 1.0 | 1.0 | 700 | $1,800 | $2.57 | 43d | 1 | 0.31mi |
| 1010 Orange Ave Long Beach, CA | 1.0–2.0 | 1.0 | 707 | $1,800 | $2.54 | 1d | 1 | 0.31mi |
| 1118 N Norman Ct Unit 1118 Long Beach, CA | 2.0 | 1.0 | 480 | $2,100 | $4.38 | 43d | 1 | 0.32mi |
| 753 N Washington Pl Unit 836 Long Beach, CA | 1.0 | 1.0 | 500 | $1,700 | $3.40 | 16d | 1 | 0.32mi |
| 854 Orange Ave Long Beach, CA | 2.0 | 2.0 | 700 | $2,550 | $3.64 | 24d | 1 | 0.36mi |
| 1100 Elm Ave Long Beach, CA | 1.0 | 1.0 | 559 | $1,495 | $2.67 | 5d | 4 | 0.39mi |
| 721 E 7th St Apt 212 Long Beach, CA | 1.0 | 1.0 | 650 | $1,599 | $2.46 | 43d | 1 | 0.39mi |
| 1483 Atlantic Ave Unit 4 Long Beach, CA | 1.0 | 1.0 | 723 | $1,830 | $2.53 | 5d | 1 | 0.40mi |
| 1467 Orange Ave Long Beach, CA | 1.0 | 1.0 | 600 | $2,100 | $3.50 | 43d | 1 | 0.41mi |
| 1409 N Warren Ave Unit 1415 Long Beach, CA | 1.0 | 1.0 | 525 | $1,595 | $3.04 | 24d | 1 | 0.41mi |
| 1085 Hoffman Ave Unit 10 Long Beach, CA | 1.0 | 1.0 | 456 | $1,650 | $3.62 | 12d | 1 | 0.41mi |
| 1085 Hoffman Ave Unit 15 Long Beach, CA | 1.0 | 1.0 | 450 | $1,650 | $3.67 | 43d | 1 | 0.41mi |
| 800 Linden Ave Long Beach, CA | 1.0 | 1.0 | 588 | $1,715 | $2.92 | 24d | 1 | 0.41mi |
| 800 Linden Ave Long Beach, CA | 1.0 | 1.0 | 588 | $1,595 | $2.71 | 44d | 1 | 0.41mi |
| 1033 Hoffman Ave Unit 5 Long Beach, CA | 1.0 | 1.0 | 650 | $1,591 | $2.45 | 24d | 1 | 0.42mi |
Listing history 50 events
-
2026-06-18days on market $890,000 Active 104 DOM
-
2026-06-17days on market $890,000 Active 103 DOM
-
2026-06-16days on market $890,000 Active 102 DOM
-
2026-06-15days on market $890,000 Active 101 DOM
-
2026-06-13days on market $890,000 Active 99 DOM
-
2026-06-13days on market $890,000 Active 98 DOM
-
2026-06-09days on market $890,000 Active 95 DOM
-
2026-06-08days on market $890,000 Active 94 DOM
-
2026-06-07days on market $890,000 Active 93 DOM
-
2026-06-04days on market $890,000 Active 90 DOM
-
2026-06-03days on market $890,000 Active 89 DOM
-
2026-06-02days on market $890,000 Active 88 DOM
-
2026-06-01days on market $890,000 Active 87 DOM
-
2026-05-31days on market $890,000 Active 86 DOM
-
2026-03-06$890,000 Active 593-char remark
Show marketing remark (593 chars)
This Triplex property is Centrally located within minutes to downtown long beach easy access to 405 & 710 freeways completed major renovation on this property with foundation, electrical, plumbing, gas line, Granite counter tops, backsplash in kitchen window covering heating units. It's a cozy cottage style with Separate gas and electric meters. Front unit is a 2 bed/2 bath inside laundry recessed lights ceiling. 926 1/2 E. 11th: Downstairs back unit is 1 bed/1 bath, 928 E. 11th: Upstairs back unit is 1 bed/1 bath fully remodeled. landscape, fruit trees, floor lighting throughout!
-
2024-08-27historical $2,400
-
2024-05-29price $2,400
-
2024-04-23$2,200
-
2022-10-28historical
-
2022-07-13price $849,900
-
2022-06-02price $859,000
-
2022-05-22status Active
-
2022-04-30$878,500 Active
-
2022-04-29historical
-
2022-04-29historical
-
2022-04-29historical
-
2022-03-08$879,900 Active
-
2022-03-08$879,900 Active
-
2021-10-09historical
-
2021-04-06price $899,000
-
2021-03-20price $949,000
-
2021-03-14$999,000 Active
-
2017-07-14soldstatus $579,000
-
2017-07-13soldstatus $579,000
-
2017-07-13soldstatus $579,000 Closed Sale
-
2017-06-11historical Active Under Contract
-
2017-05-26$589,000 Active
-
2017-05-25$589,000
-
2016-02-17soldstatus $260,000
-
2016-01-12soldstatus $150,000
-
2015-11-25historical Cancelled
-
2015-11-25historical
-
2015-01-15Active
-
2015-01-14$260,000
-
2010-05-04historical
-
2010-05-03$160,000 Active
-
1998-06-02soldstatus $137,000
-
1997-11-13soldstatus $70,000
-
1997-06-27soldstatus $43,000
-
1995-03-17soldstatus $87,000
ⓘ Source: listings_history table (triggers on properties + properties_extension) + one-shot
backfill from property_details.listing_events for pre-trigger history.
Tax reassessment forecast CA · Resets to sale price
- Current annual tax
- $8,924 · $744/mo
- Projected year-2 tax
- $8,924 · $744/mo
- Expected delta
- $0/yr ($0/mo · 0.0%)
ⓘ Screening estimate from a state-policy table — verify with the county assessor before closing.
Climate risk First Street
- Flood 1/10 Low FEMA zone X (unshaded) · 0% chance over 30 yrs
- Wildfire 1/10 Low
- Heat 4/10 Moderate 7 d/yr ≥88°F today · 23 d/yr by 30 yrs out
- Wind 1/10 Low
- Air quality 6/10 Major 9 unhealthy d/yr today · 10 by 30 yrs out
Nearby sold comps map
Loading sold comps map…
Walkable amenities ~0.75 mi
Loading nearby amenities…
Taxation est. · year 1
- Rental income
- $103,152
- − Mortgage interest
- −$49,854
- − Property taxes
- −$8,924
- − Insurance
- −$4,450
- − Repairs & maintenance
- −$8,252
- − Management
- −$8,252
- − Depreciation
- −$25,891
- Taxable loss
- −$2,471
- Est. tax savings @ 24.0%
- +$593
- After-tax cash flow
- $12,702/yr
For passive investors: Depreciation is non-cash, so a rental often shows a tax loss while cash-flowing — sheltering income. Rental losses are passive: they offset passive income freely, and up to $25,000/yr can offset ordinary (W-2) income if you actively participate and your MAGI is under $100k (phasing out to $0 by $150k); unused losses carry forward. On sale, claimed depreciation is recaptured at up to 25%, and gains may owe capital-gains tax (a 1031 exchange can defer both). Figures are a year-1 estimate at your 24.0% rate — not tax advice; consult a CPA.
Schools (NCES district)
- District
- Long Beach Unified
- NCES district ID
- 0622500
- Math proficiency
- 34% ▼ -11.00%
- Reading proficiency
- 50% ▼ -4.00%
- Median HH income
- $56,092
- Composite
- 36.67/100
- National rank
- #4607
- State rank
- #216 of 517 in CA
Livability — Long Beach
- Score
- 67/100
- State rank
- #319
- US rank
- #10758
Category grades
Schools grade is shown separately in the Schools card above.
Census & demographics
- Census place
- Long Beach, CA
- County
- Los Angeles County · 9,444,647 people
- City population
- 466,088
- Metro
- Los Angeles-Long Beach-Anaheim, CA
- Population (ZIP)
- 51,241
- Household income
- $54,526
- Rent vs Own
- Severe rent burden
- 4941.0
Population outlook (Los Angeles County) Hauer SSP2
- Today (2025)
- 10,940,515 people
- By 2030
- 11,256,481 · +2.9%
- By 2040
- 11,729,929 · +7.2%
- By 2050
- 11,948,407 · +9.2%
- By 2075
- 11,818,114 · +8.0%
- By 2100
- 10,842,928 · -0.9%
Race, ethnicity, and origin ACS 2023
- Neighborhood character
- Diverse neighborhood (Simpson 0.55)
- Race & ethnicity
- Hispanic / Latino 64% Two or more races 13% Asian 12% Black 11% White 9% Native American 2%
- Hispanic origin (detail)
- Mexican 53%
- Common ancestry
- Lithuanian 1% Serbian 1%
- Foreign-born
- 36% · Canada, South Korea, Vietnam
- Languages at home
- 33% English-only · Spanish 56% Other Asian/Pacific 6% Tagalog/Filipino 1%
Political lean MEDSL · Los Angeles
- 2024 margin
- Solid D (+32.9) · D 64.8% · R 31.9% · Other 3.3%
- 2008→2024 swing
- -7.4pp toward R · 2008: 40.4pp · 2024: 32.9pp
- All cycles
- 2024: D+32.9 2020: D+44.2 2016: D+48.0 2012: D+40.0 2008: D+40.4
Not yet ingested
- Civics
- —
Market trends
- HPI YoY
- ▼ -468.88%
- Current HPI
- 480.8118
- Rent YoY
- ▼ -0.34%
- Metro
- Los Angeles-Long Beach-Anaheim, CA
- State GDP YoY
- ▲ 3.21%
- F500 in state
- 116
Industry mix (Fortune 500 HQ in CA)
| Industry | F500 HQs | Revenue |
|---|---|---|
| Technology | 27 | $1,492B |
|
||
| Financial Services | 3 | $174B |
|
||
| Retail | 3 | $44B |
|
||
| Insurance | 3 | $26B |
|
||
| Media / Entertainment | 2 | $115B |
|
||
| Pharmaceuticals / Biotech | 2 | $62B |
|
||
Price history
+584.6% since first listed39 events — show timeline
- 2026-03-06 Listed $890,000 CRMLS
- 2024-08-27 Rental Removed $2,400 CRMLS
- 2024-05-29 Price Changed $2,400 CRMLS
- 2024-04-23 Listed for Rent $2,200 CRMLS
- 2022-10-28 Listing Removed — CRMLS
- 2022-07-13 Price Changed $849,900 CRMLS
- 2022-06-02 Price Changed $859,000 CRMLS
- 2022-05-22 Relisted — CRMLS
- 2022-04-30 Listed $878,500 CRMLS
- 2022-04-29 Listing Removed — CRMLS
- 2022-04-29 Listing Removed — CRMLS
- 2022-04-29 Listing Removed — CRMLS
- 2022-03-08 Listed $879,900 CRMLS
- 2022-03-08 Listed $879,900 CRMLS
- 2021-10-09 Listing Removed — CRMLS
- 2021-04-06 Price Changed $899,000 CRMLS
- 2021-03-20 Price Changed $949,000 CRMLS
- 2021-03-14 Listed $999,000 CRMLS
- 2017-07-14 Sold (Public Records) $579,000 Public Records
- 2017-07-13 Sold (MLS) $579,000 CRMLS
- 2017-07-13 Sold (MLS) $579,000 SDMLS
- 2017-06-11 Contingent — CRMLS
- 2017-05-26 Listed $589,000 CRMLS
- 2017-05-25 Listed $589,000 SDMLS
- 2016-02-17 Sold (Public Records) $260,000 Public Records
- 2016-01-12 Sold (Public Records) $150,000 Public Records
- 2015-11-25 Listing Removed — SDMLS
- 2015-11-25 Delisted — TheMLS
- 2015-01-15 Listed — TheMLS
- 2015-01-14 Listed $260,000 SDMLS
- 2010-05-04 Listing Removed — CRMLS
- 2010-05-03 Listed $160,000 CRMLS
- 1998-06-02 Sold (Public Records) $137,000 Public Records
- 1997-11-13 Sold (Public Records) $70,000 Public Records
- 1997-06-27 Sold (Public Records) $43,000 Public Records
- 1995-03-17 Sold (Public Records) $87,000 Public Records
- 1988-12-01 Sold (Public Records) $130,000 Public Records
- 1988-12-01 Sold (Public Records) $130,000 Public Records
- 1988-12-01 Sold (Public Records) $130,000 Public Records
Property tax history
+9.0%/yrLatest (2025): $8,924 · +4.4% YoY. Source: county tax records.
Cash-flow waterfall
monthlySold comps — $/sqft
last 12 mo · ≤1 miLoading sold comps…