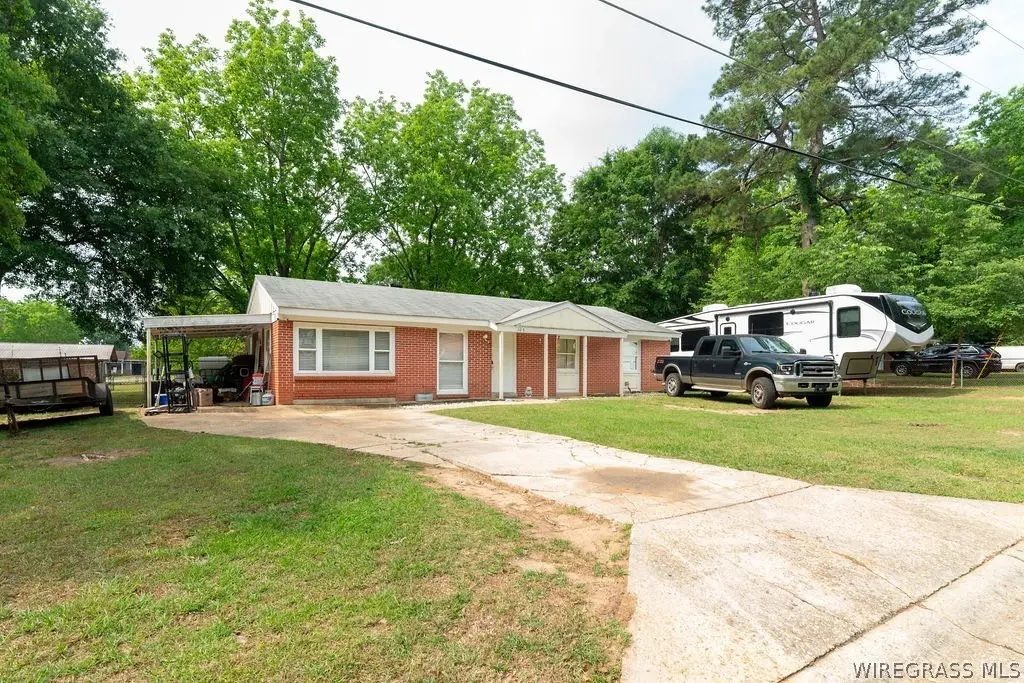
107 Deerfield Dr · Enterprise, AL
Flood risk 1/10 · Minimal
- FEMA flood zone
- X (unshaded)
- Chance of flooding over 30 yrs
- 0.0%
- Est. flood insurance / yr
- $507 – $1,088
Fire risk 3/10 · Minor
- Est. fire insurance / yr
- $916 – $1,700
Heat risk 8/10 · Major
- Hot days now (above 106°F)
- 7 days/yr
- Hot days in 30 yrs
- 19 days/yr
Wind risk 8/10 · Major
- Chance of severe wind over 30 yrs
- 99.0%
Air-quality risk 2/10 · Minimal
- Unhealthy air days now
- 0 days/yr
- Unhealthy air days in 30 yrs
- 1 days/yr
Risk factors via First Street. Map © Google.
Why this score? — see what drove the B grade
The composite is a weighted blend of 9 inputs, each scored 0–100. Each bar is that input's sub-score; the figure is the points it added to the 100-point composite (weight × sub-score).
- Cash flow +27.1/30.0
- ARV discount +15.0/15.0
- DSCR +9.4/10.0
- 1% rule +6.2/10.0
- Schools +4.3/10.0
- Rent growth +3.5/5.0
- Livability +3.2/5.0
- Condition / age +2.5/5.0
- Appreciation +0.0/10.0
$130,000
🖨 Deal sheet 📄 Offer letter ✓ Due diligence
Listing remarks
* * Investor Opportunity! * * Here's a 3-bedroom home situated in the heart of Enterprise, just minutes from the Fort Rucker Gate. With 1550 square feet of living space, this property includes a half bath in the primary bedroom and an additional bonus/family room. Enjoy a spacious, fenced-in backyard (. 34 Acres), carport, and a large covered patio, perfect for outdoor living. This home boasts a strong rental history and is competitively priced for an incredible opportunity. Property is sold AS-IS. Don’t miss out!
Key facts
- Bonus family room
- Large covered patio
- Fenced-in backyard
Tags
Property features AI
Exterior
- Parking: Attached carport; 2 carport spaces
- Security: Fire alarm
- Utilities: Public water; Public sewer; Electricity available; Cable available; Energy-efficient windows
- Home design: Single-family residence; One story
- Construction: Brick construction; Slab foundation
- Exterior features: Covered patio and porch; Partial privacy fencing; Level, city lot
Interior
- Kitchen: Oven (self-cleaning); Electric range; Dishwasher; Range hood; Electric water heater
- Flooring: Laminate; Vinyl
- Bathrooms: 1 full bathroom; 1 half bathroom
- Heating & cooling: Central heating; Hot water heating; Electric heating; Heat pump; Central air conditioning; Electric cooling
- Interior features: Skylights; Window coverings and blinds; Insulated double-pane windows; Fire alarm
- Laundry & utility: Washer hookup
Neighborhood map
What this means for you Summary
Snapshot
- This is a 3-bed/1.5-bath single-family listed at $130k.
Deal economics
- At list price, monthly cash flow is $369 ($4k/yr) — positive.
- The deal already cash-flows at list — no discount required.
- Meets the 1% rule at list price ($1k rent vs $130k).
- Cap rate 9.7% vs local median 4.2% in Enterprise — top-decile yield for the area; either an underpriced asset or a hidden risk that comps aren't pricing in. Stress-test before assuming the spread holds.
Location & tenants
- Location reads 65/100 on livability (#127 in AL) — a middle-class / working-renter tenant base. Strengths: cost of living A+, housing A+; Watch: health & safety D, crime F, amenities F.
- Enterprise City (town): math 40% / reading 60% proficiency, ranked #12 of 129 in AL (top 9%) — acceptable for families but not a draw, mixed tenant base, ~2y average lease.
- Market conditions: Rents rising (+3.9%/yr); 441 active listings in the ZIP; 28 comparable units currently listed for rent nearby; rentals lingering (median 44d on market — plan ~5-8 weeks vacancy on turnover, expect pricing pressure); 100% of comp listings sitting > 30 days — soft ceiling on asking rent; solid renter incomes; 137 units permitted in Coffee County in 2024 (0 in 5+ unit buildings).
Forward outlook
- Local home prices are declining (-3.0%/yr); year-one equity from $899 of loan paydown is wiped out by about $4k of value loss. Plan a longer hold.
- At projected returns (-3.0% appreciation + 3.9% rent growth), your $36k cash investment doubles in ~9 years — after that, you're playing with house money.
Negotiation context
- Only 13 days on market — expect competitive offers; lowballing is unlikely to land.
- 8 sale attempts since 19y ago with the ask held roughly flat each time — persistent listings suggest the price (not the market) is what's stuck; bring a comps-based counter.
Risks & watch-outs
- Climate carrying-cost: severe wind risk, 99% chance of damaging wind over 30y; extreme-heat days projected 7→19/yr by 2055 (HVAC capex compounding) — expect insurance premiums to compound above CPI over the hold.
Questions for the listing agent
- Built in 1965 — when were the roof, HVAC, electrical panel, plumbing, and water heater last replaced?
- Is there a deadline driving the sale (1031 exchange, divorce, estate, relocation)? That informs how much negotiation room exists.
- Crime grade is F in this area — have there been break-ins, vandalism, or insurance claims at this property in the last 3 years? What carrier currently insures it and at what premium?
- What's the average days-on-market for RENTAL listings here right now (not sales)? A rising rental-DOM trend means longer vacancies and softer asking-rent achievability than the comps imply.
- What's the recent tenant-quality profile in this submarket — average credit score on applications, eviction rate, late-payment / NSF rate, and stable-employment percentage? A property-management company in the area should have these aggregated.
- How much new for-sale + rental construction is in the pipeline within 1–3 miles? Heavy new supply typically softens prices + rents 12–24 months out; constrained supply supports both.
Investment metrics
- 1% rule
- 1.12% ✓
- Cap rate
- 9.70%
- Cash-on-cash
- 12.17%
- DSCR
- 1.54
- GRM
- 7.4
CMA / ARV
- ARV (median comp)
- $162,012
- List price
- $130,000
- Delta
- -19.76%
- Verdict
- UNDERPRICED
- Comps
- 20 within 1.0 mi
Show comp detail 12 sales within ~0.75 mi
| Address | Dist | Beds/Ba | Sqft | Sold | Price | $/sf | Match |
|---|---|---|---|---|---|---|---|
| 107 Deerfield Dr | 0.00mi | 3/1.5 | 1,550 (0%) | 0mo | $118,500 | $76 | 100 |
| 202 Deerfield Dr | 0.11mi | 3/2.0 | 1,534 (-1%) | 3mo | $130,000 | $85 | 89 |
| 117 Deerfield Dr | 0.10mi | 3/2.0 | 1,638 (+6%) | 2mo | $165,700 | $101 | 82 |
| 100 Doe St | 0.22mi | 3/2.0 | 1,620 (+4%) | 0mo | $210,000 | $130 | 80 |
| 215 Cardinal Ln | 0.39mi | 3/2.0 | 1,549 (-0%) | 4mo | $125,000 | $81 | 76 |
| 117 Foxhill Dr | 0.33mi | 3/2.0 | 1,468 (-5%) | 3mo | $210,000 | $143 | 71 |
| 117 W Emerald Dr | 0.31mi | 3/2.0 | 1,377 (-11%) | 1mo | $203,000 | $147 | 64 |
| 111 Woodley Dr | 0.43mi | 3/2.5 | 1,447 (-7%) | 1mo | $227,500 | $157 | 64 |
| 608 Melbourne Dr | 0.57mi | 3/2.0 | 1,497 (-3%) | 3mo | $195,000 | $130 | 63 |
| 101 Foxhill Dr | 0.28mi | 3/2.0 | 1,344 (-13%) | 0mo | $179,900 | $134 | 62 |
| 120 Crestview Dr | 0.53mi | 3/2.0 | 1,351 (-13%) | 2mo | $198,020 | $147 | 50 |
| 624 Green Dr | 0.71mi | 3/2.0 | 1,708 (+10%) | 1mo | $240,000 | $141 | 47 |
Match score weights: distance 35% · size 25% · config 20% · recency 20%. Top-matched comps best support the ARV.
Projected returns pro-forma
-3.0% appreciation · 3.92% rent growth · sell at horizon
- IRR
- 2.7%
- Equity multiple
- 1.10×
- Total profit
- $3,760
- Equity at exit
- $19,383
- IRR
- 13.0%
- Equity multiple
- 2.07×
- Total profit
- $39,042
- Equity at exit
- $11,240
Cash invested: $36,400 (down + closing). Projections, not guarantees.
Landlord ↔ Tenant lean methodology
- Overall (STATE)
- 90 Strongly Landlord-Friendly
- State Alabama
- 90 Strongly Landlord-Friendly · R+15
- County
- — inherits STATE
- City
- — inherits STATE
ZIP-level market 36330
- Home prices YoY
- -19.4%
- Rents YoY
- 3.9%
- Active inventory
- 441
- Price-to-rent
- 7.4×
Monthly cashflow live
- Estimated rent
- $1,457 high interval (Pro) →
- Mortgage (P&I)
- −$682
- Tax from tax record
- −$46 /mo · $555/yr
- Insurance
- −$54
- HOA
- −$0
- Vacancy / Maint / Mgmt
- −$306
- Net cashflow
- $369
Break-even live
UW: 25.0% down · 7.5% · 30yr · 1.5% tax · 5.0% vac · 8.0% maint · 8.0% mgmt
Financing live
Cash to close
- Down payment
- $32,500
- Closing costs
- $3,900
- Reserves months
- —
- Total cash needed
- —
Loan-product check · same deal, 3 products live
Conventional
25% down · 7.5% · 30yr
- Down + closing
- —
- Monthly P&I
- —
- Monthly cashflow
- —
- DSCR
- —
- Eligible?
- —
Personal DTI + credit; lowest rate.
DSCR
20% down · 8.5% · 30yr
- Down + closing
- —
- Monthly P&I
- —
- Monthly cashflow
- —
- DSCR
- —
- Eligible?
- —
No personal income docs; deal must DSCR.
Hard money
10% down · 12.0% · 12mo
- Down + closing
- —
- Monthly P&I
- —
- Monthly cashflow
- —
- DSCR
- —
- Eligible?
- —
Short-term bridge; refi at stabilization.
Rent comps 28 comps
| Address | Beds | Baths | Sqft | Rent | $/sqft | DOM | Units | Dist |
|---|---|---|---|---|---|---|---|---|
| 206 Myrtlewood Dr Enterprise, AL | 3.0 | 2.0 | 1155 | $1,400 | $1.21 | 43d | 1 | 0.23mi |
| 137 Commons Dr Unit 1 Enterprise, AL | 2.0 | 2.5 | 1369 | $1,100 | $0.80 | 43d | 1 | 0.29mi |
| 210 Morgan Ln Enterprise, AL | 3.0 | 2.0 | 1494 | $1,300 | $0.87 | 43d | 1 | 0.29mi |
| 133 Commons Dr Enterprise, AL | 3.0 | 2.5 | 1400 | $1,200 | $0.86 | 43d | 1 | 0.30mi |
| 106 Pineridge Dr Enterprise, AL | 2.0 | 2.5 | 1427 | $1,150 | $0.81 | 43d | 1 | 0.30mi |
| 214 Morgan Ln Enterprise, AL | 3.0 | 2.0 | 1322 | $1,400 | $1.06 | 43d | 1 | 0.33mi |
| 114 Commons Dr Enterprise, AL | 2.0 | 2.5 | 1380 | $1,300 | $0.94 | 43d | 1 | 0.36mi |
| 102 Commons Dr Enterprise, AL | 2.0 | 2.5 | 1380 | $1,250 | $0.91 | 43d | 1 | 0.38mi |
| 184 N Springview Dr Enterprise, AL | 3.0 | 2.5 | 1494 | $1,350 | $0.90 | 43d | 1 | 0.47mi |
| 160 N Springview Dr Enterprise, AL | 3.0 | 2.5 | 1495 | $1,350 | $0.90 | 43d | 1 | 0.51mi |
| 605 Melbourne Dr Enterprise, AL | 3.0 | 2.0 | 1333 | $1,650 | $1.24 | 43d | 1 | 0.53mi |
| 3101 Achey Dr Enterprise, AL | 2.0 | 1.5 | 1232 | $1,200 | $0.97 | 43d | 1 | 0.54mi |
| 85 Courtyard Way Enterprise, AL | 3.0 | 2.5 | 1460 | $1,375 | $0.94 | 43d | 1 | 0.55mi |
| 25 Courtyard Way Enterprise, AL | 2.0 | 2.5 | 1632 | $1,250 | $0.77 | 43d | 1 | 0.57mi |
| 102 S Spring View Dr Enterprise, AL | 2.0 | 2.5 | 1404 | $1,300 | $0.93 | 43d | 1 | 0.59mi |
| 114 S Spring View Dr Enterprise, AL | 3.0 | 2.5 | 1494 | $1,300 | $0.87 | 43d | 1 | 0.61mi |
| 118 Baldwin Dr Enterprise, AL | 3.0 | 2.5 | 1494 | $1,375 | $0.92 | 43d | 1 | 0.69mi |
| 107 Wakefield Way Enterprise, AL | 2.0 | 2.5 | 1369 | $1,350 | $0.99 | 43d | 1 | 0.82mi |
| 206 Wakefield Way Enterprise, AL | 2.0 | 2.5 | 1495 | $2,635 | $1.76 | 43d | 1 | 0.87mi |
| 452 Sandy Oak Dr Enterprise, AL | 2.0 | 1.5 | 1300 | $1,150 | $0.88 | 43d | 1 | 0.88mi |
| 455 Sandy Oak Dr Enterprise, AL | 3.0 | 2.5 | 1504 | $1,975 | $1.31 | 43d | 1 | 0.91mi |
| 443 Sandy Oak Dr Enterprise, AL | 2.0 | 2.5 | 1504 | $1,350 | $0.90 | 43d | 1 | 0.92mi |
| 206 Myrick Dr Enterprise, AL | 3.0 | 2.0 | 1800 | $1,595 | $0.89 | 43d | 1 | 0.92mi |
| 203 Winthrope Ln Enterprise, AL | 2.0 | 2.5 | 1365 | $1,325 | $0.97 | 43d | 1 | 0.93mi |
| 200 Cheyenne Dr Enterprise, AL | 2.0 | 1.5 | 1088 | $800 | $0.74 | 43d | 1 | 0.94mi |
| 155 Wingate Ave Enterprise, AL | 2.0 | 2.0 | 1600 | $1,450 | $0.91 | 43d | 1 | 1.01mi |
| 12 County Road 738 Enterprise, AL | 4.0 | 2.0 | 2100 | $1,900 | $0.90 | 43d | 1 | 1.15mi |
| 203 Coral Way Enterprise, AL | 4.0 | 2.0 | 1583 | $1,950 | $1.23 | 43d | 1 | 1.41mi |
Listing history 10 events
-
2026-05-14status Pending 528-char remark
-
2026-04-30$130,000 Active 528-char remark
-
2013-07-19$88,500
-
2013-07-19$88,500
-
2012-05-18$89,500
-
2012-05-18$89,500
-
2011-07-21$95,000
-
2011-07-21$95,000
-
2007-04-20soldstatus $85,000
-
2007-02-28$93,000
ⓘ Source: listings_history table (triggers on properties + properties_extension) + one-shot
backfill from property_details.listing_events for pre-trigger history.
Tax reassessment forecast AL · Resets to sale price
- Current annual tax
- $555 · $46/mo
- Projected year-2 tax
- $555 · $46/mo
- Expected delta
- $0/yr ($0/mo · 0.0%)
ⓘ Screening estimate from a state-policy table — verify with the county assessor before closing.
Climate risk First Street
- Flood 1/10 Low FEMA zone X (unshaded) · 0% chance over 30 yrs
- Wildfire 3/10 Moderate
- Heat 8/10 Severe 7 d/yr ≥106°F today · 19 d/yr by 30 yrs out
- Wind 8/10 Severe 99% chance of damaging wind over 30 yrs
- Air quality 2/10 Low 0 unhealthy d/yr today · 1 by 30 yrs out
Nearby sold comps map
Loading sold comps map…
Walkable amenities ~0.75 mi
Loading nearby amenities…
Taxation est. · year 1
- Rental income
- $17,489
- − Mortgage interest
- −$7,282
- − Property taxes
- −$555
- − Insurance
- −$650
- − Repairs & maintenance
- −$1,399
- − Management
- −$1,399
- − Depreciation
- −$3,782
- Taxable income
- $2,422
- Est. tax owed @ 24.0%
- −$581
- After-tax cash flow
- $3,849/yr
For passive investors: Depreciation is non-cash, so a rental often shows a tax loss while cash-flowing — sheltering income. Rental losses are passive: they offset passive income freely, and up to $25,000/yr can offset ordinary (W-2) income if you actively participate and your MAGI is under $100k (phasing out to $0 by $150k); unused losses carry forward. On sale, claimed depreciation is recaptured at up to 25%, and gains may owe capital-gains tax (a 1031 exchange can defer both). Figures are a year-1 estimate at your 24.0% rate — not tax advice; consult a CPA.
Schools (NCES district)
- District
- Enterprise City
- NCES district ID
- 0101320
- Math proficiency
- 40% ▼ -20.00%
- Reading proficiency
- 60% ▲ 4.00%
- Median HH income
- $51,311
- Composite
- 42.83/100
- National rank
- #3136
- State rank
- #12 of 129 in AL
Livability — Enterprise
- Score
- 65/100
- State rank
- #127
- US rank
- #12953
Category grades
Schools grade is shown separately in the Schools card above.
Census & demographics
- Census place
- Enterprise, AL
- County
- Coffee County · 39,557 people
- City population
- 39,557
- Metro
- Enterprise, AL
- Population (ZIP)
- 39,557
- Household income
- $75,765
- Rent vs Own
- Severe rent burden
- 1126.0
Population outlook (Coffee County) Hauer SSP2
- Today (2025)
- 53,133 people
- By 2030
- 53,832 · +1.3%
- By 2040
- 54,504 · +2.6%
- By 2050
- 54,289 · +2.2%
- By 2075
- 51,175 · -3.7%
- By 2100
- 46,793 · -11.9%
Race, ethnicity, and origin ACS 2023
- Neighborhood character
- Diverse neighborhood (Simpson 0.56)
- Race & ethnicity
- White 63% Black 17% Hispanic / Latino 13% Two or more races 9% Asian 1%
- Hispanic origin (detail)
- Mexican 6% Puerto Rican 3%
- Common ancestry
- Italian 3% Lithuanian 2% Serbian 2%
- Foreign-born
- 6% · Canada, Vietnam, South Korea
- Languages at home
- 89% English-only · Spanish 8% German/W. Germanic 2%
Political lean MEDSL · Coffee
- 2024 margin
- Solid R (+57.9) · D 20.7% · R 78.6%
- 2008→2024 swing
- -9.0pp toward R · 2008: -48.9pp · 2024: -57.9pp
- All cycles
- 2024: R+57.9 2020: R+53.1 2016: R+56.7 2012: R+49.4 2008: R+48.9
Not yet ingested
- Civics
- —
Market trends
- HPI YoY
- ▼ -44.44%
- Current HPI
- 184.0163
- Rent YoY
- ▲ 3.92%
- Metro
- Enterprise, AL
- State GDP YoY
- ▲ 2.94%
- F500 in state
- 4
Industry mix (Fortune 500 HQ in AL)
| Industry | F500 HQs | Revenue |
|---|---|---|
| Financial Services | 1 | $8B |
|
||
| Healthcare | 1 | $5B |
|
||
Price history
+27.4% since first listed11 events — show timeline
- 2026-06-12 Sold (MLS) $118,500 WBR
- 2026-05-14 Pending — WBR
- 2026-04-30 Listed $130,000 WBR
- 2013-07-19 Listed $88,500 WBR
- 2013-07-19 Listed $88,500 MAAR
- 2012-05-18 Listed $89,500 MAAR
- 2012-05-18 Listed $89,500 WBR
- 2011-07-21 Listed $95,000 MAAR
- 2011-07-21 Listed $95,000 WBR
- 2007-04-20 Sold (MLS) $85,000 MAAR
- 2007-02-28 Listed $93,000 MAAR
Property tax history
+4.4%/yrLatest (2025): $555 · +6.3% YoY. Source: county tax records.
Cash-flow waterfall
monthlySold comps — $/sqft
last 12 mo · ≤1 miLoading sold comps…