 🏗️ New Construction
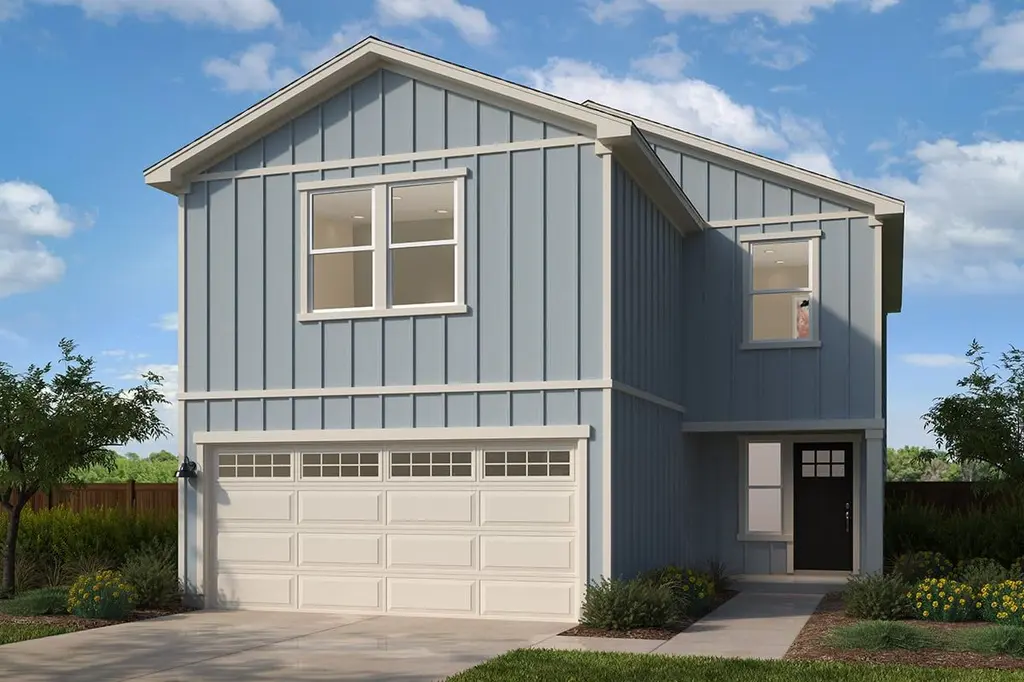
Plan 1772 Plan · Uhland, TX
Flood risk 1/10 · Minimal
- FEMA flood zone
- X (unshaded)
- Chance of flooding over 30 yrs
- 0.0%
- Est. flood insurance / yr
- $507 – $1,088
Fire risk 4/10 · Minor
- Est. fire insurance / yr
- $1,222 – $2,270
Heat risk 8/10 · Major
- Hot days now (above 108°F)
- 7 days/yr
- Hot days in 30 yrs
- 23 days/yr
Wind risk 8/10 · Major
- Chance of severe wind over 30 yrs
- 80.0%
Air-quality risk 1/10 · Minimal
- Unhealthy air days now
- 0 days/yr
- Unhealthy air days in 30 yrs
- 0 days/yr
Risk factors via First Street. Map © Google.
Why this score? — see what drove the F grade
The composite is a weighted blend of 9 inputs, each scored 0–100. Each bar is that input's sub-score; the figure is the points it added to the 100-point composite (weight × sub-score).
- ARV discount +7.5/15.0
- Cash flow +6.4/30.0
- Schools +3.5/10.0
- Livability +2.7/5.0
- Condition / age +2.5/5.0
- Rent growth +2.4/5.0
- 1% rule +1.6/10.0
- DSCR +0.7/10.0
- Appreciation +0.0/10.0
$243,995
🖨 Deal sheet (PDF) 📄 Offer letter ✓ Due diligence
Listing remarks MLS
* Granite kitchen countertops * Covered back patio * Dedicated laundry room * Stainless steel kitchen appliances * Kitchen breakfast bar * WaterSense® labeled faucets * Gas range * Smart thermostat * Spacious great room * Loft * Kitchen USB charging port * ENERGY STAR® certified home * Playground * Walking paths * Close to family friendly parks * Outdoor recreation nearby * Close to golf courses * Near beautiful lakes
Key facts
- Covered back patio
- Gas range
- 2 garage spots
Tags
Neighborhood map
What this means for you Summary
Snapshot
- This is a 3-bed/2.5-bath single-family listed at $244k.
Deal economics
- At list price, monthly cash flow is $-499 ($-6k/yr) — negative.
- To cash-flow at today's rent, offer at most $219k (10.1% below list).
- To meet the 1% rule (rent ≥ 1% of price), the offer needs to be $192k (21.3% below list).
- Recommended offer: $192k (21.3% below list) — sets the bar for 1% rule.
Location & tenants
- Location reads 54/100 on livability (#1,385 in TX) — a working-class tenant base; expect higher turnover. Strengths: cost of living A+, housing A+, crime A; Watch: employment C-, schools F, amenities F.
- Hays CISD (rural): math 35% / reading 41% proficiency, ranked #390 of 826 in TX (top 47%) — families likely to look elsewhere, expect single-tenant / working-renter base with shorter leases.
- Market conditions: Rents soft (-0.3%/yr); 1801 active listings in the ZIP; 8 comparable units currently listed for rent nearby; rentals at typical pace (median 25d on market — plan ~3-4 weeks tenant-placement turnaround); solid renter incomes; 5,270 units permitted in Hays County in 2024 (1,464 in 5+ unit buildings).
Forward outlook
- Local home prices are declining (-3.0%/yr); year-one equity from $2k of loan paydown is wiped out by about $9k of value loss. Plan a longer hold.
- Hays County population projected at +93% by 2050 — long-run rental-demand tailwind backs the buy-and-hold thesis.
Negotiation context
- It's been on market 154 days — a 12% lower offer ($215k) is reasonable based on typical stale-listing flexibility.
Risks & watch-outs
- Climate carrying-cost: severe wind risk, 80% chance of damaging wind over 30y; extreme-heat days projected 7→23/yr by 2055 (HVAC capex compounding) — expect insurance premiums to compound above CPI over the hold.
Questions for the listing agent
- What do current leases actually rent for vs. the listed asking? Can we see a recent rent roll and the last 12 months of T-12 income?
- It's been on market 154 days. Have you received any prior offers? Is the seller open to a 21% concession, seller financing, or rate buy-down credit?
- Why hasn't it sold? Are there any deal-killer items the seller is aware of (foundation, flood, title, zoning, code violations)?
- Is there a deadline driving the sale (1031 exchange, divorce, estate, relocation)? That informs how much negotiation room exists.
- Schools are F-rated, which usually means shorter tenancies and higher turnover. Who's the typical renter profile here, and what's been the actual vacancy rate?
- The area grade is low — what's the realistic commute time and amenity access for the typical tenant pool here? Any planned neighborhood developments (good or bad) we should know about?
- What's the average days-on-market for RENTAL listings here right now (not sales)? A rising rental-DOM trend means longer vacancies and softer asking-rent achievability than the comps imply.
- What's the recent tenant-quality profile in this submarket — average credit score on applications, eviction rate, late-payment / NSF rate, and stable-employment percentage? A property-management company in the area should have these aggregated.
- How much new for-sale + rental construction is in the pipeline within 1–3 miles? Heavy new supply typically softens prices + rents 12–24 months out; constrained supply supports both.
Investment metrics
- 1% rule
- 0.66% ✗
- Cap rate
- 4.24%
- Cash-on-cash
- -7.33%
- DSCR
- 0.67
- GRM
- 12.7
CMA / ARV
- ARV (median comp)
- $291,584
- List price
- $243,995
- Delta
- -16.32%
- Verdict
- UNDERPRICED
- Comps
- 20 within 1.0 mi
Show comp detail 12 sales within ~0.75 mi
| Address | Dist | Beds/Ba | Sqft | Sold | Price | $/sf | Match |
|---|---|---|---|---|---|---|---|
| 277 Ebbsfleet Dr | 0.07mi | 3/2.5 | 1,696 (-4%) | 4mo | $279,990 | $165 | 86 |
| 332 Ebbsfleet Dr | 0.10mi | 3/2.5 | 1,696 (-4%) | 4mo | $277,990 | $164 | 85 |
| 321 Ebbsfleet Dr | 0.12mi | 4/2.5 (+1) | 1,968 (+11%) | 5mo | $281,990 | $143 | 67 |
| 345 Ebbsfleet Dr | 0.13mi | 3/2.0 | 1,535 (-13%) | 6mo | $279,990 | $182 | 65 |
| 416 Sandringham Loop | 0.22mi | 4/2.0 (+1) | 1,615 (-9%) | 4mo | $275,990 | $171 | 65 |
| 449 Sandringham Loop | 0.17mi | 4/2.5 (+1) | 1,952 (+10%) | 8mo | $300,990 | $154 | 64 |
| 181 Morett Dr | 0.06mi | 4/2.0 (+1) | 2,032 (+15%) | 5mo | $316,990 | $156 | 61 |
| 424 Sandringham Loop | 0.21mi | 3/2.0 | 1,535 (-13%) | 7mo | $283,490 | $185 | 60 |
| 211 Morett Dr | 0.32mi | 4/2.0 (+1) | 1,659 (-6%) | 9mo | $298,990 | $180 | 60 |
| 543 Sandringham Loop | 0.15mi | 4/2.5 (+1) | 2,034 (+15%) | 5mo | $295,000 | $145 | 59 |
| 449 Frogmore Loop | 0.34mi | 4/2.0 (+1) | 1,608 (-9%) | 5mo | $270,990 | $169 | 58 |
| 221 Morett Dr | 0.14mi | 4/2.0 (+1) | 2,032 (+15%) | 11mo | $351,990 | $173 | 53 |
Match score weights: distance 35% · size 25% · config 20% · recency 20%. Top-matched comps best support the ARV.
Projected returns pro-forma
-3.0% appreciation · 0.0% rent growth · sell at horizon
- IRR
- -32.4%
- Equity multiple
- -0.04×
- Total profit
- $-84,625
- Equity at exit
- $43,476
- IRR
- -59.5%
- Equity multiple
- -0.67×
- Total profit
- $-136,230
- Equity at exit
- $25,211
Cash invested: $81,643 (down + closing). Projections, not guarantees.
Landlord ↔ Tenant lean methodology
- Overall (STATE)
- 87 Strongly Landlord-Friendly
- State Texas
- 87 Strongly Landlord-Friendly · R+5
- County
- — inherits STATE
- City
- — inherits STATE
ZIP-level market 78640
- Home prices YoY
- -33.8%
- Rents YoY
- -0.3%
- Active inventory
- 1801
- Price-to-rent
- 10.6×
Monthly cashflow live
- Estimated rent
- $1,919 high interval (Pro) →
- Mortgage (P&I)
- −$1,529
- Tax est. 1.5%
- −$364 /mo · $4,374/yr
- Insurance
- −$121
- HOA
- −$0
- Vacancy / Maint / Mgmt
- −$403
- Net cashflow
- $-499
Break-even live
Sensitivity live
| Price | -10% $-297 | -5% $-398 | +0% $-499 | +5% $-600 | +10% $-700 |
|---|---|---|---|---|---|
| Rent | -10% $-651 | -5% $-575 | +0% $-499 | +5% $-423 | +10% $-347 |
| Rate | -1.0pp $-352 | -0.5pp $-425 | base $-499 | +0.5pp $-575 | +1.0pp $-651 |
UW: 25.0% down · 7.5% · 30yr · 1.5% tax · 5.0% vac · 8.0% maint · 8.0% mgmt
Financing live
Cash to close
- Down payment
- $72,896
- Closing costs
- $8,748
- Reserves months
- —
- Total cash needed
- —
Loan-product check · same deal, 3 products live
Conventional
25% down · 7.5% · 30yr
- Down + closing
- —
- Monthly P&I
- —
- Monthly cashflow
- —
- DSCR
- —
- Eligible?
- —
Personal DTI + credit; lowest rate.
DSCR
20% down · 8.5% · 30yr
- Down + closing
- —
- Monthly P&I
- —
- Monthly cashflow
- —
- DSCR
- —
- Eligible?
- —
No personal income docs; deal must DSCR.
Hard money
10% down · 12.0% · 12mo
- Down + closing
- —
- Monthly P&I
- —
- Monthly cashflow
- —
- DSCR
- —
- Eligible?
- —
Short-term bridge; refi at stabilization.
Rent comps 8 comps
| Address | Beds | Baths | Sqft | Rent | $/sqft | DOM | Units | Dist |
|---|---|---|---|---|---|---|---|---|
| 176 Gerasa Dr Kyle, TX | 4.0 | 2.5 | 2064 | $2,000 | $0.97 | 12d | 1 | 0.19mi |
| 321 Sandringham Loop Kyle, TX | 4.0 | 3.0 | 2473 | $1,900 | $0.77 | 5d | 1 | 0.24mi |
| 191 Frogmore Loop Kyle, TX | 4.0 | 2.5 | 2068 | $1,899 | $0.92 | 44d | 1 | 0.38mi |
| 129 Pineland Ave Niederwald, TX | 3.0 | 2.0 | 1460 | $1,414 | $0.97 | 13d | 1 | 1.08mi |
| 151 Pink Footed Pass Uhland, TX | 4.0 | 2.0 | 1483 | $1,600 | $1.08 | 24d | 1 | 1.27mi |
| 177 Pink Footed Pass Uhland, TX | 4.0 | 2.0 | 1483 | $1,525 | $1.03 | 24d | 1 | 1.27mi |
| 177 Pink Footed Pass Uhland, TX | 4.0 | 2.0 | 1483 | $1,525 | $1.03 | 44d | 1 | 1.27mi |
| 263 Speckled Belly Bnd Uhland, TX | 4.0 | 2.0 | 1600 | $1,650 | $1.03 | 17d | 1 | 1.39mi |
Listing history 17 events
-
2026-06-18days on market $243,995 Active 154 DOM
-
2026-06-17days on market $243,995 Active 153 DOM
-
2026-06-16days on market $243,995 Active 152 DOM
-
2026-06-15days on market $243,995 Active 151 DOM
-
2026-06-13days on market $243,995 Active 149 DOM
-
2026-06-09days on market $243,995 Active 145 DOM
-
2026-06-08days on market $243,995 Active 144 DOM
-
2026-06-07days on market $243,995 Active 143 DOM
-
2026-06-05days on market $243,995 Active 140 DOM
-
2026-06-03days on market $243,995 Active 139 DOM
-
2026-06-02days on market $243,995 Active 138 DOM
-
2026-06-01days on market $243,995 Active 137 DOM
-
2026-05-31days on market $243,995 Active 136 DOM
-
2026-05-08price $243,995 464-char remark
Show marketing remark (464 chars)
* Granite kitchen countertops * Covered back patio * Dedicated laundry room * Stainless steel kitchen appliances * Kitchen breakfast bar * WaterSense® labeled faucets * Gas range * Smart thermostat * Spacious great room * Loft * Kitchen USB charging port * ENERGY STAR® certified home * Playground * Walking paths * Close to family friendly parks * Outdoor recreation nearby * Close to golf courses * Near beautiful lakes
-
2026-04-17price $247,995 464-char remark
Show marketing remark (464 chars)
* Granite kitchen countertops * Covered back patio * Dedicated laundry room * Stainless steel kitchen appliances * Kitchen breakfast bar * WaterSense® labeled faucets * Gas range * Smart thermostat * Spacious great room * Loft * Kitchen USB charging port * ENERGY STAR® certified home * Playground * Walking paths * Close to family friendly parks * Outdoor recreation nearby * Close to golf courses * Near beautiful lakes
-
2026-02-19price $252,995 464-char remark
Show marketing remark (464 chars)
* Granite kitchen countertops * Covered back patio * Dedicated laundry room * Stainless steel kitchen appliances * Kitchen breakfast bar * WaterSense® labeled faucets * Gas range * Smart thermostat * Spacious great room * Loft * Kitchen USB charging port * ENERGY STAR® certified home * Playground * Walking paths * Close to family friendly parks * Outdoor recreation nearby * Close to golf courses * Near beautiful lakes
-
2026-01-15$262,995 Active 464-char remark
Show marketing remark (464 chars)
* Granite kitchen countertops * Covered back patio * Dedicated laundry room * Stainless steel kitchen appliances * Kitchen breakfast bar * WaterSense® labeled faucets * Gas range * Smart thermostat * Spacious great room * Loft * Kitchen USB charging port * ENERGY STAR® certified home * Playground * Walking paths * Close to family friendly parks * Outdoor recreation nearby * Close to golf courses * Near beautiful lakes
ⓘ Source: listings_history table (triggers on properties + properties_extension) + one-shot
backfill from property_details.listing_events for pre-trigger history.
Climate risk First Street
- Flood 1/10 Low FEMA zone X (unshaded) · 0% chance over 30 yrs
- Wildfire 4/10 Moderate
- Heat 8/10 Severe 7 d/yr ≥108°F today · 23 d/yr by 30 yrs out
- Wind 8/10 Severe 80% chance of damaging wind over 30 yrs
- Air quality 1/10 Low 0 unhealthy d/yr today · 0 by 30 yrs out
Nearby sold comps map
Loading sold comps map…
Walkable amenities ~0.75 mi
Loading nearby amenities…
Taxation est. · year 1
- Rental income
- $23,029
- − Mortgage interest
- −$16,333
- − Property taxes
- −$4,374
- − Insurance
- −$1,458
- − Repairs & maintenance
- −$1,842
- − Management
- −$1,842
- − Depreciation
- −$8,482
- Taxable loss
- −$11,303
- Est. tax savings @ 24.0%
- +$2,713
- After-tax cash flow
- $-3,275/yr
For passive investors: Depreciation is non-cash, so a rental often shows a tax loss while cash-flowing — sheltering income. Rental losses are passive: they offset passive income freely, and up to $25,000/yr can offset ordinary (W-2) income if you actively participate and your MAGI is under $100k (phasing out to $0 by $150k); unused losses carry forward. On sale, claimed depreciation is recaptured at up to 25%, and gains may owe capital-gains tax (a 1031 exchange can defer both). Figures are a year-1 estimate at your 24.0% rate — not tax advice; consult a CPA.
Schools (NCES district)
- District
- Hays CISD
- NCES district ID
- 4800010
- Math proficiency
- 35% ▼ -15.00%
- Reading proficiency
- 41% ▼ -5.00%
- Median HH income
- $70,570
- Composite
- 34.78/100
- National rank
- #5118
- State rank
- #390 of 826 in TX
Livability — Uhland
- Score
- 54/100
- State rank
- #1385
- US rank
- #23774
Category grades
Schools grade is shown separately in the Schools card above.
Census & demographics
- County
- Hays County · 280,138 people
- Metro
- Austin-Round Rock-Georgetown, TX
- Population (ZIP)
- 77,531
- Household income
- $90,075
- Rent vs Own
- Severe rent burden
- 2552.0
Population outlook (Hays County) Hauer SSP2
- Today (2025)
- 286,948 people
- By 2030
- 336,923 · +17.4%
- By 2040
- 441,894 · +54.0%
- By 2050
- 553,462 · +92.9%
- By 2075
- 838,261 · +192.1%
- By 2100
- 1,063,658 · +270.7%
Race, ethnicity, and origin ACS 2023
- Neighborhood character
- Diverse neighborhood (Simpson 0.56)
- Race & ethnicity
- Hispanic / Latino 55% White 36% Two or more races 29% Black 5% Native American 1%
- Hispanic origin (detail)
- Mexican 47% Puerto Rican 1%
- Common ancestry
- Italian 2% Slovak 2% Lithuanian 1%
- Foreign-born
- 13% · Canada
- Languages at home
- 63% English-only · Spanish 35%
Political lean MEDSL · Hays
- 2024 margin
- Lean D (+5.7) · D 52.1% · R 46.5% · Other 1.4%
- 2008→2024 swing
- +7.7pp toward D · 2008: -2.0pp · 2024: 5.7pp
- All cycles
- 2024: D+5.7 2020: D+10.8 2016: R+0.9 2012: R+10.4 2008: R+2.0
Not yet ingested
- Civics
- —
Market trends
- HPI YoY
- ▼ -92.64%
- Current HPI
- 181.7969
- Rent YoY
- ▼ -0.34%
- Metro
- Austin-Round Rock-Georgetown, TX
- State GDP YoY
- ▲ 3.95%
- F500 in state
- 110
Industry mix (Fortune 500 HQ in TX)
| Industry | F500 HQs | Revenue |
|---|---|---|
| Energy | 16 | $1,198B |
|
||
| Technology | 5 | $198B |
|
||
| Engineering / Construction | 4 | $72B |
|
||
| Energy Services | 3 | $60B |
|
||
| Utilities | 3 | $41B |
|
||
| Healthcare | 2 | $330B |
|
||
Price history
-7.2% since first listed4 events — show timeline
- 2026-05-08 Price Changed $243,995 Zillow
- 2026-04-17 Price Changed $247,995 Zillow
- 2026-02-19 Price Changed $252,995 Zillow
- 2026-01-15 Listed $262,995 Zillow
Cash-flow waterfall
monthlySold comps — $/sqft
last 12 mo · ≤1 miLoading sold comps…