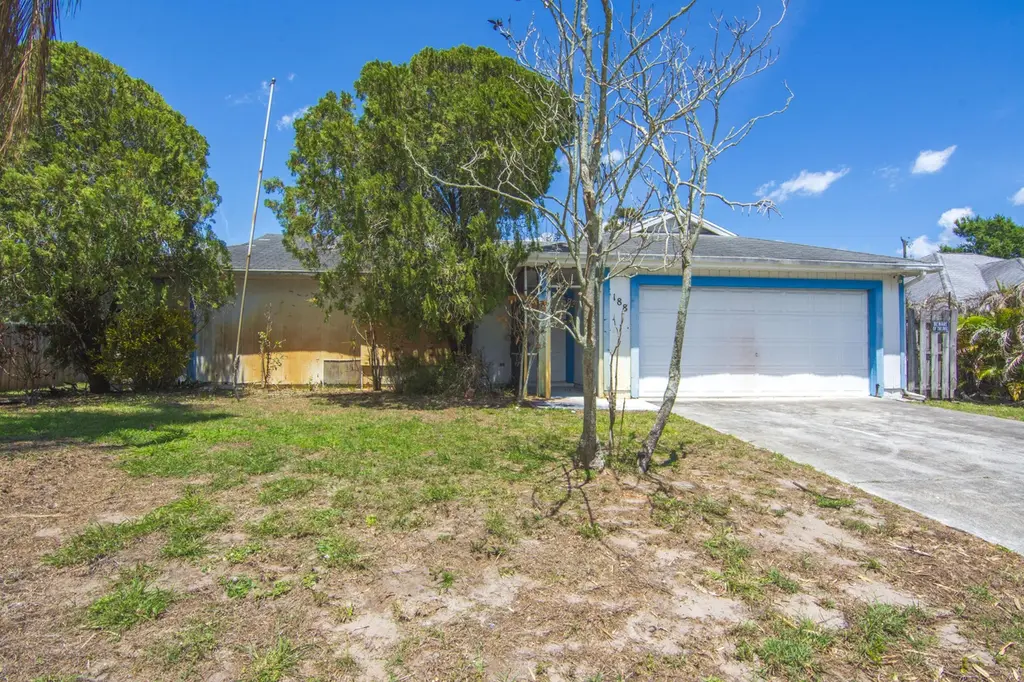
188 SW Milburn Cir · Port St. Lucie, FL
Flood risk 1/10 · Minimal
- FEMA flood zone
- X (unshaded)
- Chance of flooding over 30 yrs
- 0.0%
- Est. flood insurance / yr
- $507 – $1,088
Fire risk 2/10 · Minimal
- Est. fire insurance / yr
- $947 – $1,759
Heat risk 10/10 · Severe
- Hot days now (above 106°F)
- 7 days/yr
- Hot days in 30 yrs
- 24 days/yr
Wind risk 10/10 · Severe
- Chance of severe wind over 30 yrs
- 99.0%
Air-quality risk 1/10 · Minimal
- Unhealthy air days now
- 0 days/yr
- Unhealthy air days in 30 yrs
- 0 days/yr
Risk factors via First Street. Map © Google.
Why this score? — see what drove the C grade
The composite is a weighted blend of 9 inputs, each scored 0–100. Each bar is that input's sub-score; the figure is the points it added to the 100-point composite (weight × sub-score).
- Cash flow +20.2/30.0
- ARV discount +15.0/15.0
- DSCR +6.4/10.0
- 1% rule +6.2/10.0
- Schools +3.7/10.0
- Rent growth +2.6/5.0
- Livability +2.5/5.0
- Condition / age +2.5/5.0
- Appreciation +0.0/10.0
$239,900
🖨 Deal sheet 📄 Offer letter ✓ Due diligence
Listing remarks MLS
Opportunity knocks ! This property is truly a blank canvas, offering endless potential for investors, renovators, or buyers looking to customize their dream home. With solid bones and a functional layout, this residence is ready for a full transformation to match today's modern style and finishes. Bring your vision and creativity--this home presents a rare chance to renovate to your exact taste while building equity. Ideal for those seeking a project property with upside potential, whether for resale, rental income, or personal use. Conveniently located near shopping, dining, and major roadways, this property combines location with opportunity. Don't miss your chance to turn this diamond in the rough into something special! all measurements are approximate
Key facts
- Solid bones
- Functional layout
- 0.23 acre lot
Tags
Property features AI
Exterior
- Parking: Attached 2-car garage; 2 covered parking spaces; 2 open parking spaces; Concrete driveway
- Utilities: Public water; Public sewer; Sewer and water available
- Home design: Single-family residence; One-story; Resale property; Faces south
- Construction: Frame construction; Shingle roof; Slab foundation; Built area listed from public records
- Exterior features: Asphalt road; Publicly maintained road; Not waterfront
Interior
- Bedrooms: 3 bedrooms on the main level
- Flooring: Carpet; Tile
- Bathrooms: 2 full bathrooms on the main level
- Heating & cooling: Central heating; Central air conditioning
- Interior features: Split bedroom layout
Neighborhood map
What this means for you Summary
Snapshot
- This is a 3-bed/2.0-bath single-family listed at $240k.
Deal economics
- At list price, monthly cash flow is $304 ($4k/yr) — positive.
- The deal already cash-flows at list — no discount required.
- Meets the 1% rule at list price ($3k rent vs $240k).
- Recommended offer: $233k (3.0% below list) — sets the bar for market timing.
- Cap rate 7.8% vs local median 3.9% in Port St. Lucie — top-decile yield for the area; either an underpriced asset or a hidden risk that comps aren't pricing in. Stress-test before assuming the spread holds.
Location & tenants
- Location reads: area grade C — affects rentability + tenant quality, not the cash-flow math above.
- St. Lucie (urban): math 40% / reading 48% proficiency, ranked #51 of 73 in FL (top 70%) — families likely to look elsewhere, expect single-tenant / working-renter base with shorter leases.
- Market conditions: Rents flat; 758 active listings in the ZIP; 7 comparable units currently listed for rent nearby; rentals at typical pace (median 24d on market — plan ~3-4 weeks tenant-placement turnaround); solid renter incomes; 4,868 units permitted in St. Lucie County in 2024 (268 in 5+ unit buildings).
- This rent runs 38% of the median local income ($86k/yr) — at the standard rent-burdened threshold; future hikes will face affordability resistance.
Forward outlook
- Local home prices are declining (-3.0%/yr); year-one equity from $2k of loan paydown is wiped out by about $7k of value loss. Plan a longer hold.
- St. Lucie County population projected at +20% by 2050 — long-run rental-demand tailwind backs the buy-and-hold thesis.
Negotiation context
- It's been on market 58 days — a 3% lower offer ($233k) is reasonable based on typical stale-listing flexibility.
- 2 sale attempts with the ask held roughly flat each time — persistent listings suggest the price (not the market) is what's stuck; bring a comps-based counter.
- Current owner paid $66k; list at $240k implies a 263% gain — meaningful room to come down on a strong offer.
Risks & watch-outs
- Climate carrying-cost: severe wind risk, 99% chance of damaging wind over 30y; extreme-heat days projected 7→24/yr by 2055 (HVAC capex compounding) — expect insurance premiums to compound above CPI over the hold.
Questions for the listing agent
- It's been on market 58 days. Have you received any prior offers? Is the seller open to a 3% concession, seller financing, or rate buy-down credit?
- Is there a deadline driving the sale (1031 exchange, divorce, estate, relocation)? That informs how much negotiation room exists.
- What's the average days-on-market for RENTAL listings here right now (not sales)? A rising rental-DOM trend means longer vacancies and softer asking-rent achievability than the comps imply.
- What's the recent tenant-quality profile in this submarket — average credit score on applications, eviction rate, late-payment / NSF rate, and stable-employment percentage? A property-management company in the area should have these aggregated.
- How much new for-sale + rental construction is in the pipeline within 1–3 miles? Heavy new supply typically softens prices + rents 12–24 months out; constrained supply supports both.
Investment metrics
- 1% rule
- 1.12% ✓
- Cap rate
- 7.81%
- Cash-on-cash
- 5.44%
- DSCR
- 1.24
- GRM
- 7.4
CMA / ARV
- ARV (on-the-fly)
- $315,744
- Comps found
- 5
Show comp detail 5 sales within ~0.75 mi
| Address | Dist | Beds/Ba | Sqft | Sold | Price | $/sf | Match |
|---|---|---|---|---|---|---|---|
| 456 SW Kestor Dr | 0.32mi | 2/2.0 (-1) | 1,014 (-4%) | 2mo | $290,000 | $286 | 72 |
| 4372 SW Elaine Ct | 0.47mi | 3/2.0 | 1,056 (0%) | 12mo | $316,000 | $299 | 68 |
| 380 SW Undallo Rd | 0.41mi | 3/2.0 | 1,106 (+5%) | 9mo | $240,100 | $217 | 66 |
| 135 SW Felix Ave | 0.25mi | 3/2.0 | 1,172 (+11%) | 10mo | $349,900 | $299 | 62 |
| 604 SW Columbus Dr | 0.69mi | 3/2.0 | 1,132 (+7%) | 1mo | $354,000 | $313 | 56 |
Match score weights: distance 35% · size 25% · config 20% · recency 20%. Top-matched comps best support the ARV.
Projected returns pro-forma
-3.0% appreciation · 0.22% rent growth · sell at horizon
- IRR
- -11.3%
- Equity multiple
- 0.60×
- Total profit
- $-26,691
- Equity at exit
- $35,770
- IRR
- -7.1%
- Equity multiple
- 0.61×
- Total profit
- $-26,193
- Equity at exit
- $20,742
Cash invested: $67,172 (down + closing). Projections, not guarantees.
Landlord ↔ Tenant lean methodology
- Overall (STATE)
- 87 Strongly Landlord-Friendly
- State Florida
- 87 Strongly Landlord-Friendly · R+3
- County
- — inherits STATE
- City
- — inherits STATE
ZIP-level market 34953
- Home prices YoY
- -10.1%
- Rents YoY
- 0.2%
- Active inventory
- 758
- Price-to-rent
- 7.4×
Monthly cashflow live
- Estimated rent
- $2,697 high interval (Pro) →
- Mortgage (P&I)
- −$1,258
- Tax from tax record
- −$468 /mo · $5,620/yr
- Insurance
- −$100
- HOA
- −$0
- Vacancy / Maint / Mgmt
- −$566
- Net cashflow
- $304
Break-even live
UW: 25.0% down · 7.5% · 30yr · 1.5% tax · 5.0% vac · 8.0% maint · 8.0% mgmt
Financing live
Cash to close
- Down payment
- $59,975
- Closing costs
- $7,197
- Reserves months
- —
- Total cash needed
- —
Loan-product check · same deal, 3 products live
Conventional
25% down · 7.5% · 30yr
- Down + closing
- —
- Monthly P&I
- —
- Monthly cashflow
- —
- DSCR
- —
- Eligible?
- —
Personal DTI + credit; lowest rate.
DSCR
20% down · 8.5% · 30yr
- Down + closing
- —
- Monthly P&I
- —
- Monthly cashflow
- —
- DSCR
- —
- Eligible?
- —
No personal income docs; deal must DSCR.
Hard money
10% down · 12.0% · 12mo
- Down + closing
- —
- Monthly P&I
- —
- Monthly cashflow
- —
- DSCR
- —
- Eligible?
- —
Short-term bridge; refi at stabilization.
Rent comps 7 comps
| Address | Beds | Baths | Sqft | Rent | $/sqft | DOM | Units | Dist |
|---|---|---|---|---|---|---|---|---|
| 223 SW Elderberry Dr Port Saint Lucie, FL | 3.0 | 2.0 | 1231 | $2,200 | $1.79 | 23d | 1 | 0.45mi |
| 149 SW Becker Rd Port Saint Lucie, FL | 3.0 | 2.0 | 1233 | $2,400 | $1.95 | 14d | 1 | 0.89mi |
| 601 SW Icon Ave Port Saint Lucie, FL | 3.0 | 2.0 | 1383 | $2,800 | $2.02 | 21d | 1 | 0.91mi |
| 459 SW Laconic Ave Port Saint Lucie, FL | 3.0 | 2.0 | 1351 | $2,670 | $1.98 | 14d | 1 | 0.97mi |
| 4498 SW Port St Lucie Blvd Port Saint Lucie, FL | 3.0 | 2.5 | 1122 | $2,500 | $2.23 | 23d | 1 | 1.14mi |
| 4262 SW Jared St Port Saint Lucie, FL | 3.0 | 2.0 | 1240 | $2,350 | $1.90 | 23d | 1 | 1.38mi |
| 3912 SW McCrory St Port Saint Lucie, FL | 3.0 | 2.0 | 1159 | $2,350 | $2.03 | 23d | 1 | 1.46mi |
Listing history 19 events
-
2026-06-18days on market $239,900 Active 58 DOM
-
2026-06-17days on market $239,900 Active 57 DOM
-
2026-06-16days on market $239,900 Active 56 DOM
-
2026-06-15days on market $239,900 Active 55 DOM
-
2026-06-14days on market $239,900 Active 53 DOM
-
2026-06-13days on market $239,900 Active 52 DOM
-
2026-06-10days on market $239,900 Active 50 DOM
-
2026-06-09days on market $239,900 Active 49 DOM
-
2026-06-08days on market $239,900 Active 48 DOM
-
2026-06-07days on market $239,900 Active 47 DOM
-
2026-06-05days on market $239,900 Active 44 DOM
-
2026-06-03days on market $239,900 Active 43 DOM
-
2026-06-02days on market $239,900 Active 42 DOM
-
2026-06-01days on market $239,900 Active 41 DOM
-
2026-05-31days on market $239,900 Active 40 DOM
-
2026-05-30days on market $239,900 Active 39 DOM
-
2026-04-20$239,900 Active
Show marketing remark (769 chars)
Opportunity knocks ! This property is truly a blank canvas, offering endless potential for investors, renovators, or buyers looking to customize their dream home. With solid bones and a functional layout, this residence is ready for a full transformation to match today's modern style and finishes. Bring your vision and creativity--this home presents a rare chance to renovate to your exact taste while building equity. Ideal for those seeking a project property with upside potential, whether for resale, rental income, or personal use. Conveniently located near shopping, dining, and major roadways, this property combines location with opportunity. Don't miss your chance to turn this diamond in the rough into something special! all measurements are approximate
-
2026-04-20$239,900 Active 769-char remark
Show marketing remark (769 chars)
Opportunity knocks ! This property is truly a blank canvas, offering endless potential for investors, renovators, or buyers looking to customize their dream home. With solid bones and a functional layout, this residence is ready for a full transformation to match today's modern style and finishes. Bring your vision and creativity--this home presents a rare chance to renovate to your exact taste while building equity. Ideal for those seeking a project property with upside potential, whether for resale, rental income, or personal use. Conveniently located near shopping, dining, and major roadways, this property combines location with opportunity. Don't miss your chance to turn this diamond in the rough into something special! all measurements are approximate
-
1996-07-01soldstatus $66,000
ⓘ Source: listings_history table (triggers on properties + properties_extension) + one-shot
backfill from property_details.listing_events for pre-trigger history.
Tax reassessment forecast FL · Resets to sale price
- Current annual tax
- $5,620 · $468/mo
- Projected year-2 tax
- $5,620 · $468/mo
- Expected delta
- $0/yr ($0/mo · 0.0%)
ⓘ Screening estimate from a state-policy table — verify with the county assessor before closing.
Climate risk First Street
- Flood 1/10 Low FEMA zone X (unshaded) · 0% chance over 30 yrs
- Wildfire 2/10 Low
- Heat 10/10 Extreme 7 d/yr ≥106°F today · 24 d/yr by 30 yrs out
- Wind 10/10 Extreme 99% chance of damaging wind over 30 yrs
- Air quality 1/10 Low 0 unhealthy d/yr today · 0 by 30 yrs out
Nearby sold comps map
Loading sold comps map…
Walkable amenities ~0.75 mi
Loading nearby amenities…
Taxation est. · year 1
- Rental income
- $32,364
- − Mortgage interest
- −$13,438
- − Property taxes
- −$5,620
- − Insurance
- −$1,200
- − Repairs & maintenance
- −$2,589
- − Management
- −$2,589
- − Depreciation
- −$6,979
- Taxable loss
- −$51
- Est. tax savings @ 24.0%
- +$12
- After-tax cash flow
- $3,663/yr
For passive investors: Depreciation is non-cash, so a rental often shows a tax loss while cash-flowing — sheltering income. Rental losses are passive: they offset passive income freely, and up to $25,000/yr can offset ordinary (W-2) income if you actively participate and your MAGI is under $100k (phasing out to $0 by $150k); unused losses carry forward. On sale, claimed depreciation is recaptured at up to 25%, and gains may owe capital-gains tax (a 1031 exchange can defer both). Figures are a year-1 estimate at your 24.0% rate — not tax advice; consult a CPA.
Schools (NCES district)
- District
- St. Lucie
- NCES district ID
- 1201770
- Math proficiency
- 40% ▼ -11.00%
- Reading proficiency
- 48% ▼ -4.00%
- Median HH income
- $44,737
- Composite
- 37.28/100
- National rank
- #4449
- State rank
- #51 of 73 in FL
Livability — Port St. Lucie
No livability data for this city. (Only ~50 U.S. cities are tracked.)
Census & demographics
- Census place
- Port St. Lucie, FL
- County
- Saint Lucie County · 337,150 people
- City population
- 221,051
- Metro
- Port St. Lucie, FL
- Population (ZIP)
- 86,875
- Household income
- $85,667
- Rent vs Own
- Severe rent burden
- 857.0
Population outlook (St. Lucie County) Hauer SSP2
- Today (2025)
- 338,016 people
- By 2030
- 355,687 · +5.2%
- By 2040
- 385,521 · +14.1%
- By 2050
- 406,106 · +20.1%
- By 2075
- 441,054 · +30.5%
- By 2100
- 436,885 · +29.2%
Race, ethnicity, and origin ACS 2023
- Neighborhood character
- Diverse neighborhood (Simpson 0.69)
- Race & ethnicity
- White 42% Hispanic / Latino 28% Black 23% Two or more races 15% Asian 2%
- Hispanic origin (detail)
- Mexican 2% Puerto Rican 8% Cuban 4% Dominican 3%
- Common ancestry
- Hispanic 4% Romanian 2% Estonian 2%
- Foreign-born
- 24% · Canada, Jamaica, China
- Languages at home
- 69% English-only · Spanish 19% French/Haitian/Cajun 6% Other Indo-European 3%
Political lean MEDSL · St. Lucie
- 2024 margin
- Lean R (+9.1) · D 45.1% · R 54.2%
- 2008→2024 swing
- -21.2pp toward R · 2008: 12.1pp · 2024: -9.1pp
- All cycles
- 2024: R+9.1 2020: R+1.6 2016: R+2.5 2012: D+7.9 2008: D+12.1
Not yet ingested
- Civics
- —
Market trends
- HPI YoY
- ▼ -44.19%
- Current HPI
- 392.7681
- Rent YoY
- ▲ 0.22%
- Metro
- Port St. Lucie, FL
- State GDP YoY
- ▲ 3.28%
- F500 in state
- 36
Industry mix (Fortune 500 HQ in FL)
| Industry | F500 HQs | Revenue |
|---|---|---|
| Industrial Technology | 2 | $29B |
|
||
| Insurance | 2 | $17B |
|
||
| Retail | 1 | $60B |
|
||
| Technology Distribution | 1 | $58B |
|
||
| Homebuilding | 1 | $35B |
|
||
| Technology Manufacturing | 1 | $35B |
|
||
Price history
+263.5% since first listed3 events — show timeline
- 2026-04-20 Listed $239,900 SCMLS
- 2026-04-20 Listed $239,900 Beaches MLS
- 1996-07-01 Sold (Public Records) $66,000 Public Records
Property tax history
+16.9%/yrLatest (2025): $5,620 · +6.3% YoY. Source: county tax records.
Cash-flow waterfall
monthlySold comps — $/sqft
last 12 mo · ≤1 miLoading sold comps…