3735 E 6th St · Springfield, FL
Flood risk 3/10 · Minor
- FEMA flood zone
- X (unshaded)
- Chance of flooding over 30 yrs
- 0.1%
- Est. flood insurance / yr
- $507 – $1,088
Fire risk 4/10 · Minor
- Est. fire insurance / yr
- $947 – $1,759
Heat risk 10/10 · Severe
- Hot days now (above 105°F)
- 7 days/yr
- Hot days in 30 yrs
- 20 days/yr
Wind risk 9/10 · Severe
- Chance of severe wind over 30 yrs
- 99.0%
Air-quality risk 1/10 · Minimal
- Unhealthy air days now
- 0 days/yr
- Unhealthy air days in 30 yrs
- 0 days/yr
Risk factors via First Street. Map © Google.
Why this score? — see what drove the C grade
The composite is a weighted blend of 9 inputs, each scored 0–100. Each bar is that input's sub-score; the figure is the points it added to the 100-point composite (weight × sub-score).
- Cash flow +20.5/30.0
- ARV discount +12.5/15.0
- DSCR +6.5/10.0
- 1% rule +5.4/10.0
- Schools +4.3/10.0
- Livability +3.0/5.0
- Rent growth +2.6/5.0
- Condition / age +2.5/5.0
- Appreciation +0.0/10.0
$149,999
🖨 Deal sheet 📄 Offer letter ✓ Due diligence
Listing remarks
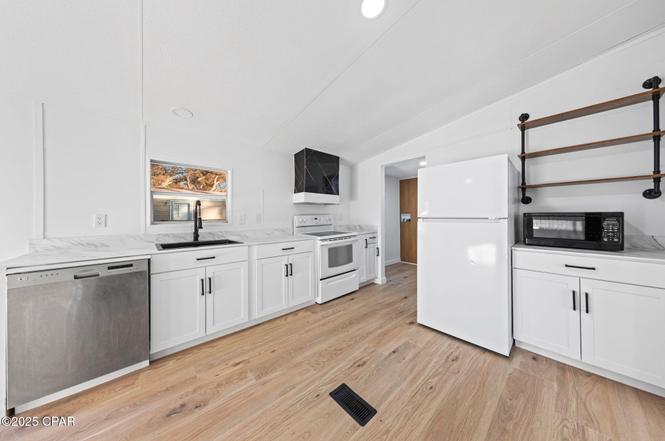
Back on market at no fault of the sellers! This beautifully updated mobile home offers the look and feel of a much newer model at a fraction of the cost. The home has been thoughtfully refreshed throughout and is completely move-in ready. Recent improvements include an updated kitchen, refreshed flooring throughout, renovated bathrooms, new sod, updated stairs, and a newly built deck. The home also features a newer metal roof, and the HVAC system has been recently serviced for added comfort and reliability. With modern finishes, a clean and well-maintained interior, and no major projects left to tackle, this property presents a great opportunity to own a turnkey home without the expense of
Key facts
- Pex plumbing
- Brand new kitchen
- New sod
Tags
Property features AI
Finance
- HOA & community: Short-term rentals allowed
Exterior
- Home design: Single-story (first floor entry)
- Exterior features: Lot dimensions approximately 50 x 108 feet
Interior
- Kitchen: Kitchen on the first floor
- Bedrooms: Primary bedroom on the first floor
- Bathrooms: 2 full bathrooms
- Interior features: Living room; Kitchen; Primary bedroom
Neighborhood map
What this means for you Summary
Snapshot
- This is a 3-bed/2.0-bath manufactured listed at $150k.
Deal economics
- At list price, monthly cash flow is $199 ($2k/yr) — positive.
- The deal already cash-flows at list — no discount required.
- Meets the 1% rule at list price ($2k rent vs $150k).
- Recommended offer: $148k (1.5% below list) — sets the bar for market timing.
- Cap rate 7.9% vs local median 4.7% in Springfield — top-decile yield for the area; either an underpriced asset or a hidden risk that comps aren't pricing in. Stress-test before assuming the spread holds.
Location & tenants
- Location reads 59/100 on livability (#826 in FL) — a working-class tenant base; expect higher turnover. Strengths: cost of living A+, housing A+, health & safety A+; Watch: schools D, employment D, crime F.
- Bay (suburban): math 51% / reading 51% proficiency, ranked #29 of 73 in FL (top 40%) — acceptable for families but not a draw, mixed tenant base, ~2y average lease.
- Market conditions: Rents flat; 258 active listings in the ZIP; 19 comparable units currently listed for rent nearby; rentals at typical pace (median 21d on market — plan ~3-4 weeks tenant-placement turnaround); 2,473 units permitted in Bay County in 2024 (559 in 5+ unit buildings).
- This rent runs 36% of the median local income ($53k/yr) — at the standard rent-burdened threshold; future hikes will face affordability resistance.
Forward outlook
- Local home prices are declining (-3.0%/yr); year-one equity from $1k of loan paydown is wiped out by about $4k of value loss. Plan a longer hold.
- Bay County population projected at +24% by 2050 — long-run rental-demand tailwind backs the buy-and-hold thesis.
Negotiation context
- It's been on market 20 days — a 2% lower offer ($148k) is reasonable based on typical stale-listing flexibility.
- 5 sale attempts since 20y ago with the ask held roughly flat each time — persistent listings suggest the price (not the market) is what's stuck; bring a comps-based counter.
- Current owner paid $62k; list at $150k implies a 140% gain — meaningful room to come down on a strong offer.
Risks & watch-outs
- Climate carrying-cost: severe wind risk, 99% chance of damaging wind over 30y; extreme-heat days projected 7→20/yr by 2055 (HVAC capex compounding) — expect insurance premiums to compound above CPI over the hold.
Questions for the listing agent
- Is there a deadline driving the sale (1031 exchange, divorce, estate, relocation)? That informs how much negotiation room exists.
- Schools are D-rated, which usually means shorter tenancies and higher turnover. Who's the typical renter profile here, and what's been the actual vacancy rate?
- Crime grade is F in this area — have there been break-ins, vandalism, or insurance claims at this property in the last 3 years? What carrier currently insures it and at what premium?
- What's the average days-on-market for RENTAL listings here right now (not sales)? A rising rental-DOM trend means longer vacancies and softer asking-rent achievability than the comps imply.
- What's the recent tenant-quality profile in this submarket — average credit score on applications, eviction rate, late-payment / NSF rate, and stable-employment percentage? A property-management company in the area should have these aggregated.
- How much new for-sale + rental construction is in the pipeline within 1–3 miles? Heavy new supply typically softens prices + rents 12–24 months out; constrained supply supports both.
Investment metrics
- 1% rule
- 1.04% ✓
- Cap rate
- 7.88%
- Cash-on-cash
- 5.68%
- DSCR
- 1.25
- GRM
- 8.0
CMA / ARV
- ARV (on-the-fly)
- $168,636
- Comps found
- 3
Show comp detail 3 sales within ~0.75 mi
| Address | Dist | Beds/Ba | Sqft | Sold | Price | $/sf | Match |
|---|---|---|---|---|---|---|---|
| 707 Sanders Ln | 0.19mi | 2/2.0 (-1) | 1,064 (-11%) | 10mo | $155,000 | $146 | 59 |
| 4031 E 8th St | 0.50mi | 3/2.0 | 1,232 (+3%) | 17mo | $80,000 | $65 | 57 |
| 3713 E 4th Street St | 0.26mi | 3/2.0 | 1,352 (+13%) | 12mo | $190,000 | $141 | 56 |
Match score weights: distance 35% · size 25% · config 20% · recency 20%. Top-matched comps best support the ARV.
Projected returns pro-forma
-3.0% appreciation · 0.45% rent growth · sell at horizon
- IRR
- -10.4%
- Equity multiple
- 0.63×
- Total profit
- $-15,543
- Equity at exit
- $22,365
- IRR
- -5.1%
- Equity multiple
- 0.70×
- Total profit
- $-12,402
- Equity at exit
- $12,969
Cash invested: $42,000 (down + closing). Projections, not guarantees.
Landlord ↔ Tenant lean methodology
- Overall (STATE)
- 87 Strongly Landlord-Friendly
- State Florida
- 87 Strongly Landlord-Friendly · R+3
- County
- — inherits STATE
- City
- — inherits STATE
ZIP-level market 32401
- Home prices YoY
- -32.9%
- Rents YoY
- 0.5%
- Active inventory
- 258
- Price-to-rent
- 8.0×
Monthly cashflow live
- Estimated rent
- $1,564 high interval (Pro) →
- Mortgage (P&I)
- −$787
- Tax est. 1.5%
- −$187 /mo · $2,250/yr
- Insurance
- −$62
- HOA
- −$0
- Vacancy / Maint / Mgmt
- −$328
- Net cashflow
- $199
Break-even live
UW: 25.0% down · 7.5% · 30yr · 1.5% tax · 5.0% vac · 8.0% maint · 8.0% mgmt
Financing live
Cash to close
- Down payment
- $37,500
- Closing costs
- $4,500
- Reserves months
- —
- Total cash needed
- —
Loan-product check · same deal, 3 products live
Conventional
25% down · 7.5% · 30yr
- Down + closing
- —
- Monthly P&I
- —
- Monthly cashflow
- —
- DSCR
- —
- Eligible?
- —
Personal DTI + credit; lowest rate.
DSCR
20% down · 8.5% · 30yr
- Down + closing
- —
- Monthly P&I
- —
- Monthly cashflow
- —
- DSCR
- —
- Eligible?
- —
No personal income docs; deal must DSCR.
Hard money
10% down · 12.0% · 12mo
- Down + closing
- —
- Monthly P&I
- —
- Monthly cashflow
- —
- DSCR
- —
- Eligible?
- —
Short-term bridge; refi at stabilization.
Rent comps 19 comps
| Address | Beds | Baths | Sqft | Rent | $/sqft | DOM | Units | Dist |
|---|---|---|---|---|---|---|---|---|
| 3719 E 8th Ct Panama City, FL | 1.0–4.0 | 1.0–1.5 | 950 | $1,300 | $1.37 | 21d | 1 | 0.43mi |
| 237 Helen Ave Panama City, FL | 2.0 | 2.0 | 1000 | $1,395 | $1.40 | 21d | 1 | 0.51mi |
| 3914 E 11th St #301 Panama City, FL | 2.0 | 2.0 | 864 | $1,000 | $1.16 | 21d | 1 | 0.63mi |
| 4905 Alameda St Unit 1 Panama City, FL | 3.0 | 2.0 | 942 | $1,295 | $1.37 | 21d | 1 | 0.74mi |
| 906 Kevin Ct Panama City, FL | 3.0 | 2.0 | 1266 | $1,795 | $1.42 | 21d | 1 | 0.76mi |
| 5101 Willow St Panama City, FL | 3.0 | 2.0 | 1099 | $1,500 | $1.36 | 13d | 1 | 0.88mi |
| 5117 E 10th St Unit D Panama City, FL | 2.0 | 1.5 | 950 | $1,250 | $1.32 | 13d | 1 | 0.89mi |
| 5117 E 10th St Apt A Panama City, FL | 2.0 | 1.5 | 936 | $1,200 | $1.28 | 13d | 1 | 0.89mi |
| 208 North Highway 22 A Unit 33 Panama City, FL | 3.0 | 2.0 | 1080 | $1,350 | $1.25 | 21d | 1 | 0.94mi |
| 149 North Highway 22 A Unit 5 Panama City, FL | 2.0 | 1.0 | 900 | $1,140 | $1.27 | 13d | 1 | 0.98mi |
| 1401 Transmitter Rd Unit 15 Panama City, FL | 3.0 | 2.0 | 1100 | $1,395 | $1.27 | 13d | 1 | 0.99mi |
| 526 Camellia Ave Panama City, FL | 3.0 | 2.0 | 1375 | $1,950 | $1.42 | 21d | 1 | 1.03mi |
| 129 Seneca Ave Panama City, FL | 3.0 | 2.0 | 1449 | $1,495 | $1.03 | 13d | 1 | 1.20mi |
| 420 Raven Ln Panama City, FL | 3.0 | 2.0 | 1251 | $1,750 | $1.40 | 21d | 1 | 1.24mi |
| 5115 E 14th St Unit 3 Panama City, FL | 2.0 | 2.0 | 978 | $1,250 | $1.28 | 21d | 1 | 1.26mi |
| 4837 S Lakewood Dr Panama City, FL | 2.0 | 1.5 | 1116 | $1,500 | $1.34 | 21d | 1 | 1.42mi |
| 725 Sherman Ave Unit B Panama City, FL | 3.0 | 1.0 | 878 | $1,250 | $1.42 | 21d | 1 | 1.45mi |
| 229 Callaway Chase Ln Panama City, FL | 3.0 | 2.5 | 1200 | $1,650 | $1.38 | 13d | 1 | 1.45mi |
| 4141 E 15th St Panama City, FL | 2.0–3.0 | 2.0 | 1082 | $1,825 | $1.69 | 13d | 9 | 1.46mi |
Listing history 17 events
-
2026-04-30status Pending
-
2026-04-20price $149,999
-
2026-04-15price $154,999
-
2026-04-14status Active
-
2026-02-27price $155,000
-
2025-12-26historical Active Under Contract
-
2025-12-26price $152,500
-
2025-12-23$149,999 Active
-
2025-11-26soldstatus $62,500
-
2024-06-07historical
-
2024-05-06price $110,000
-
2024-04-23$115,000 Active
-
2021-12-09historical
-
2007-07-05soldstatus $65,000
-
2007-06-29soldstatus $65,000
-
2007-01-03$69,900
-
2006-06-29$60,000
ⓘ Source: listings_history table (triggers on properties + properties_extension) + one-shot
backfill from property_details.listing_events for pre-trigger history.
Climate risk First Street
- Flood 3/10 Moderate FEMA zone X (unshaded) · 10% chance over 30 yrs
- Wildfire 4/10 Moderate
- Heat 10/10 Extreme 7 d/yr ≥105°F today · 20 d/yr by 30 yrs out
- Wind 9/10 Extreme 99% chance of damaging wind over 30 yrs
- Air quality 1/10 Low 0 unhealthy d/yr today · 0 by 30 yrs out
Nearby sold comps map
Loading sold comps map…
Walkable amenities ~0.75 mi
Loading nearby amenities…
Taxation est. · year 1
- Rental income
- $18,763
- − Mortgage interest
- −$8,402
- − Property taxes
- −$2,250
- − Insurance
- −$750
- − Repairs & maintenance
- −$1,501
- − Management
- −$1,501
- − Depreciation
- −$4,364
- Taxable loss
- −$5
- Est. tax savings @ 24.0%
- +$1
- After-tax cash flow
- $2,385/yr
For passive investors: Depreciation is non-cash, so a rental often shows a tax loss while cash-flowing — sheltering income. Rental losses are passive: they offset passive income freely, and up to $25,000/yr can offset ordinary (W-2) income if you actively participate and your MAGI is under $100k (phasing out to $0 by $150k); unused losses carry forward. On sale, claimed depreciation is recaptured at up to 25%, and gains may owe capital-gains tax (a 1031 exchange can defer both). Figures are a year-1 estimate at your 24.0% rate — not tax advice; consult a CPA.
Schools (NCES district)
- District
- Bay
- NCES district ID
- 1200090
- Math proficiency
- 51% ▼ -8.00%
- Reading proficiency
- 51% ▼ -7.00%
- Median HH income
- $47,740
- Composite
- 43.41/100
- National rank
- #3014
- State rank
- #29 of 73 in FL
Livability — Springfield
- Score
- 59/100
- State rank
- #826
- US rank
- #20265
Category grades
Schools grade is shown separately in the Schools card above.
Census & demographics
- Census place
- Springfield, FL
- County
- Bay County · 163,593 people
- Metro
- Panama City, FL
- Population (ZIP)
- 18,947
- Household income
- $52,523
- Rent vs Own
- Severe rent burden
- 935.0
Population outlook (Bay County) Hauer SSP2
- Today (2025)
- 206,264 people
- By 2030
- 217,740 · +5.6%
- By 2040
- 238,738 · +15.7%
- By 2050
- 255,545 · +23.9%
- By 2075
- 288,295 · +39.8%
- By 2100
- 288,638 · +39.9%
Race, ethnicity, and origin ACS 2023
- Neighborhood character
- Diverse neighborhood (Simpson 0.57)
- Race & ethnicity
- White 60% Black 23% Hispanic / Latino 11% Two or more races 8% Asian 2%
- Hispanic origin (detail)
- Mexican 5% Puerto Rican 2%
- Common ancestry
- Italian 2% Lithuanian 2% Slovak 2%
- Foreign-born
- 9% · Canada, Vietnam
- Languages at home
- 89% English-only · Spanish 8% Other Indo-European 1% German/W. Germanic 1%
Political lean MEDSL · Bay
- 2024 margin
- Solid R (+47.4) · D 25.8% · R 73.1% · Other 1.1%
- 2008→2024 swing
- -6.6pp toward R · 2008: -40.7pp · 2024: -47.4pp
- All cycles
- 2024: R+47.4 2020: R+43.5 2016: R+46.3 2012: R+43.6 2008: R+40.7
Not yet ingested
- Civics
- —
Market trends
- HPI YoY
- ▼ -142.12%
- Current HPI
- 290.3312
- Rent YoY
- ▲ 0.45%
- Metro
- Panama City, FL
- State GDP YoY
- ▲ 3.28%
- F500 in state
- 36
Industry mix (Fortune 500 HQ in FL)
| Industry | F500 HQs | Revenue |
|---|---|---|
| Industrial Technology | 2 | $29B |
|
||
| Insurance | 2 | $17B |
|
||
| Retail | 1 | $60B |
|
||
| Technology Distribution | 1 | $58B |
|
||
| Homebuilding | 1 | $35B |
|
||
| Technology Manufacturing | 1 | $35B |
|
||
Price history
+150.0% since first listed17 events — show timeline
- 2026-04-30 Pending — CPARMLS
- 2026-04-20 Price Changed $149,999 CPARMLS
- 2026-04-15 Price Changed $154,999 CPARMLS
- 2026-04-14 Relisted — CPARMLS
- 2026-02-27 Price Changed $155,000 CPARMLS
- 2025-12-26 Contingent — CPARMLS
- 2025-12-26 Price Changed $152,500 CPARMLS
- 2025-12-23 Listed $149,999 CPARMLS
- 2025-11-26 Sold (Public Records) $62,500 Public Records
- 2024-06-07 Listing Removed — CPARMLS
- 2024-05-06 Price Changed $110,000 CPARMLS
- 2024-04-23 Listed $115,000 CPARMLS
- 2021-12-09 Listing Removed — CPARMLS
- 2007-07-05 Sold (Public Records) $65,000 Public Records
- 2007-06-29 Sold (MLS) $65,000 CPARMLS
- 2007-01-03 Listed $69,900 CPARMLS
- 2006-06-29 Listed $60,000 CPARMLS
Property tax history
-5.2%/yrLatest (2025): $171 · +6.0% YoY. Source: county tax records.
Cash-flow waterfall
monthlySold comps — $/sqft
last 12 mo · ≤1 miLoading sold comps…