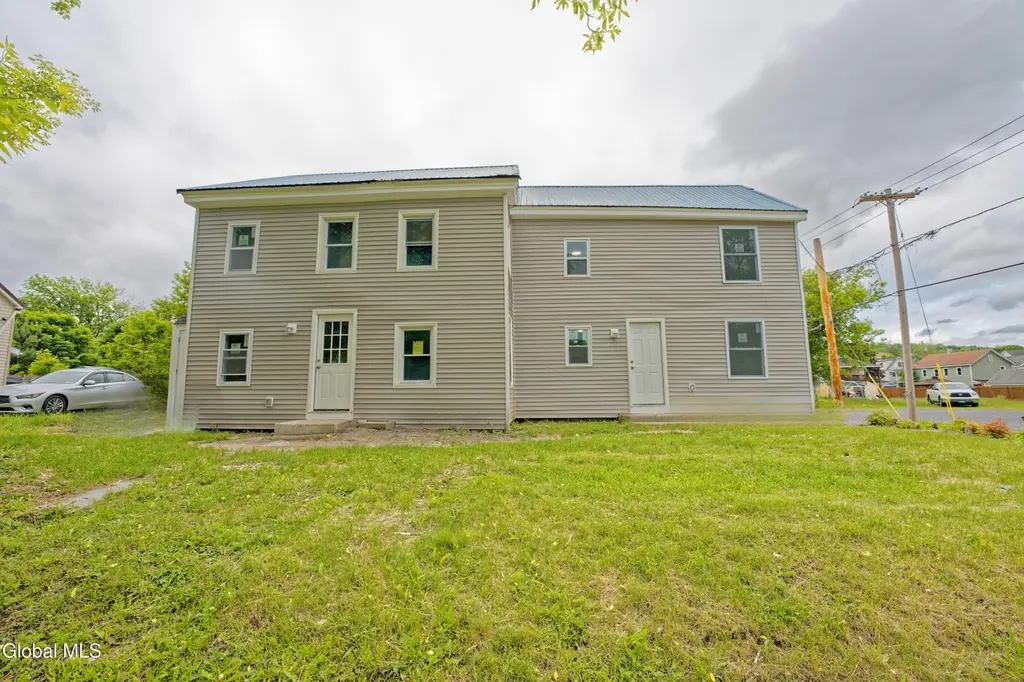
 Duplex
99 Railroad Ave · Hoosick Falls, NY
Flood risk 1/10 · Minimal
- FEMA flood zone
- X (unshaded)
- Chance of flooding over 30 yrs
- 0.0%
- Est. flood insurance / yr
- $473 – $860
Fire risk 3/10 · Minor
- Est. fire insurance / yr
- $691 – $1,283
Heat risk 3/10 · Minor
- Hot days now (above 93°F)
- 7 days/yr
- Hot days in 30 yrs
- 16 days/yr
Wind risk 3/10 · Minor
- Chance of severe wind over 30 yrs
- 6.0%
Air-quality risk 2/10 · Minimal
- Unhealthy air days now
- 1 days/yr
- Unhealthy air days in 30 yrs
- 1 days/yr
Risk factors via First Street. Map © Google.
Why this score? — see what drove the C+ grade
The composite is a weighted blend of 9 inputs, each scored 0–100. Each bar is that input's sub-score; the figure is the points it added to the 100-point composite (weight × sub-score).
- Cash flow +24.5/30.0
- DSCR +7.9/10.0
- 1% rule +6.3/10.0
- Appreciation +5.5/10.0
- Schools +4.4/10.0
- ARV discount +3.6/15.0
- Livability +3.6/5.0
- Rent growth +2.5/5.0
- Condition / age +2.5/5.0
$250,000
🖨 Deal sheet 📄 Offer letter ✓ Due diligence
Multi-family units
County records classify this as Multi-Family (2-4 Unit). Listing-text estimate: 2 units. confirmed
Listing remarks MLS
Discover this renovated 2-family home offering 1,920 sq ft, 6 bedrooms, and 3 bathrooms—perfect for investors or owner-occupants seeking rental income. Potential cash cow with 1300-1600 per unit! Each unit features spacious rooms and a functional layout. Set on a 4,699 sq ft lot with an attached garage, the property is conveniently located near shops, schools, and parks in the heart of Hoosick Falls. A great opportunity to own a nice income producing property!
Key facts
- 5,227 sq ft lot
- Garage
- Built 1870
Neighborhood map
What this means for you Summary
Snapshot
- This is a 2 × 3-bed/1.5-bath units multifamily listed at $250k.
Deal economics
- At list price, monthly cash flow is $513 ($6k/yr) — positive. Per door: $256/mo.
- The deal already cash-flows at list — no discount required.
- Meets the 1% rule at list price ($3k rent vs $250k).
- Recommended offer: $220k (12.0% below list) — sets the bar for market timing.
- Cap rate 8.8% vs local median 4.7% in Hoosick Falls — top-decile yield for the area; either an underpriced asset or a hidden risk that comps aren't pricing in. Stress-test before assuming the spread holds.
Location & tenants
- Location reads 72/100 on livability (#371 in NY) — a middle-class / working-renter tenant base. Strengths: housing A+, health & safety A+, cost of living A; Watch: amenities F, commute F.
- Hoosick Falls Central School District (rural): math 52% / reading 46% proficiency, ranked #469 of 755 in NY (top 62%) — families likely to look elsewhere, expect single-tenant / working-renter base with shorter leases.
- Market conditions: 49 active listings in the ZIP; 405 units permitted in Rensselaer County in 2024 (224 in 5+ unit buildings).
Forward outlook
- In year one you build about $4k of equity ($2k loan paydown + $3k appreciation (1.0% local appreciation)).
- Rensselaer County population projected to shrink 6% by 2050 — rents likely to lag national; underwrite the cash flow, not the appreciation.
- At projected returns (1.0% appreciation + 3.0% rent growth), your $70k cash investment doubles in ~6 years — after that, you're playing with house money.
- By year 8, paydown + projected appreciation supports a ~$34k cash-out refi (75% LTV) — recoverable capital for the next deal without selling this one.
Negotiation context
- It's been on market 206 days — a 12% lower offer ($220k) is reasonable based on typical stale-listing flexibility.
- Current owner paid $35k; list at $250k implies a 614% gain — meaningful room to come down on a strong offer.
Risks & watch-outs
- Watch-outs: built in 1870 — expect roof / HVAC / electrical / plumbing capex.
Questions for the listing agent
- It's been on market 206 days. Have you received any prior offers? Is the seller open to a 12% concession, seller financing, or rate buy-down credit?
- Can we see the unit-by-unit rent roll, current vacancy, and any below-market leases? What's the average tenancy length?
- What capital expenditures (roof, boiler, parking lot, exteriors) have been made in the last 5 years, and what's planned in the next 2?
- Built in 1870 — when were the roof, HVAC, electrical panel, plumbing, and water heater last replaced?
- Why hasn't it sold? Are there any deal-killer items the seller is aware of (foundation, flood, title, zoning, code violations)?
- Is there a deadline driving the sale (1031 exchange, divorce, estate, relocation)? That informs how much negotiation room exists.
- What's the average days-on-market for RENTAL listings here right now (not sales)? A rising rental-DOM trend means longer vacancies and softer asking-rent achievability than the comps imply.
- What's the recent tenant-quality profile in this submarket — average credit score on applications, eviction rate, late-payment / NSF rate, and stable-employment percentage? A property-management company in the area should have these aggregated.
- How much new apartment / multifamily construction is in the pipeline within 1–3 miles? Heavy new supply (>2% of stock underway) typically softens rents 12–24 months out; light construction supports rent growth.
Investment metrics
- 1% rule
- 1.13% ✓
- Cap rate
- 8.75%
- Cash-on-cash
- 8.79%
- DSCR
- 1.39
- GRM
- 7.4
CMA / ARV
- ARV (median comp)
- $229,859
- List price
- $250,000
- Delta
- 8.76%
- Verdict
- FAIR
- Comps
- 20 within 1.0 mi
Projected returns pro-forma
1.02% appreciation · 3.0% rent growth · sell at horizon
- IRR
- 10.6%
- Equity multiple
- 1.54×
- Total profit
- $37,610
- Equity at exit
- $85,610
- IRR
- 14.4%
- Equity multiple
- 2.75×
- Total profit
- $122,205
- Equity at exit
- $113,973
Cash invested: $70,000 (down + closing). Projections, not guarantees.
Landlord ↔ Tenant lean methodology
- Overall (STATE)
- 15 Strongly Tenant-Friendly
- State New York
- 15 Strongly Tenant-Friendly · D+10
- County
- — inherits STATE
- City
- — inherits STATE
ZIP-level market 12090
- Home prices YoY
- 0.5%
- Active inventory
- 49
- Price-to-rent
- 14.7×
Monthly cashflow live
- Estimated rent
- $2,832 medium interval (Pro) →
- Mortgage (P&I)
- −$1,311
- Tax from tax record
- −$310 /mo · $3,714/yr
- Insurance
- −$104
- HOA
- −$0
- Vacancy / Maint / Mgmt
- −$595
- Net cashflow
- $513
Break-even live
2-unit breakdown (identical units grouped — click to expand)
| Units | Beds | Baths | Est. rent |
|---|---|---|---|
| 2× units | 3 | 1.5 | $2,832 |
| #1 | 3 | 1.5 | $1,416 |
| #2 | 3 | 1.5 | $1,416 |
| Total (2 units) | $2,832 | ||
UW: 25.0% down · 7.5% · 30yr · 1.5% tax · 5.0% vac · 8.0% maint · 8.0% mgmt
Financing live
Cash to close
- Down payment
- $62,500
- Closing costs
- $7,500
- Reserves months
- —
- Total cash needed
- —
Loan-product check · same deal, 3 products live
Conventional
25% down · 7.5% · 30yr
- Down + closing
- —
- Monthly P&I
- —
- Monthly cashflow
- —
- DSCR
- —
- Eligible?
- —
Personal DTI + credit; lowest rate.
DSCR
20% down · 8.5% · 30yr
- Down + closing
- —
- Monthly P&I
- —
- Monthly cashflow
- —
- DSCR
- —
- Eligible?
- —
No personal income docs; deal must DSCR.
Hard money
10% down · 12.0% · 12mo
- Down + closing
- —
- Monthly P&I
- —
- Monthly cashflow
- —
- DSCR
- —
- Eligible?
- —
Short-term bridge; refi at stabilization.
Listing history 17 events
-
2026-06-19days on market $250,000 Active 206 DOM
-
2026-06-18days on market $250,000 Active 205 DOM
-
2026-06-17days on market $250,000 Active 204 DOM
-
2026-06-16days on market $250,000 Active 203 DOM
-
2026-06-15days on market $250,000 Active 202 DOM
-
2026-06-14days on market $250,000 Active 200 DOM
-
2026-06-12days on market $250,000 Active 199 DOM
-
2026-06-09days on market $250,000 Active 196 DOM
-
2026-06-08days on market $250,000 Active 195 DOM
-
2026-06-07days on market $250,000 Active 194 DOM
-
2026-06-04days on market $250,000 Active 190 DOM
-
2026-06-02days on market $250,000 Active 189 DOM
-
2026-06-01days on market $250,000 Active 188 DOM
-
2026-05-31days on market $250,000 Active 187 DOM
-
2026-05-31days on market $250,000 Active 186 DOM
-
2025-11-25$250,000 Active 470-char remark
Show marketing remark (470 chars)
Discover this renovated 2-family home offering 1,920 sq ft, 6 bedrooms, and 3 bathrooms—perfect for investors or owner-occupants seeking rental income. Potential cash cow with 1300-1600 per unit! Each unit features spacious rooms and a functional layout. Set on a 4,699 sq ft lot with an attached garage, the property is conveniently located near shops, schools, and parks in the heart of Hoosick Falls. A great opportunity to own a nice income producing property!
-
2024-08-30soldstatus $35,000
ⓘ Source: listings_history table (triggers on properties + properties_extension) + one-shot
backfill from property_details.listing_events for pre-trigger history.
Tax reassessment forecast NY · Partial reset (capped growth)
- Current annual tax
- $3,714 · $310/mo
- Projected year-2 tax
- $3,970 · $331/mo
- Expected delta
- +$255/yr (+$21/mo · 6.9%)
ⓘ Screening estimate from a state-policy table — verify with the county assessor before closing.
Climate risk First Street
- Flood 1/10 Low FEMA zone X (unshaded) · 0% chance over 30 yrs
- Wildfire 3/10 Moderate
- Heat 3/10 Moderate 7 d/yr ≥93°F today · 16 d/yr by 30 yrs out
- Wind 3/10 Moderate 6% chance of damaging wind over 30 yrs
- Air quality 2/10 Low 1 unhealthy d/yr today · 1 by 30 yrs out
Nearby sold comps map
Loading sold comps map…
Walkable amenities ~0.75 mi
Loading nearby amenities…
Taxation est. · year 1
- Rental income
- $33,984
- − Mortgage interest
- −$14,004
- − Property taxes
- −$3,714
- − Insurance
- −$1,250
- − Repairs & maintenance
- −$2,719
- − Management
- −$2,719
- − Depreciation
- −$7,273
- Taxable income
- $2,306
- Est. tax owed @ 24.0%
- −$553
- After-tax cash flow
- $5,597/yr
For passive investors: Depreciation is non-cash, so a rental often shows a tax loss while cash-flowing — sheltering income. Rental losses are passive: they offset passive income freely, and up to $25,000/yr can offset ordinary (W-2) income if you actively participate and your MAGI is under $100k (phasing out to $0 by $150k); unused losses carry forward. On sale, claimed depreciation is recaptured at up to 25%, and gains may owe capital-gains tax (a 1031 exchange can defer both). Figures are a year-1 estimate at your 24.0% rate — not tax advice; consult a CPA.
Schools (NCES district)
- District
- Hoosick Falls Central School District
- NCES district ID
- 3614760
- Math proficiency
- 52% ▲ 5.00%
- Reading proficiency
- 46% ▬ 0.00%
- Median HH income
- $54,349
- Composite
- 44.44/100
- National rank
- #6093
- State rank
- #469 of 755 in NY
Livability — Hoosick Falls
- Score
- 72/100
- State rank
- #371
- US rank
- #6412
Category grades
Schools grade is shown separately in the Schools card above.
Census & demographics
- Census place
- Hoosick Falls, NY
- Population (ZIP)
- 5,874
Population outlook (Rensselaer County) Hauer SSP2
- Today (2025)
- 162,400 people
- By 2030
- 161,746 · -0.4%
- By 2040
- 158,095 · -2.7%
- By 2050
- 152,966 · -5.8%
- By 2075
- 140,767 · -13.3%
- By 2100
- 124,727 · -23.2%
Race, ethnicity, and origin ACS 2023
- Neighborhood character
- Predominantly White (93%)
- Race & ethnicity
- White 93% Hispanic / Latino 5% Two or more races 2%
- Common ancestry
- Romanian 6% Lithuanian 5% Iranian 3%
- Foreign-born
- 2% · Canada
- Languages at home
- 94% English-only · Spanish 2% German/W. Germanic 1% Russian/Polish/Slavic 1%
Political lean MEDSL · Rensselaer
- 2024 margin
- Toss-up / Even · D 50.7% · R 49.3%
- 2008→2024 swing
- -8.0pp toward R · 2008: 9.3pp · 2024: 1.4pp
- All cycles
- 2024: D+1.4 2020: D+5.6 2016: R+2.9 2012: D+11.8 2008: D+9.3
Not yet ingested
- Civics
- —
Market trends
- HPI YoY
- ▲ 1.02%
- Current HPI
- 218.9096
- Rent YoY
- —
- Metro
- —
- State GDP YoY
- ▲ 2.60%
- F500 in state
- 92
Industry mix (Fortune 500 HQ in NY)
| Industry | F500 HQs | Revenue |
|---|---|---|
| Financial Services | 10 | $950B |
|
||
| Consumer Goods | 9 | $162B |
|
||
| Insurance | 4 | $225B |
|
||
| Telecommunications | 2 | $144B |
|
||
| Pharmaceuticals | 2 | $112B |
|
||
| Media / Entertainment | 2 | $69B |
|
||
Price history
+614.3% since first listed2 events — show timeline
- 2025-11-25 Listed $250,000 Global MLS
- 2024-08-30 Sold (Public Records) $35,000 Public Records
Property tax history
+3.4%/yrLatest (2025): $3,714 · -14.7% YoY. Source: county tax records.
Cash-flow waterfall
monthlySold comps — $/sqft
last 12 mo · ≤1 miLoading sold comps…