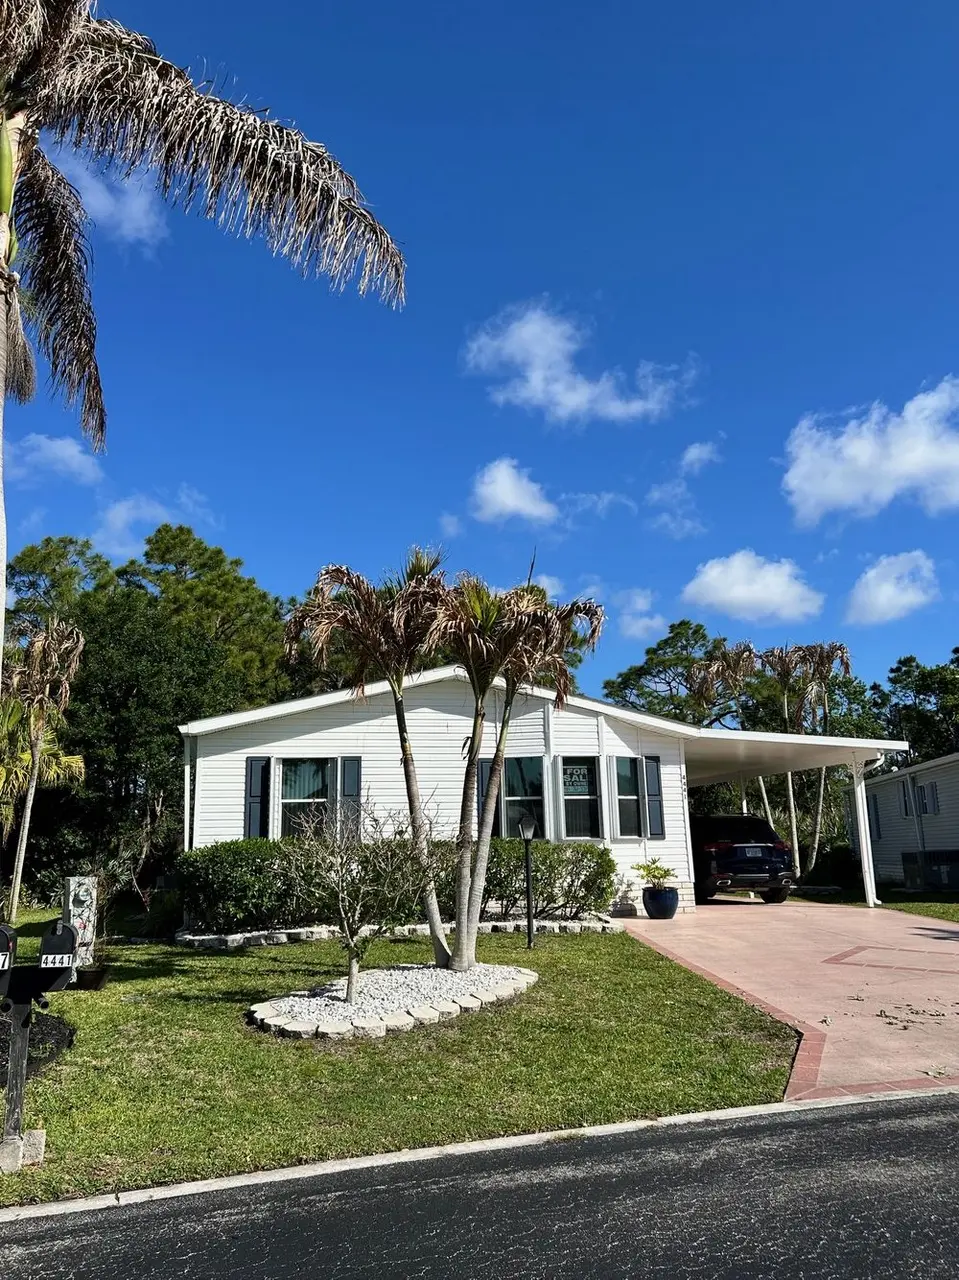
4441 Heartwood Trl · Port Salerno, FL
Flood risk 1/10 · Minimal
- FEMA flood zone
- X (unshaded)
- Chance of flooding over 30 yrs
- 0.0%
- Est. flood insurance / yr
- $507 – $1,088
Fire risk 4/10 · Minor
- Est. fire insurance / yr
- $947 – $1,759
Heat risk 10/10 · Severe
- Hot days now (above 106°F)
- 7 days/yr
- Hot days in 30 yrs
- 23 days/yr
Wind risk 10/10 · Severe
- Chance of severe wind over 30 yrs
- 99.0%
Air-quality risk 2/10 · Minimal
- Unhealthy air days now
- 1 days/yr
- Unhealthy air days in 30 yrs
- 1 days/yr
Risk factors via First Street. Map © Google.
Why this score? — see what drove the B grade
The composite is a weighted blend of 9 inputs, each scored 0–100. Each bar is that input's sub-score; the figure is the points it added to the 100-point composite (weight × sub-score).
- Cash flow +30.0/30.0
- DSCR +10.0/10.0
- 1% rule +9.5/10.0
- ARV discount +7.5/15.0
- Schools +4.5/10.0
- Condition / age +3.8/5.0
- Livability +3.5/5.0
- Rent growth +3.2/5.0
- Appreciation +0.0/10.0
$169,000
🖨 Deal sheet 📄 Offer letter ✓ Due diligence
Listing remarks
Welcome to peaceful easy living on the Treasure Coast! This lovely, spacious, clean and well-maintained, furnished home is at the back of the community and sits on a spacious lot that backs up to quiet and serene nature. New roof is being installed in 2 weeks! Experience a private screened lanai backing onto the preserve, which is perfect for grilling, dining, and relaxing with a cocktail. Additionally, this shaded area provides gentle breezes allowing for year-round enjoyment. This home features 3 bedrooms/2 full bathrooms. The substantial primary bedroom has a walk-in closet with space for all your clothes and more. The ensuite bathroom is large and has lots of cabinets and shelving for
Key facts
- Fitness center
- Pickleball courts
- Whirlpool spas
Tags
Neighborhood map
What this means for you Summary
Snapshot
- This is a 3-bed/2.0-bath single-family listed at $169k. Condition is rated good.
Deal economics
- At list price, monthly cash flow is $769 ($9k/yr) — positive.
- The deal already cash-flows at list — no discount required.
- Meets the 1% rule at list price ($2k rent vs $169k).
- Cap rate 11.8% vs local median 3.1% in Port Salerno — top-decile yield for the area; either an underpriced asset or a hidden risk that comps aren't pricing in. Stress-test before assuming the spread holds.
Location & tenants
- Location reads 70/100 on livability (#440 in FL) — a middle-class / working-renter tenant base. Strengths: housing A+, crime A, health & safety A; Watch: schools D, amenities F, commute F.
- Martin (suburban): math 52% / reading 53% proficiency, ranked #24 of 73 in FL (top 33%) — acceptable for families but not a draw, mixed tenant base, ~2y average lease.
- Market conditions: Rents rising (+2.7%/yr); 588 active listings in the ZIP; 20 comparable units currently listed for rent nearby; rentals at typical pace (median 24d on market — plan ~3-4 weeks tenant-placement turnaround); solid renter incomes; 737 units permitted in Martin County in 2024 (167 in 5+ unit buildings).
- This rent runs 38% of the median local income ($78k/yr) — at the standard rent-burdened threshold; future hikes will face affordability resistance.
Forward outlook
- Local home prices are declining (-3.0%/yr); year-one equity from $1k of loan paydown is wiped out by about $5k of value loss. Plan a longer hold.
- Martin County population projected at +19% by 2050 — long-run rental-demand tailwind backs the buy-and-hold thesis.
- At projected returns (-3.0% appreciation + 2.7% rent growth), your $47k cash investment doubles in ~7 years — after that, you're playing with house money.
Negotiation context
- Only 14 days on market — expect competitive offers; lowballing is unlikely to land.
Risks & watch-outs
- Climate carrying-cost: severe wind risk, 99% chance of damaging wind over 30y; extreme-heat days projected 7→23/yr by 2055 (HVAC capex compounding) — expect insurance premiums to compound above CPI over the hold.
Questions for the listing agent
- Is there a deadline driving the sale (1031 exchange, divorce, estate, relocation)? That informs how much negotiation room exists.
- Schools are D-rated, which usually means shorter tenancies and higher turnover. Who's the typical renter profile here, and what's been the actual vacancy rate?
- What's the average days-on-market for RENTAL listings here right now (not sales)? A rising rental-DOM trend means longer vacancies and softer asking-rent achievability than the comps imply.
- What's the recent tenant-quality profile in this submarket — average credit score on applications, eviction rate, late-payment / NSF rate, and stable-employment percentage? A property-management company in the area should have these aggregated.
- How much new for-sale + rental construction is in the pipeline within 1–3 miles? Heavy new supply typically softens prices + rents 12–24 months out; constrained supply supports both.
Investment metrics
- 1% rule
- 1.45% ✓
- Cap rate
- 11.75%
- Cash-on-cash
- 19.50%
- DSCR
- 1.87
- GRM
- 5.7
CMA / ARV
- ARV (on-the-fly)
- $435,904
- Comps found
- 12
Show comp detail 12 sales within ~0.75 mi
| Address | Dist | Beds/Ba | Sqft | Sold | Price | $/sf | Match |
|---|---|---|---|---|---|---|---|
| 4222 SE Satinleaf Pl | 0.29mi | 3/2.0 | 1,574 (+0%) | 3mo | $435,000 | $276 | 84 |
| 6883 SE Raintree Ave | 0.24mi | 3/2.0 | 1,518 (-3%) | 3mo | $489,000 | $322 | 81 |
| 6690 SE Raintree Ave | 0.29mi | 3/2.0 | 1,518 (-3%) | 3mo | $450,000 | $296 | 78 |
| 6691 SE Raintree Ave | 0.31mi | 3/2.0 | 1,518 (-3%) | 10mo | $480,500 | $317 | 72 |
| 7225 SE Magellan Ln | 0.54mi | 3/2.0 | 1,579 (+1%) | 10mo | $410,000 | $260 | 65 |
| 6785 SE Warwick Ln | 0.68mi | 3/2.0 | 1,541 (-2%) | 3mo | $373,000 | $242 | 63 |
| 7770 SE Spicewood Cir | 0.72mi | 2/2.0 (-1) | 1,553 (-1%) | 3mo | $432,500 | $278 | 58 |
| 7814 SE Spicewood Cir | 0.73mi | 2/2.0 (-1) | 1,553 (-1%) | 4mo | $475,000 | $306 | 56 |
| 6892 SE Warwick Ln | 0.74mi | 3/2.0 | 1,541 (-2%) | 11mo | $385,000 | $250 | 54 |
| 7789 SE Spicewood Cir | 0.68mi | 2/2.0 (-1) | 1,553 (-1%) | 10mo | $368,750 | $237 | 54 |
| 4251 SE Dixie Ross St | 0.57mi | 3/2.0 | 1,408 (-10%) | 7mo | $345,000 | $245 | 50 |
| 6354 SE Vista Ave | 0.65mi | 3/2.0 | 1,368 (-13%) | 12mo | $405,000 | $296 | 38 |
Match score weights: distance 35% · size 25% · config 20% · recency 20%. Top-matched comps best support the ARV.
Projected returns pro-forma
-3.0% appreciation · 2.71% rent growth · sell at horizon
- IRR
- 11.2%
- Equity multiple
- 1.44×
- Total profit
- $20,915
- Equity at exit
- $25,198
- IRR
- 20.0%
- Equity multiple
- 2.66×
- Total profit
- $78,519
- Equity at exit
- $14,612
Cash invested: $47,320 (down + closing). Projections, not guarantees.
Landlord ↔ Tenant lean methodology
- Overall (STATE)
- 87 Strongly Landlord-Friendly
- State Florida
- 87 Strongly Landlord-Friendly · R+3
- County
- — inherits STATE
- City
- — inherits STATE
ZIP-level market 34997
- Rents YoY
- 2.7%
- Active inventory
- 588
- Price-to-rent
- 5.7×
Monthly cashflow live
- Estimated rent
- $2,452 high interval (Pro) →
- Mortgage (P&I)
- −$886
- Tax est. 1.5%
- −$211 /mo · $2,535/yr
- Insurance
- −$70
- HOA
- −$0
- Vacancy / Maint / Mgmt
- −$515
- Net cashflow
- $769
Break-even live
UW: 25.0% down · 7.5% · 30yr · 1.5% tax · 5.0% vac · 8.0% maint · 8.0% mgmt
Financing live
Cash to close
- Down payment
- $42,250
- Closing costs
- $5,070
- Reserves months
- —
- Total cash needed
- —
Loan-product check · same deal, 3 products live
Conventional
25% down · 7.5% · 30yr
- Down + closing
- —
- Monthly P&I
- —
- Monthly cashflow
- —
- DSCR
- —
- Eligible?
- —
Personal DTI + credit; lowest rate.
DSCR
20% down · 8.5% · 30yr
- Down + closing
- —
- Monthly P&I
- —
- Monthly cashflow
- —
- DSCR
- —
- Eligible?
- —
No personal income docs; deal must DSCR.
Hard money
10% down · 12.0% · 12mo
- Down + closing
- —
- Monthly P&I
- —
- Monthly cashflow
- —
- DSCR
- —
- Eligible?
- —
Short-term bridge; refi at stabilization.
Rent comps 20 comps
| Address | Beds | Baths | Sqft | Rent | $/sqft | DOM | Units | Dist |
|---|---|---|---|---|---|---|---|---|
| 7073 SE Birchwood Ln Stuart, FL | 2.0 | 2.0 | 1150 | $1,750 | $1.52 | 14d | 1 | 0.24mi |
| 3882 SE Canvas Back Pl Stuart, FL | 3.0 | 2.0 | 1575 | $2,200 | $1.40 | 23d | 1 | 0.28mi |
| 7960 SE Peppercorn Ct Hobe Sound, FL | 2.0 | 2.0 | 1541 | $2,950 | $1.91 | 23d | 1 | 0.80mi |
| 4421 SE Village Rd Stuart, FL | 2.0 | 2.0 | 1080 | $2,100 | $1.94 | 23d | 1 | 0.84mi |
| 6531 SE Federal Hwy Stuart, FL | 2.0 | 2.0 | 1100 | $1,725 | $1.57 | 14d | 2 | 0.84mi |
| 4987 SE Mariner Garden Cir Stuart, FL | 3.0 | 2.5 | 1434 | $2,650 | $1.85 | 23d | 1 | 0.90mi |
| 5176 SE Mariner Garden Cir Stuart, FL | 3.0 | 2.5 | 1554 | $2,400 | $1.54 | 23d | 1 | 0.94mi |
| 5064 SE Mariner Garden Cir Stuart, FL | 3.0 | 2.5 | 1530 | $2,400 | $1.57 | 23d | 1 | 0.94mi |
| 5156 SE Mariner Garden Cir Stuart, FL | 3.0 | 2.5 | 1434 | $2,400 | $1.67 | 23d | 1 | 0.95mi |
| 4939 SE Salvatori Rd Stuart, FL | 3.0 | 2.0 | 1334 | $2,500 | $1.87 | 23d | 1 | 1.01mi |
| 8357 SE Double Tree Dr Hobe Sound, FL | 2.0 | 2.0 | 1510 | $2,950 | $1.95 | 14d | 1 | 1.03mi |
| 6532 SE Broadmoor Ln Stuart, FL | 3.0 | 2.0 | 1972 | $3,300 | $1.67 | 14d | 1 | 1.05mi |
| 6532 SE Broadmoor Ln Stuart, FL | 3.0 | 2.0 | 1972 | $3,300 | $1.67 | 23d | 1 | 1.05mi |
| 5881 SE Windsong Ln Stuart, FL | 2.0 | 2.5 | 1288 | $2,100 | $1.63 | 14d | 1 | 1.05mi |
| 5152 SE Club Way #104 Stuart, FL | 2.0 | 2.0 | 1358 | $7,500 | $5.52 | 14d | 1 | 1.11mi |
| 5688 SE Pine Ave Stuart, FL | 3.0 | 2.0 | 1255 | $2,510 | $2.00 | 14d | 1 | 1.21mi |
| 8392 SE Paurotis Ln Hobe Sound, FL | 2.0 | 2.0 | 1526 | $2,750 | $1.80 | 23d | 1 | 1.21mi |
| 5968 SE Avalon Dr Stuart, FL | 2.0 | 2.0 | 1176 | $2,800 | $2.38 | 14d | 1 | 1.24mi |
| 5601 SE Laguna Ave Stuart, FL | 2.0 | 1.0 | 1080 | $2,200 | $2.04 | 14d | 1 | 1.30mi |
| 5795 SE Mitzi Ln Stuart, FL | 3.0 | 2.0 | 1315 | $3,000 | $2.28 | 23d | 1 | 1.47mi |
Listing history 11 events
-
2026-06-18days on market $169,000 Active 14 DOM
-
2026-06-17days on market $169,000 Active 13 DOM
-
2026-06-16days on market $169,000 Active 12 DOM
-
2026-06-15days on market $169,000 Active 11 DOM
-
2026-06-14days on market $169,000 Active 9 DOM
-
2026-06-13days on market $169,000 Active 8 DOM
-
2026-06-10days on market $169,000 Active 6 DOM
-
2026-06-09days on market $169,000 Active 5 DOM
-
2026-06-08days on market $169,000 Active 4 DOM
-
2026-06-07remarks 699-char remark
-
2026-06-07$169,000 Active 3 DOM
ⓘ Source: listings_history table (triggers on properties + properties_extension) + one-shot
backfill from property_details.listing_events for pre-trigger history.
Climate risk First Street
- Flood 1/10 Low FEMA zone X (unshaded) · 0% chance over 30 yrs
- Wildfire 4/10 Moderate
- Heat 10/10 Extreme 7 d/yr ≥106°F today · 23 d/yr by 30 yrs out
- Wind 10/10 Extreme 99% chance of damaging wind over 30 yrs
- Air quality 2/10 Low 1 unhealthy d/yr today · 1 by 30 yrs out
Nearby sold comps map
Loading sold comps map…
Walkable amenities ~0.75 mi
Loading nearby amenities…
Taxation est. · year 1
- Rental income
- $29,421
- − Mortgage interest
- −$9,467
- − Property taxes
- −$2,535
- − Insurance
- −$845
- − Repairs & maintenance
- −$2,354
- − Management
- −$2,354
- − Depreciation
- −$4,916
- Taxable income
- $6,951
- Est. tax owed @ 24.0%
- −$1,668
- After-tax cash flow
- $7,560/yr
For passive investors: Depreciation is non-cash, so a rental often shows a tax loss while cash-flowing — sheltering income. Rental losses are passive: they offset passive income freely, and up to $25,000/yr can offset ordinary (W-2) income if you actively participate and your MAGI is under $100k (phasing out to $0 by $150k); unused losses carry forward. On sale, claimed depreciation is recaptured at up to 25%, and gains may owe capital-gains tax (a 1031 exchange can defer both). Figures are a year-1 estimate at your 24.0% rate — not tax advice; consult a CPA.
Condition & rehab AI · 13 photos
This well-maintained single-family home is ready for a fresh coat of paint and some landscaping to enhance its curb appeal and value.
Value-add opportunities
- Both Painting the exterior siding — Enhances curb appeal and value
- Both Landscaping the front yard — Improves curb appeal and rental value
- Resale Updating the kitchen backsplash — Modernizes the kitchen and adds value
- Resale Upgrading the bathroom fixtures — Enhances the bathroom's appearance and value
Renovation cost estimate screening
Value-add ROI direction
- Both Painting the exterior siding — Enhances curb appeal and value ↑
- Both Landscaping the front yard — Improves curb appeal and rental value ↑
- Resale Updating the kitchen backsplash — Modernizes the kitchen and adds value ↑
- Resale Upgrading the bathroom fixtures — Enhances the bathroom's appearance and value ↑
ⓘ Cost ranges are severity-bucket heuristics (US national rule-of-thumb). Get contractor quotes + a written scope before underwriting a rehab budget.
Schools (NCES district)
- District
- Martin
- NCES district ID
- 1201290
- Math proficiency
- 52% ▼ -14.00%
- Reading proficiency
- 53% ▼ -4.00%
- Median HH income
- $52,482
- Composite
- 45.1/100
- National rank
- #2690
- State rank
- #24 of 73 in FL
Livability — Port Salerno
- Score
- 70/100
- State rank
- #440
- US rank
- #7873
Category grades
Schools grade is shown separately in the Schools card above.
Census & demographics
- County
- Martin County · 165,223 people
- Metro
- Port St. Lucie, FL
- Population (ZIP)
- 47,075
- Household income
- $78,136
- Rent vs Own
- Severe rent burden
- 1323.0
Population outlook (Martin County) Hauer SSP2
- Today (2025)
- 172,383 people
- By 2030
- 180,192 · +4.5%
- By 2040
- 194,114 · +12.6%
- By 2050
- 204,992 · +18.9%
- By 2075
- 229,641 · +33.2%
- By 2100
- 232,146 · +34.7%
Race, ethnicity, and origin ACS 2023
- Neighborhood character
- Predominantly White (74%)
- Race & ethnicity
- White 74% Hispanic / Latino 19% Two or more races 9% Black 3% Asian 1%
- Hispanic origin (detail)
- Mexican 4% Puerto Rican 2% Cuban 3%
- Common ancestry
- Romanian 3% Lithuanian 3% Slovak 2%
- Foreign-born
- 14% · Canada, Jamaica, China
- Languages at home
- 81% English-only · Spanish 14% French/Haitian/Cajun 2% Other Indo-European 1%
Political lean MEDSL · Martin
- 2024 margin
- Solid R (+31.1) · D 34.1% · R 65.2%
- 2008→2024 swing
- -17.5pp toward R · 2008: -13.6pp · 2024: -31.1pp
- All cycles
- 2024: R+31.1 2020: R+24.6 2016: R+26.9 2012: R+22.9 2008: R+13.6
Not yet ingested
- Civics
- —
Market trends
- HPI YoY
- ▼ -319.78%
- Current HPI
- 336.7717
- Rent YoY
- ▲ 2.71%
- Metro
- Port St. Lucie, FL
- State GDP YoY
- ▲ 3.28%
- F500 in state
- 36
Industry mix (Fortune 500 HQ in FL)
| Industry | F500 HQs | Revenue |
|---|---|---|
| Industrial Technology | 2 | $29B |
|
||
| Insurance | 2 | $17B |
|
||
| Retail | 1 | $60B |
|
||
| Technology Distribution | 1 | $58B |
|
||
| Homebuilding | 1 | $35B |
|
||
| Technology Manufacturing | 1 | $35B |
|
||
Price history
1 event — show timeline
- 2026-06-04 Listed $169,000 ForSaleByOwner.com
Cash-flow waterfall
monthlySold comps — $/sqft
last 12 mo · ≤1 miLoading sold comps…