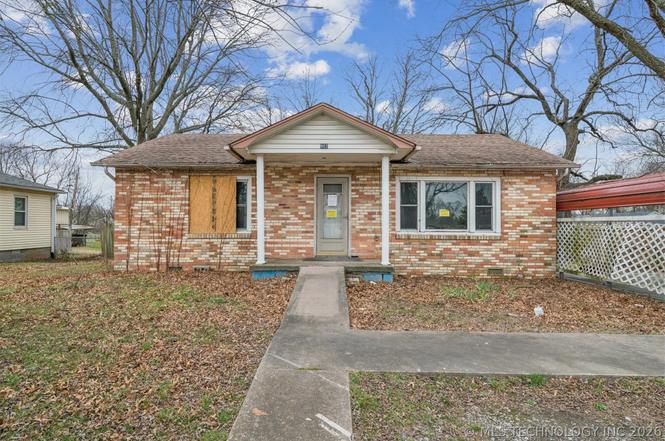
902 SE 2nd St · Pryor Creek, OK
Flood risk 5/10 · Moderate
- FEMA flood zone
- X (unshaded)
- Chance of flooding over 30 yrs
- 0.67%
- Est. flood insurance / yr
- $507 – $1,088
Fire risk 6/10 · Moderate
- Est. fire insurance / yr
- $2,463 – $4,575
Heat risk 7/10 · Major
- Hot days now (above 112°F)
- 7 days/yr
- Hot days in 30 yrs
- 20 days/yr
Wind risk 2/10 · Minimal
- Chance of severe wind over 30 yrs
- 3.0%
Air-quality risk 2/10 · Minimal
- Unhealthy air days now
- 1 days/yr
- Unhealthy air days in 30 yrs
- 1 days/yr
Risk factors via First Street. Map © Google.
Why this score? — see what drove the B+ grade
The composite is a weighted blend of 9 inputs, each scored 0–100. Each bar is that input's sub-score; the figure is the points it added to the 100-point composite (weight × sub-score).
- Cash flow +30.0/30.0
- ARV discount +15.0/15.0
- 1% rule +10.0/10.0
- DSCR +10.0/10.0
- Livability +3.5/5.0
- Rent growth +2.5/5.0
- Condition / age +2.5/5.0
- Schools +1.9/10.0
- Appreciation +0.0/10.0
$85,000
🖨 Deal sheet 📄 Offer letter ✓ Due diligence
Listing remarks
New pictures! This 3-bedroom, 1-bath home in Pryor offers incredible potential for the right buyer. The property experienced a minor fire and has been taken down to the studs, leaving the interior ready to be finished out according to the new owner's preferences. Situated on an extra-large corner lot with beautiful mature trees in a quiet, established neighborhood, this property provides a solid foundation for your next investment project. Home is being sold AS-IS. Seller will make no repairs. Utilities are currently turned off. Can be sold with MLS #2547430.
Key facts
- 0.24 acre lot
- Garage
- Built 1965
Tags
Property features AI
Exterior
- Parking: Attached garage (1 car); Carport; Attached parking
- Security: Storm shelter; Smoke detectors
- Utilities: Cable available; Electricity available; Natural gas available; Phone available; Public water; Public sewer
- Home design: Single-story home; Faces north; Crawlspace foundation
- Construction: Brick, block and vinyl siding construction; Asphalt/fiberglass roof; Year built per public records
- Exterior features: Satellite dish; Chain link and privacy fencing; Corner lot with mature trees
Interior
- Kitchen: Eat-in kitchen; Kitchen with breakfast/dining area; Gas range connection; Gas oven connection
- Bedrooms: Master bedroom (first floor); Additional bedrooms (first floor)
- Flooring: Wood flooring; Wood veneer flooring
- Bathrooms: Master bathroom (first floor); Hall bathroom with bathtub (first floor); Total of 1 full bathroom listed
- Heating & cooling: Central heating; Electric and gas heating options; Space heater; Has heating
- Interior features: Vinyl windows; Programmable thermostat; Gas range and gas oven connections; No additional interior features listed
- Laundry & utility: Inside utility room (first floor); Washer hookup; Gas water heater
Neighborhood map
What this means for you Summary
Snapshot
- This is a 3-bed/1.0-bath single-family listed at $85k.
Deal economics
- At list price, monthly cash flow is $502 ($6k/yr) — positive.
- The deal already cash-flows at list — no discount required.
- Meets the 1% rule at list price ($1k rent vs $85k).
- Recommended offer: $75k (12.0% below list) — sets the bar for market timing.
- Cap rate 13.4% vs local median 3.9% in Pryor Creek — top-decile yield for the area; either an underpriced asset or a hidden risk that comps aren't pricing in. Stress-test before assuming the spread holds.
Location & tenants
- Location reads 69/100 on livability (#51 in OK) — a middle-class / working-renter tenant base. Strengths: cost of living A+, housing A+, health & safety A+; Watch: schools D, crime D-, amenities F.
- Pryor (town): math 24% / reading 21% proficiency, ranked #143 of 270 in OK (top 53%) — low school quality limits family demand, transient renter base, plan for 1-2y turnover.
- Market conditions: 159 active listings in the ZIP; 5 comparable units currently listed for rent nearby; rentals leasing fast (median 2d on market — plan ~1-2 weeks tenant-placement turnaround); 23 units permitted in Mayes County in 2024 (0 in 5+ unit buildings).
Forward outlook
- Local home prices are declining (-3.0%/yr); year-one equity from $588 of loan paydown is wiped out by about $3k of value loss. Plan a longer hold.
- Mayes County population projected at -10% by 2050 — secular population decline; favor cash flow + early exit over multi-decade hold.
- At projected returns (-3.0% appreciation + 3.0% rent growth), your $24k cash investment doubles in ~5 years — after that, you're playing with house money.
Negotiation context
- It's been on market 169 days — a 12% lower offer ($75k) is reasonable based on typical stale-listing flexibility.
- 6 sale attempts since 14y ago; this cycle's ask has dropped $22k (21%) from the opening price — seller is motivated, your offer sets the floor, not the list.
- Current owner paid $57k; 49% above their basis — modest negotiation headroom, anchor on the comps not their cost.
Risks & watch-outs
- Climate carrying-cost: moderate flood risk; major wildfire risk; extreme-heat days projected 7→20/yr by 2055 (HVAC capex compounding) — expect insurance premiums to compound above CPI over the hold.
Questions for the listing agent
- It's been on market 169 days. Have you received any prior offers? Is the seller open to a 12% concession, seller financing, or rate buy-down credit?
- Built in 1965 — when were the roof, HVAC, electrical panel, plumbing, and water heater last replaced?
- Why hasn't it sold? Are there any deal-killer items the seller is aware of (foundation, flood, title, zoning, code violations)?
- Is there a deadline driving the sale (1031 exchange, divorce, estate, relocation)? That informs how much negotiation room exists.
- Schools are D-rated, which usually means shorter tenancies and higher turnover. Who's the typical renter profile here, and what's been the actual vacancy rate?
- Crime grade is D in this area — have there been break-ins, vandalism, or insurance claims at this property in the last 3 years? What carrier currently insures it and at what premium?
- What's the average days-on-market for RENTAL listings here right now (not sales)? A rising rental-DOM trend means longer vacancies and softer asking-rent achievability than the comps imply.
- What's the recent tenant-quality profile in this submarket — average credit score on applications, eviction rate, late-payment / NSF rate, and stable-employment percentage? A property-management company in the area should have these aggregated.
- How much new for-sale + rental construction is in the pipeline within 1–3 miles? Heavy new supply typically softens prices + rents 12–24 months out; constrained supply supports both.
Investment metrics
- 1% rule
- 1.58% ✓
- Cap rate
- 13.39%
- Cash-on-cash
- 25.33%
- DSCR
- 2.13
- GRM
- 5.3
CMA / ARV
- ARV (on-the-fly)
- $156,240
- Comps found
- 12
Show comp detail 12 sales within ~0.75 mi
| Address | Dist | Beds/Ba | Sqft | Sold | Price | $/sf | Match |
|---|---|---|---|---|---|---|---|
| 15 Irving St | 0.26mi | 3/1.0 | 1,152 (-7%) | 9mo | $140,000 | $122 | 68 |
| 107 S Coo-y-yah St Unit B | 0.35mi | 3/2.0 | 1,334 (+8%) | 3mo | $239,000 | $179 | 65 |
| 1400 Damon Dr | 0.69mi | 3/2.0 | 1,252 (+1%) | 2mo | $150,000 | $120 | 61 |
| 7 S Orphan St | 0.24mi | 2/2.0 (-1) | 1,068 (-14%) | 3mo | $43,000 | $40 | 54 |
| 27 Payne St | 0.39mi | 3/1.0 | 1,056 (-15%) | 10mo | $144,000 | $136 | 49 |
| 107 N Orphan St | 0.44mi | 2/1.0 (-1) | 1,416 (+14%) | 5mo | $60,000 | $42 | 47 |
| 303 SE 5th St | 0.60mi | 3/2.0 | 1,373 (+11%) | 8mo | $80,000 | $58 | 44 |
| 1317 Damon Dr | 0.68mi | 3/1.5 | 1,132 (-9%) | 10mo | $145,000 | $128 | 43 |
| 212 N Orphan St | 0.58mi | 2/2.0 (-1) | 1,344 (+8%) | 10mo | $91,000 | $68 | 42 |
| 232 Eastmanor Cir | 0.75mi | 3/1.0 | 1,070 (-14%) | 6mo | $182,000 | $170 | 38 |
| 606 S Vann St | 0.72mi | 2/1.0 (-1) | 1,056 (-15%) | 6mo | $133,000 | $126 | 31 |
| 310 Savannah Park | 0.74mi | 2/2.0 (-1) | 1,373 (+11%) | 10mo | $215,000 | $157 | 31 |
Match score weights: distance 35% · size 25% · config 20% · recency 20%. Top-matched comps best support the ARV.
Projected returns pro-forma
-3.0% appreciation · 3.0% rent growth · sell at horizon
- IRR
- 18.9%
- Equity multiple
- 1.77×
- Total profit
- $18,227
- Equity at exit
- $12,674
- IRR
- 27.2%
- Equity multiple
- 3.40×
- Total profit
- $57,081
- Equity at exit
- $7,349
Cash invested: $23,800 (down + closing). Projections, not guarantees.
Landlord ↔ Tenant lean methodology
- Overall (STATE)
- 83 Strongly Landlord-Friendly
- State Oklahoma
- 83 Strongly Landlord-Friendly · R+20
- County
- — inherits STATE
- City
- — inherits STATE
ZIP-level market 74361
- Active inventory
- 159
- Price-to-rent
- 5.3×
Monthly cashflow live
- Estimated rent
- $1,341 high interval (Pro) →
- Mortgage (P&I)
- −$446
- Tax from tax record
- −$75 /mo · $905/yr
- Insurance
- −$35
- HOA
- −$0
- Vacancy / Maint / Mgmt
- −$282
- Net cashflow
- $502
Break-even live
UW: 25.0% down · 7.5% · 30yr · 1.5% tax · 5.0% vac · 8.0% maint · 8.0% mgmt
Financing live
Cash to close
- Down payment
- $21,250
- Closing costs
- $2,550
- Reserves months
- —
- Total cash needed
- —
Loan-product check · same deal, 3 products live
Conventional
25% down · 7.5% · 30yr
- Down + closing
- —
- Monthly P&I
- —
- Monthly cashflow
- —
- DSCR
- —
- Eligible?
- —
Personal DTI + credit; lowest rate.
DSCR
20% down · 8.5% · 30yr
- Down + closing
- —
- Monthly P&I
- —
- Monthly cashflow
- —
- DSCR
- —
- Eligible?
- —
No personal income docs; deal must DSCR.
Hard money
10% down · 12.0% · 12mo
- Down + closing
- —
- Monthly P&I
- —
- Monthly cashflow
- —
- DSCR
- —
- Eligible?
- —
Short-term bridge; refi at stabilization.
Rent comps 5 comps
| Address | Beds | Baths | Sqft | Rent | $/sqft | DOM | Units | Dist |
|---|---|---|---|---|---|---|---|---|
| 111 N Elliott St Unit A Pryor, OK | 2.0 | 1.0 | 1000 | $1,250 | $1.25 | 14d | 1 | 0.43mi |
| 202 N Ora St Pryor, OK | 3.0 | 2.0 | 1291 | $1,600 | $1.24 | 18d | 1 | 0.51mi |
| 1220 SE 9th St Pryor, OK | 2.0–3.0 | 1.0–1.5 | 909 | $1,469 | $1.62 | 1d | 5 | 0.79mi |
| 1501 Meadow Trace Dr Unit 1 Pryor, OK | 2.0 | 1.5 | 1000 | $1,029 | $1.03 | 1d | 3 | 1.04mi |
| 1707 S Elliott St Pryor, OK | 1.0–2.0 | 1.0–2.0 | 870 | $1,275 | $1.47 | 1d | 1 | 1.20mi |
Listing history 19 events
-
2026-05-13status Pending
-
2026-03-09price $85,000
-
2026-02-20price $90,000
-
2025-11-25$107,200 Active
-
2017-10-16historical
-
2017-09-15price $69,000
-
2017-04-27$75,000 Active
-
2014-11-13historical
-
2014-06-03$85,900
-
2014-05-23historical
-
2013-11-22historical
-
2013-11-22$85,900
-
2013-05-21$79,900
-
2012-08-09historical
-
2012-02-09$90,000
-
2007-03-22soldstatus $57,000
-
2000-06-01soldstatus $51,000
-
1997-10-21soldstatus $23,000
-
1992-09-22soldstatus $20,000
ⓘ Source: listings_history table (triggers on properties + properties_extension) + one-shot
backfill from property_details.listing_events for pre-trigger history.
Tax reassessment forecast OK · Resets to sale price
- Current annual tax
- $905 · $75/mo
- Projected year-2 tax
- $905 · $75/mo
- Expected delta
- $0/yr ($0/mo · 0.0%)
ⓘ Screening estimate from a state-policy table — verify with the county assessor before closing.
Climate risk First Street
- Flood 5/10 Major FEMA zone X (unshaded) · 67% chance over 30 yrs
- Wildfire 6/10 Major
- Heat 7/10 Severe 7 d/yr ≥112°F today · 20 d/yr by 30 yrs out
- Wind 2/10 Low 3% chance of damaging wind over 30 yrs
- Air quality 2/10 Low 1 unhealthy d/yr today · 1 by 30 yrs out
Nearby sold comps map
Loading sold comps map…
Walkable amenities ~0.75 mi
Loading nearby amenities…
Taxation est. · year 1
- Rental income
- $16,086
- − Mortgage interest
- −$4,761
- − Property taxes
- −$905
- − Insurance
- −$425
- − Repairs & maintenance
- −$1,287
- − Management
- −$1,287
- − Depreciation
- −$2,473
- Taxable income
- $4,948
- Est. tax owed @ 24.0%
- −$1,188
- After-tax cash flow
- $4,841/yr
For passive investors: Depreciation is non-cash, so a rental often shows a tax loss while cash-flowing — sheltering income. Rental losses are passive: they offset passive income freely, and up to $25,000/yr can offset ordinary (W-2) income if you actively participate and your MAGI is under $100k (phasing out to $0 by $150k); unused losses carry forward. On sale, claimed depreciation is recaptured at up to 25%, and gains may owe capital-gains tax (a 1031 exchange can defer both). Figures are a year-1 estimate at your 24.0% rate — not tax advice; consult a CPA.
Schools (NCES district)
- District
- Pryor
- NCES district ID
- 4025200
- Math proficiency
- 24% ▼ -13.00%
- Reading proficiency
- 21% ▼ -13.00%
- Median HH income
- $44,306
- Composite
- 19.46/100
- National rank
- #8774
- State rank
- #143 of 270 in OK
Livability — Pryor Creek
- Score
- 69/100
- State rank
- #51
- US rank
- #8653
Category grades
Schools grade is shown separately in the Schools card above.
Census & demographics
- Census place
- Pryor Creek, OK
- County
- Mayes County · 17,612 people
- City population
- 17,582
- Metro
- nan
- Population (ZIP)
- 17,612
- Household income
- $58,681
- Rent vs Own
- Severe rent burden
- 326.0
Population outlook (Mayes County) Hauer SSP2
- Today (2025)
- 39,941 people
- By 2030
- 39,172 · -1.9%
- By 2040
- 37,540 · -6.0%
- By 2050
- 35,854 · -10.2%
- By 2075
- 32,361 · -19.0%
- By 2100
- 28,054 · -29.8%
Race, ethnicity, and origin ACS 2023
- Neighborhood character
- Diverse neighborhood (Simpson 0.58)
- Race & ethnicity
- White 65% Native American 18% Two or more races 13% Hispanic / Latino 5%
- Common ancestry
- Slovak 3% Romanian 1% Serbian 1%
- Foreign-born
- 2% · Canada
- Languages at home
- 96% English-only · Spanish 2%
Political lean MEDSL · Mayes
- 2024 margin
- Solid R (+57.5) · D 20.3% · R 77.8% · Other 1.9%
- 2008→2024 swing
- -29.4pp toward R · 2008: -28.1pp · 2024: -57.5pp
- All cycles
- 2024: R+57.5 2020: R+55.1 2016: R+51.7 2012: R+33.3 2008: R+28.1
Not yet ingested
- Civics
- —
Market trends
- HPI YoY
- ▼ -145.81%
- Current HPI
- 247.7737
- Rent YoY
- —
- Metro
- nan
- State GDP YoY
- ▲ 1.55%
- F500 in state
- 6
Industry mix (Fortune 500 HQ in OK)
| Industry | F500 HQs | Revenue |
|---|---|---|
| Energy | 3 | $48B |
|
||
Price history
+325.0% since first listed19 events — show timeline
- 2026-05-13 Pending — MLS Technology, Inc.
- 2026-03-09 Price Changed $85,000 MLS Technology, Inc.
- 2026-02-20 Price Changed $90,000 MLS Technology, Inc.
- 2025-11-25 Listed $107,200 MLS Technology, Inc.
- 2017-10-16 Listing Removed — MLS Technology, Inc.
- 2017-09-15 Price Changed $69,000 MLS Technology, Inc.
- 2017-04-27 Listed $75,000 MLS Technology, Inc.
- 2014-11-13 Listing Removed — MLS Technology, Inc.
- 2014-06-03 Listed $85,900 MLS Technology, Inc.
- 2014-05-23 Listing Removed — MLS Technology, Inc.
- 2013-11-22 Listed $85,900 MLS Technology, Inc.
- 2013-11-22 Listing Removed — MLS Technology, Inc.
- 2013-05-21 Listed $79,900 MLS Technology, Inc.
- 2012-08-09 Listing Removed — MLS Technology, Inc.
- 2012-02-09 Listed $90,000 MLS Technology, Inc.
- 2007-03-22 Sold (Public Records) $57,000 Public Records
- 2000-06-01 Sold (Public Records) $51,000 Public Records
- 1997-10-21 Sold (Public Records) $23,000 Public Records
- 1992-09-22 Sold (Public Records) $20,000 Public Records
Property tax history
+7.8%/yrLatest (2025): $905 · +5.0% YoY. Source: county tax records.
Cash-flow waterfall
monthlySold comps — $/sqft
last 12 mo · ≤1 miLoading sold comps…