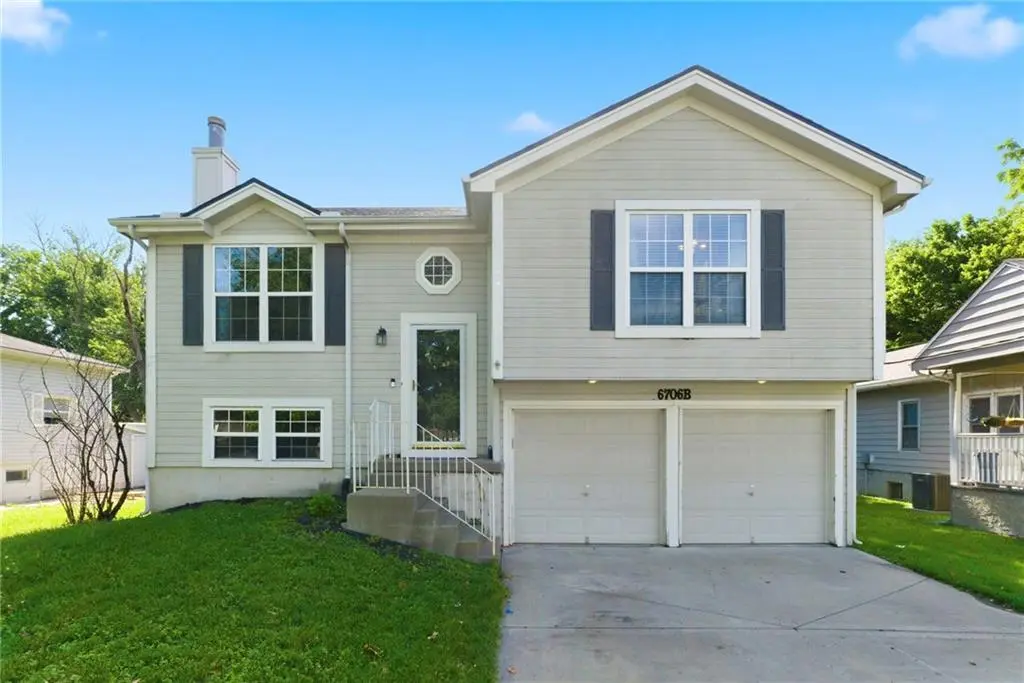
6706 S Brookside Rd · Pleasant Valley, MO
Flood risk 1/10 · Minimal
- FEMA flood zone
- X (unshaded)
- Chance of flooding over 30 yrs
- 0.0%
- Est. flood insurance / yr
- $473 – $860
Fire risk 1/10 · Minimal
- Est. fire insurance / yr
- $1,054 – $1,958
Heat risk 4/10 · Minor
- Hot days now (above 107°F)
- 7 days/yr
- Hot days in 30 yrs
- 17 days/yr
Wind risk 2/10 · Minimal
- Chance of severe wind over 30 yrs
- —
Air-quality risk 3/10 · Minor
- Unhealthy air days now
- 2 days/yr
- Unhealthy air days in 30 yrs
- 3 days/yr
Risk factors via First Street. Map © Google.
Why this score? — see what drove the F grade
The composite is a weighted blend of 9 inputs, each scored 0–100. Each bar is that input's sub-score; the figure is the points it added to the 100-point composite (weight × sub-score).
- Cash flow +5.1/30.0
- Schools +3.8/10.0
- Rent growth +3.7/5.0
- Livability +3.6/5.0
- Condition / age +2.5/5.0
- 1% rule +0.0/10.0
- DSCR +0.0/10.0
- ARV discount +0.0/15.0
- Appreciation +0.0/10.0
$240,000
🖨 Deal sheet 📄 Offer letter ✓ Due diligence
Listing remarks MLS
Whether you're looking for your first home or your next buy and hold, this one's worth looking ant. Nicely Updated 2 bed 1 bath home situated on a HUGE city lot!!! Nicely updated kitchen that walks out to the back. Full basement with plenty of space for storage.
Key facts
- 0.27 acre lot
- 2 garage spots
- Built 2003
Property features AI
Finance
- Other: Seller provides warranty; Estimated living area reported as 1,707 square feet; Below-grade finished area reported
Exterior
- Parking: Attached 2-car garage
- Utilities: Public water; Public sewer
- Home design: Single-family residence; Split entry floor plan; Residential property
- Construction: Frame construction with wood siding; Composition roof
- Exterior features: Wood fencing; Lot approximately 11,761 square feet
Interior
- Kitchen: Eat-in kitchen; Pantry
- Bedrooms: 3 bedrooms
- Flooring: Carpet; Luxury vinyl
- Bathrooms: 2 full bathrooms; 1 half bathroom
- Heating & cooling: Natural gas heating; Electric cooling (central air)
- Interior features: Painted cabinets; Pantry; Vaulted ceilings; Walk-in closet(s); Finished basement; Eat-in kitchen
- Laundry & utility: Laundry on lower level
Neighborhood map
What this means for you Summary
Snapshot
- This is a 2-bed/1.0-bath single-family listed at $240k.
Deal economics
- At list price, monthly cash flow is $-557 ($-7k/yr) — negative.
- To cash-flow at today's rent, offer at most $142k (41.0% below list).
- To meet the 1% rule (rent ≥ 1% of price), the offer needs to be $120k (50.2% below list).
- Recommended offer: $120k (50.2% below list) — sets the bar for 1% rule.
Location & tenants
- Location reads 71/100 on livability (#112 in MO) — a middle-class / working-renter tenant base. Strengths: crime A+, cost of living A+, housing A+; Watch: employment C-, schools D-, amenities F.
- North Kansas City 74 (urban): math 38% / reading 49% proficiency, ranked #98 of 324 in MO (top 30%) — families likely to look elsewhere, expect single-tenant / working-renter base with shorter leases.
- Market conditions: Rents rising fast (+4.7%/yr); 189 active listings in the ZIP; 3 comparable units currently listed for rent nearby; rentals leasing fast (median 10d on market — plan ~1-2 weeks tenant-placement turnaround); solid renter incomes; 341 units permitted in Clay County in 2024 (40 in 5+ unit buildings).
- This rent is only 16% of the median local income ($92k/yr) — well below the 30% rent-burden line; pricing power to push rent on renewal without tenant pushback.
Forward outlook
- Local home prices are declining (-3.0%/yr); year-one equity from $2k of loan paydown is wiped out by about $7k of value loss. Plan a longer hold.
- Clay County population projected at +24% by 2050 — long-run rental-demand tailwind backs the buy-and-hold thesis.
Negotiation context
- Only 3 days on market — expect competitive offers; lowballing is unlikely to land.
- 11 sale attempts since 26y ago with the ask held roughly flat each time — persistent listings suggest the price (not the market) is what's stuck; bring a comps-based counter.
Questions for the listing agent
- What do current leases actually rent for vs. the listed asking? Can we see a recent rent roll and the last 12 months of T-12 income?
- Is there a deadline driving the sale (1031 exchange, divorce, estate, relocation)? That informs how much negotiation room exists.
- Schools are D-rated, which usually means shorter tenancies and higher turnover. Who's the typical renter profile here, and what's been the actual vacancy rate?
- The area grade is low — what's the realistic commute time and amenity access for the typical tenant pool here? Any planned neighborhood developments (good or bad) we should know about?
- What's the average days-on-market for RENTAL listings here right now (not sales)? A rising rental-DOM trend means longer vacancies and softer asking-rent achievability than the comps imply.
- What's the recent tenant-quality profile in this submarket — average credit score on applications, eviction rate, late-payment / NSF rate, and stable-employment percentage? A property-management company in the area should have these aggregated.
- How much new for-sale + rental construction is in the pipeline within 1–3 miles? Heavy new supply typically softens prices + rents 12–24 months out; constrained supply supports both.
Investment metrics
- 1% rule
- 0.50% ✗
- Cap rate
- 3.51%
- Cash-on-cash
- -9.95%
- DSCR
- 0.56
- GRM
- 16.7
CMA / ARV
- ARV (on-the-fly)
- $169,944
- Comps found
- 5
Show comp detail 5 sales within ~0.75 mi
| Address | Dist | Beds/Ba | Sqft | Sold | Price | $/sf | Match |
|---|---|---|---|---|---|---|---|
| 6706 S Brookside Ave | 0.00mi | 2/1.0 | 876 (0%) | 23mo | $155,000 | $177 | 81 |
| 6713 S Elm St | 0.34mi | 2/1.0 | 900 (+3%) | 2mo | $174,900 | $194 | 77 |
| 6900 Sobbie Rd | 0.39mi | 3/2.0 (+1) | 880 (+0%) | 3mo | $159,900 | $182 | 70 |
| 6409 Ravena Rd | 0.38mi | 3/1.0 (+1) | 880 (+0%) | 9mo | $225,000 | $256 | 69 |
| 6906 Fulton Rd | 0.61mi | 3/1.0 (+1) | 835 (-5%) | 15mo | $179,000 | $214 | 46 |
Match score weights: distance 35% · size 25% · config 20% · recency 20%. Top-matched comps best support the ARV.
Projected returns pro-forma
-3.0% appreciation · 4.69% rent growth · sell at horizon
- IRR
- -32.7%
- Equity multiple
- -0.08×
- Total profit
- $-72,374
- Equity at exit
- $35,785
- IRR
- -31.9%
- Equity multiple
- -0.49×
- Total profit
- $-100,237
- Equity at exit
- $20,751
Cash invested: $67,200 (down + closing). Projections, not guarantees.
Landlord ↔ Tenant lean methodology
- Overall (STATE)
- 81 Strongly Landlord-Friendly
- State Missouri
- 81 Strongly Landlord-Friendly · R+10
- County
- — inherits STATE
- City
- — inherits STATE
ZIP-level market 64068
- Rents YoY
- 4.7%
- Active inventory
- 189
- Price-to-rent
- 16.7×
Monthly cashflow live
- Estimated rent
- $1,196 medium interval (Pro) →
- Mortgage (P&I)
- −$1,259
- Tax from tax record
- −$143 /mo · $1,714/yr
- Insurance
- −$100
- HOA
- −$0
- Vacancy / Maint / Mgmt
- −$251
- Net cashflow
- $-557
Break-even live
UW: 25.0% down · 7.5% · 30yr · 1.5% tax · 5.0% vac · 8.0% maint · 8.0% mgmt
Financing live
Cash to close
- Down payment
- $60,000
- Closing costs
- $7,200
- Reserves months
- —
- Total cash needed
- —
Loan-product check · same deal, 3 products live
Conventional
25% down · 7.5% · 30yr
- Down + closing
- —
- Monthly P&I
- —
- Monthly cashflow
- —
- DSCR
- —
- Eligible?
- —
Personal DTI + credit; lowest rate.
DSCR
20% down · 8.5% · 30yr
- Down + closing
- —
- Monthly P&I
- —
- Monthly cashflow
- —
- DSCR
- —
- Eligible?
- —
No personal income docs; deal must DSCR.
Hard money
10% down · 12.0% · 12mo
- Down + closing
- —
- Monthly P&I
- —
- Monthly cashflow
- —
- DSCR
- —
- Eligible?
- —
Short-term bridge; refi at stabilization.
Rent comps 3 comps
| Address | Beds | Baths | Sqft | Rent | $/sqft | DOM | Units | Dist |
|---|---|---|---|---|---|---|---|---|
| 1260 U.S. 69 Liberty, MO | 3.0 | 2.0 | 1086 | $1,196 | $1.10 | 10d | 1 | 0.48mi |
| 7013 N Chas Dr Unit B Pleasant Valley, MO | 2.0 | 2.0 | 950 | $1,225 | $1.29 | 4d | 1 | 0.51mi |
| 8208 Chas Cir Unit 7 Pleasant Valley, MO | 1.0 | 1.0 | 1000 | $1,080 | $1.08 | 43d | 1 | 0.67mi |
Listing history 3 events
-
2026-06-07statusdays on market $240,000 Pending 3 DOM
-
2026-06-05remarks 699-char remark
-
2026-06-05$240,000 Active 1 DOM
ⓘ Source: listings_history table (triggers on properties + properties_extension) + one-shot
backfill from property_details.listing_events for pre-trigger history.
Tax reassessment forecast MO · Resets to sale price
- Current annual tax
- $1,714 · $143/mo
- Projected year-2 tax
- $2,328 · $194/mo
- Expected delta
- +$614/yr (+$51/mo · 35.8%)
ⓘ Screening estimate from a state-policy table — verify with the county assessor before closing.
Climate risk First Street
- Flood 1/10 Low FEMA zone X (unshaded) · 0% chance over 30 yrs
- Wildfire 1/10 Low
- Heat 4/10 Moderate 7 d/yr ≥107°F today · 17 d/yr by 30 yrs out
- Wind 2/10 Low
- Air quality 3/10 Moderate 2 unhealthy d/yr today · 3 by 30 yrs out
Nearby sold comps map
Loading sold comps map…
Walkable amenities ~0.75 mi
Loading nearby amenities…
Taxation est. · year 1
- Rental income
- $14,347
- − Mortgage interest
- −$13,444
- − Property taxes
- −$1,714
- − Insurance
- −$1,200
- − Repairs & maintenance
- −$1,148
- − Management
- −$1,148
- − Depreciation
- −$6,982
- Taxable loss
- −$11,289
- Est. tax savings @ 24.0%
- +$2,709
- After-tax cash flow
- $-3,974/yr
For passive investors: Depreciation is non-cash, so a rental often shows a tax loss while cash-flowing — sheltering income. Rental losses are passive: they offset passive income freely, and up to $25,000/yr can offset ordinary (W-2) income if you actively participate and your MAGI is under $100k (phasing out to $0 by $150k); unused losses carry forward. On sale, claimed depreciation is recaptured at up to 25%, and gains may owe capital-gains tax (a 1031 exchange can defer both). Figures are a year-1 estimate at your 24.0% rate — not tax advice; consult a CPA.
Schools (NCES district)
- District
- North Kansas City 74
- NCES district ID
- 2922800
- Math proficiency
- 38% ▼ -11.00%
- Reading proficiency
- 49% ▼ -3.00%
- Median HH income
- $55,444
- Composite
- 37.88/100
- National rank
- #4321
- State rank
- #98 of 324 in MO
Livability — Pleasant Valley
- Score
- 71/100
- State rank
- #112
- US rank
- #7111
Category grades
Schools grade is shown separately in the Schools card above.
Census & demographics
- Census place
- Pleasant Valley, MO
- County
- Clay County · 220,651 people
- Metro
- Kansas City, MO-KS
- Population (ZIP)
- 37,758
- Household income
- $92,297
- Rent vs Own
- Severe rent burden
- 695.0
Population outlook (Clay County) Hauer SSP2
- Today (2025)
- 266,022 people
- By 2030
- 280,057 · +5.3%
- By 2040
- 306,153 · +15.1%
- By 2050
- 328,630 · +23.5%
- By 2075
- 375,182 · +41.0%
- By 2100
- 392,861 · +47.7%
Race, ethnicity, and origin ACS 2023
- Neighborhood character
- Predominantly White (85%)
- Race & ethnicity
- White 85% Hispanic / Latino 5% Two or more races 5% Black 4% Asian 2%
- Hispanic origin (detail)
- Mexican 3%
- Common ancestry
- Lithuanian 3% Italian 3% Slovak 3%
- Foreign-born
- 2% · Canada, China
- Languages at home
- 97% English-only · Spanish 1%
Political lean MEDSL · Clay
- 2024 margin
- Lean R (+5.6) · D 46.4% · R 52.0% · Other 1.6%
- 2008→2024 swing
- -4.9pp toward R · 2008: -0.7pp · 2024: -5.6pp
- All cycles
- 2024: R+5.6 2020: R+4.1 2016: R+11.1 2012: R+8.4 2008: R+0.7
Not yet ingested
- Civics
- —
Market trends
- HPI YoY
- ▼ -233.70%
- Current HPI
- 223.1569
- Rent YoY
- ▲ 4.69%
- Metro
- Kansas City, MO-KS
- State GDP YoY
- ▲ 1.84%
- F500 in state
- 20
Industry mix (Fortune 500 HQ in MO)
| Industry | F500 HQs | Revenue |
|---|---|---|
| Healthcare | 1 | $163B |
|
||
| Insurance | 1 | $21B |
|
||
| Industrial Technology | 1 | $17B |
|
||
| Retail | 1 | $16B |
|
||
| Industrial Distribution | 1 | $10B |
|
||
| Utilities | 1 | $9B |
|
||
Price history
+445.5% since first listed31 events — show timeline
- 2026-06-04 Listed $240,000 Heartland MLS as Distributed by MLS Grid
- 2026-06-03 Coming Soon $240,000 Heartland MLS as Distributed by MLS Grid
- 2024-07-11 Sold (Public Records) — Public Records
- 2024-07-10 Sold (MLS) — Heartland MLS as Distributed by MLS Grid
- 2024-06-12 Pending — Heartland MLS as Distributed by MLS Grid
- 2024-05-10 Relisted — Heartland MLS as Distributed by MLS Grid
- 2024-04-23 Pending — Heartland MLS as Distributed by MLS Grid
- 2024-04-03 Relisted — Heartland MLS as Distributed by MLS Grid
- 2024-03-30 Pending — Heartland MLS as Distributed by MLS Grid
- 2024-03-28 Listed $155,000 Heartland MLS as Distributed by MLS Grid
- 2020-04-08 Sold (Public Records) — Public Records
- 2020-04-08 Sold (MLS) — Heartland MLS as Distributed by MLS Grid
- 2020-03-08 Pending — Heartland MLS as Distributed by MLS Grid
- 2020-03-05 Listed $185,000 Heartland MLS as Distributed by MLS Grid
- 2017-06-08 Sold (MLS) — Heartland MLS as Distributed by MLS Grid
- 2017-05-11 Pending — Heartland MLS as Distributed by MLS Grid
- 2017-05-10 Listed $155,000 Heartland MLS as Distributed by MLS Grid
- 2007-05-22 Sold (Public Records) — Public Records
- 2007-05-21 Sold (MLS) — Heartland MLS as Distributed by MLS Grid
- 2007-04-28 Listed $92,500 Heartland MLS as Distributed by MLS Grid
- 2005-01-27 Sold (Public Records) — Public Records
- 2005-01-26 Sold (MLS) — Heartland MLS as Distributed by MLS Grid
- 2004-07-30 Listed $89,900 Heartland MLS as Distributed by MLS Grid
- 2003-10-17 Sold (MLS) — Heartland MLS as Distributed by MLS Grid
- 2003-05-12 Listed $90,000 Heartland MLS as Distributed by MLS Grid
- 2001-07-20 Sold (Public Records) — Public Records
- 2001-07-18 Sold (MLS) — Heartland MLS as Distributed by MLS Grid
- 2001-05-14 Listed $84,900 Heartland MLS as Distributed by MLS Grid
- 2000-11-03 Sold (MLS) — Heartland MLS as Distributed by MLS Grid
- 2000-10-26 Sold (Public Records) — Public Records
- 2000-06-29 Listed $44,000 Heartland MLS as Distributed by MLS Grid
Property tax history
+3.5%/yrLatest (2025): $1,714 · +18.5% YoY. Source: county tax records.
Cash-flow waterfall
monthlySold comps — $/sqft
last 12 mo · ≤1 miLoading sold comps…