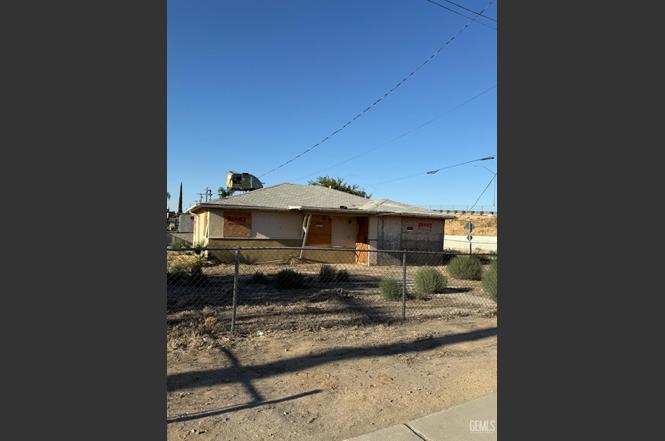
3101 Pioneer Dr · East Niles, CA
Flood risk 1/10 · Minimal
- FEMA flood zone
- X (unshaded)
- Chance of flooding over 30 yrs
- 0.0%
- Est. flood insurance / yr
- $507 – $1,088
Fire risk 3/10 · Minor
- Est. fire insurance / yr
- $659 – $1,223
Heat risk 8/10 · Major
- Hot days now (above 105°F)
- 7 days/yr
- Hot days in 30 yrs
- 19 days/yr
Wind risk 1/10 · Minimal
- Chance of severe wind over 30 yrs
- —
Air-quality risk 10/10 · Severe
- Unhealthy air days now
- 34 days/yr
- Unhealthy air days in 30 yrs
- 40 days/yr
Risk factors via First Street. Map © Google.
Why this score? — see what drove the B- grade
The composite is a weighted blend of 9 inputs, each scored 0–100. Each bar is that input's sub-score; the figure is the points it added to the 100-point composite (weight × sub-score).
- Cash flow +25.2/30.0
- ARV discount +15.0/15.0
- DSCR +8.3/10.0
- 1% rule +5.8/10.0
- Schools +3.4/10.0
- Rent growth +3.1/5.0
- Livability +2.5/5.0
- Condition / age +2.5/5.0
- Appreciation +0.0/10.0
$149,999
🖨 Deal sheet 📄 Offer letter ✓ Due diligence
Listing remarks
Calling all investors! This fixer-upper is your next flip or buy-and-hold project you have been looking for! This 3 bedroom, 1 bathroom home with over 1100 square feet features endless possibilities. You do not want to miss out on this opportunity. Make an offer today before it's gone!
Key facts
- 4,791 sq ft lot
- Built 1957
- Listed 12 days
Neighborhood map
What this means for you Summary
Snapshot
- This is a 3-bed/1.0-bath single-family listed at $150k.
Deal economics
- At list price, monthly cash flow is $338 ($4k/yr) — positive.
- The deal already cash-flows at list — no discount required.
- Meets the 1% rule at list price ($2k rent vs $150k).
- Cap rate 9.0% vs local median 4.4% in East Niles — top-decile yield for the area; either an underpriced asset or a hidden risk that comps aren't pricing in. Stress-test before assuming the spread holds.
Location & tenants
- Location reads: area grade B — affects rentability + tenant quality, not the cash-flow math above.
- Kern High (urban): math 21% / reading 51% proficiency, ranked #860 of 1,400 in CA (top 61%) — families likely to look elsewhere, expect single-tenant / working-renter base with shorter leases.
- Market conditions: Rents rising (+2.2%/yr); 387 active listings in the ZIP; 24 comparable units currently listed for rent nearby; rentals leasing fast (median 3d on market — plan ~1-2 weeks tenant-placement turnaround); 3,244 units permitted in Kern County in 2024 (73 in 5+ unit buildings).
Forward outlook
- Local home prices are declining (-3.0%/yr); year-one equity from $1k of loan paydown is wiped out by about $4k of value loss. Plan a longer hold.
- Kern County population projected at +17% by 2050 — long-run rental-demand tailwind backs the buy-and-hold thesis.
Negotiation context
- Only 12 days on market — expect competitive offers; lowballing is unlikely to land.
Risks & watch-outs
- Watch-outs: built in 1957 — expect roof / HVAC / electrical / plumbing capex.
- Climate carrying-cost: extreme-heat days projected 7→19/yr by 2055 (HVAC capex compounding) — expect insurance premiums to compound above CPI over the hold.
Questions for the listing agent
- Built in 1957 — when were the roof, HVAC, electrical panel, plumbing, and water heater last replaced?
- Is there a deadline driving the sale (1031 exchange, divorce, estate, relocation)? That informs how much negotiation room exists.
- What's the average days-on-market for RENTAL listings here right now (not sales)? A rising rental-DOM trend means longer vacancies and softer asking-rent achievability than the comps imply.
- What's the recent tenant-quality profile in this submarket — average credit score on applications, eviction rate, late-payment / NSF rate, and stable-employment percentage? A property-management company in the area should have these aggregated.
- How much new for-sale + rental construction is in the pipeline within 1–3 miles? Heavy new supply typically softens prices + rents 12–24 months out; constrained supply supports both.
Investment metrics
- 1% rule
- 1.08% ✓
- Cap rate
- 9.00%
- Cash-on-cash
- 9.65%
- DSCR
- 1.43
- GRM
- 7.7
CMA / ARV
- ARV (on-the-fly)
- $272,548
- Comps found
- 12
Show comp detail 12 sales within ~0.75 mi
| Address | Dist | Beds/Ba | Sqft | Sold | Price | $/sf | Match |
|---|---|---|---|---|---|---|---|
| 404 Hill St | 0.16mi | 3/1.5 | 1,102 (-1%) | 1mo | $280,000 | $254 | 88 |
| 3317 Center | 0.41mi | 3/2.0 | 1,160 (+4%) | 2mo | $332,500 | $287 | 69 |
| 3306 Center St | 0.39mi | 3/1.0 | 1,198 (+7%) | 3mo | $186,000 | $155 | 68 |
| 900 Quantico Ave | 0.58mi | 3/1.0 | 1,123 (+0%) | 7mo | $205,000 | $183 | 66 |
| 3112 Kentucky St | 0.35mi | 3/1.8 | 1,202 (+8%) | 4mo | $289,900 | $241 | 64 |
| 505 Larry St | 0.47mi | 3/1.0 | 1,175 (+5%) | 7mo | $280,000 | $238 | 64 |
| 311 Ixtapa Dr | 0.58mi | 3/2.0 | 1,091 (-2%) | 4mo | $310,000 | $284 | 62 |
| 203 Isla Del Sol Dr | 0.64mi | 3/2.0 | 1,091 (-2%) | 1mo | $305,000 | $280 | 61 |
| 715 Normandy Dr | 0.56mi | 2/1.0 (-1) | 1,079 (-3%) | 6mo | $247,000 | $229 | 58 |
| 507 Tulip St | 0.42mi | 4/2.0 (+1) | 1,208 (+8%) | 2mo | $295,000 | $244 | 56 |
| 504 Richards Ave | 0.58mi | 2/1.0 (-1) | 1,176 (+5%) | 5mo | $290,000 | $247 | 55 |
| 3607 Periwinkle Ct | 0.54mi | 4/2.0 (+1) | 1,212 (+8%) | 3mo | $275,000 | $227 | 49 |
Match score weights: distance 35% · size 25% · config 20% · recency 20%. Top-matched comps best support the ARV.
Projected returns pro-forma
-3.0% appreciation · 2.24% rent growth · sell at horizon
- IRR
- -2.6%
- Equity multiple
- 0.90×
- Total profit
- $-4,057
- Equity at exit
- $22,365
- IRR
- 6.3%
- Equity multiple
- 1.45×
- Total profit
- $19,061
- Equity at exit
- $12,969
Cash invested: $42,000 (down + closing). Projections, not guarantees.
Landlord ↔ Tenant lean methodology
- Overall (STATE)
- 18 Strongly Tenant-Friendly
- State California
- 18 Strongly Tenant-Friendly · D+13
- County
- — inherits STATE
- City
- — inherits STATE
ZIP-level market 93306
- Rents YoY
- 2.2%
- Active inventory
- 387
- Price-to-rent
- 7.7×
Monthly cashflow live
- Estimated rent
- $1,621 high interval (Pro) →
- Mortgage (P&I)
- −$787
- Tax from tax record
- −$94 /mo · $1,124/yr
- Insurance
- −$62
- HOA
- −$0
- Vacancy / Maint / Mgmt
- −$340
- Net cashflow
- $338
Break-even live
UW: 25.0% down · 7.5% · 30yr · 1.5% tax · 5.0% vac · 8.0% maint · 8.0% mgmt
Financing live
Cash to close
- Down payment
- $37,500
- Closing costs
- $4,500
- Reserves months
- —
- Total cash needed
- —
Loan-product check · same deal, 3 products live
Conventional
25% down · 7.5% · 30yr
- Down + closing
- —
- Monthly P&I
- —
- Monthly cashflow
- —
- DSCR
- —
- Eligible?
- —
Personal DTI + credit; lowest rate.
DSCR
20% down · 8.5% · 30yr
- Down + closing
- —
- Monthly P&I
- —
- Monthly cashflow
- —
- DSCR
- —
- Eligible?
- —
No personal income docs; deal must DSCR.
Hard money
10% down · 12.0% · 12mo
- Down + closing
- —
- Monthly P&I
- —
- Monthly cashflow
- —
- DSCR
- —
- Eligible?
- —
Short-term bridge; refi at stabilization.
Rent comps 24 comps
| Address | Beds | Baths | Sqft | Rent | $/sqft | DOM | Units | Dist |
|---|---|---|---|---|---|---|---|---|
| 3306 Gardenia Ave Apt B Bakersfield, CA | 2.0 | 1.0 | 825 | $1,300 | $1.58 | 43d | 1 | 0.24mi |
| 3017 Potomac Ave Apt 10 Bakersfield, CA | 3.0 | 1.0 | 746 | $995 | $1.33 | 43d | 1 | 0.29mi |
| 3017 Potomac Ave Apt 12 Bakersfield, CA | 3.0 | 1.0 | 746 | $995 | $1.33 | 2d | 1 | 0.29mi |
| 3311 Camellia Dr Bakersfield, CA | 3.0 | 2.0 | 1128 | $1,925 | $1.71 | 43d | 1 | 0.30mi |
| 460 Oswell St Unit B Bakersfield, CA | 3.0 | 2.0 | 1324 | $1,700 | $1.28 | 2d | 1 | 0.33mi |
| 925 Pesante Rd Bakersfield, CA | 3.0 | 2.0 | 1500 | $1,800 | $1.20 | 2d | 1 | 0.47mi |
| 930 Sterling Rd Bakersfield, CA | 3.0 | 1.0 | 848 | $1,150 | $1.36 | 14d | 1 | 0.55mi |
| 2703 Center St Bakersfield, CA | 3.0 | 1.0 | 1000 | $1,550 | $1.55 | 2d | 1 | 0.59mi |
| 1322 Vale St Bakersfield, CA | 3.0 | 2.0 | 1177 | $2,100 | $1.78 | 2d | 1 | 0.66mi |
| 2300 Lake St Unit C Bakersfield, CA | 3.0 | 1.0 | 1105 | $1,650 | $1.49 | 2d | 1 | 1.07mi |
| 820 Moore St Bakersfield, CA | 3.0 | 1.0 | 1084 | $1,600 | $1.48 | 19d | 1 | 1.17mi |
| 2190 Monterey St Unit 9 Bakersfield, CA | 2.0 | 1.0 | 700 | $1,050 | $1.50 | 10d | 1 | 1.19mi |
| 2124 Pacific St Bakersfield, CA | 2.0 | 1.0 | 823 | $1,395 | $1.70 | 2d | 1 | 1.29mi |
| 2010 Larcus Ave Bakersfield, CA | 2.0 | 1.5 | 800 | $1,300 | $1.62 | 3d | 3 | 1.30mi |
| 2010 Larcus Ave Bakersfield, CA | 2.0 | 1.5 | 800 | $1,400 | $1.75 | 21d | 1 | 1.30mi |
| 2010 Larcus Ave Unit 48 Bakersfield, CA | 2.0 | 1.5 | 1000 | $1,200 | $1.20 | 10d | 1 | 1.30mi |
| 2010 Larcus Ave Unit 33 Bakersfield, CA | 2.0 | 1.5 | 800 | $1,200 | $1.50 | 43d | 1 | 1.30mi |
| 2006 Kentucky St Apt 8 Bakersfield, CA | 2.0 | 1.0 | 835 | $1,150 | $1.38 | 2d | 1 | 1.32mi |
| 2006 Kentucky St Apt 48 Bakersfield, CA | 2.0 | 1.0 | 835 | $1,150 | $1.38 | 43d | 1 | 1.32mi |
| 2010 Larcus Ave Unit 13 Bakersfield, CA | 2.0 | 1.5 | 800 | $1,200 | $1.50 | 2d | 1 | 1.33mi |
| 4819 La Posta St Bakersfield, CA | 2.0 | 1.0 | 788 | $1,762 | $2.24 | 2d | 8 | 1.33mi |
| 1603 Palm Dr Bakersfield, CA | 2.0 | 1.0 | 840 | $1,900 | $2.26 | 2d | 1 | 1.45mi |
| 1518 Palm Dr Bakersfield, CA | 2.0 | 1.0 | 715 | $1,100 | $1.54 | 2d | 1 | 1.45mi |
| 720 Beverly Dr Bakersfield, CA | 3.0 | 2.0 | 900 | $1,650 | $1.83 | 43d | 1 | 1.49mi |
Listing history 2 events
-
2025-08-19status Pending
-
2025-08-07$149,999 Active
ⓘ Source: listings_history table (triggers on properties + properties_extension) + one-shot
backfill from property_details.listing_events for pre-trigger history.
Tax reassessment forecast CA · Resets to sale price
- Current annual tax
- $1,124 · $94/mo
- Projected year-2 tax
- $1,140 · $95/mo
- Expected delta
- +$16/yr (+$1/mo · 1.4%)
ⓘ Screening estimate from a state-policy table — verify with the county assessor before closing.
Climate risk First Street
- Flood 1/10 Low FEMA zone X (unshaded) · 0% chance over 30 yrs
- Wildfire 3/10 Moderate
- Heat 8/10 Severe 7 d/yr ≥105°F today · 19 d/yr by 30 yrs out
- Wind 1/10 Low
- Air quality 10/10 Extreme 34 unhealthy d/yr today · 40 by 30 yrs out
Nearby sold comps map
Loading sold comps map…
Walkable amenities ~0.75 mi
Loading nearby amenities…
Taxation est. · year 1
- Rental income
- $19,452
- − Mortgage interest
- −$8,402
- − Property taxes
- −$1,124
- − Insurance
- −$750
- − Repairs & maintenance
- −$1,556
- − Management
- −$1,556
- − Depreciation
- −$4,364
- Taxable income
- $1,699
- Est. tax owed @ 24.0%
- −$408
- After-tax cash flow
- $3,645/yr
For passive investors: Depreciation is non-cash, so a rental often shows a tax loss while cash-flowing — sheltering income. Rental losses are passive: they offset passive income freely, and up to $25,000/yr can offset ordinary (W-2) income if you actively participate and your MAGI is under $100k (phasing out to $0 by $150k); unused losses carry forward. On sale, claimed depreciation is recaptured at up to 25%, and gains may owe capital-gains tax (a 1031 exchange can defer both). Figures are a year-1 estimate at your 24.0% rate — not tax advice; consult a CPA.
Schools (NCES district)
- District
- Kern High
- NCES district ID
- 0619540
- Math proficiency
- 21% ▬ 0.00%
- Reading proficiency
- 51% ▲ 2.00%
- Median HH income
- $49,686
- Composite
- 33.68/100
- National rank
- #10443
- State rank
- #860 of 1400 in CA
Livability — East Niles
No livability data for this city. (Only ~50 U.S. cities are tracked.)
Census & demographics
- Census place
- East Niles, CA
- County
- Kern County · 710,371 people
- Metro
- Bakersfield, CA
- Population (ZIP)
- 74,116
- Household income
- $69,805
- Rent vs Own
- Severe rent burden
- 2871.0
Population outlook (Kern County) Hauer SSP2
- Today (2025)
- 947,286 people
- By 2030
- 978,984 · +3.3%
- By 2040
- 1,045,018 · +10.3%
- By 2050
- 1,105,232 · +16.7%
- By 2075
- 1,229,538 · +29.8%
- By 2100
- 1,238,059 · +30.7%
Race, ethnicity, and origin ACS 2023
- Neighborhood character
- Predominantly Hispanic (67%)
- Race & ethnicity
- Hispanic / Latino 67% White 23% Two or more races 20% Black 3% Asian 2% Native American 1%
- Hispanic origin (detail)
- Mexican 63%
- Common ancestry
- Italian 2% Slovak 1% Russian 1%
- Foreign-born
- 19% · Canada
- Languages at home
- 50% English-only · Spanish 46% Other Asian/Pacific 1% Arabic 1%
Political lean MEDSL · Kern
- 2024 margin
- Strong R (+21.1) · D 38.2% · R 59.3% · Other 2.5%
- 2008→2024 swing
- -3.3pp toward R · 2008: -17.8pp · 2024: -21.1pp
- All cycles
- 2024: R+21.1 2020: R+10.2 2016: R+15.0 2012: R+20.9 2008: R+17.8
Not yet ingested
- Civics
- —
Market trends
- HPI YoY
- ▼ -323.02%
- Current HPI
- 358.5434
- Rent YoY
- ▲ 2.24%
- Metro
- Bakersfield, CA
- State GDP YoY
- ▲ 3.21%
- F500 in state
- 116
Industry mix (Fortune 500 HQ in CA)
| Industry | F500 HQs | Revenue |
|---|---|---|
| Technology | 27 | $1,492B |
|
||
| Financial Services | 3 | $174B |
|
||
| Retail | 3 | $44B |
|
||
| Insurance | 3 | $26B |
|
||
| Media / Entertainment | 2 | $115B |
|
||
| Pharmaceuticals / Biotech | 2 | $62B |
|
||
Price history
2 events — show timeline
- 2025-08-19 Pending — GEMLS
- 2025-08-07 Listed $149,999 GEMLS
Property tax history
-0.0%/yrLatest (2025): $1,124 · +3.1% YoY. Source: county tax records.
Cash-flow waterfall
monthlySold comps — $/sqft
last 12 mo · ≤1 miLoading sold comps…