6502 W Montgomery Rd · Houston, TX
Flood risk 4/10 · Minor
- FEMA flood zone
- X (shaded)
- Chance of flooding over 30 yrs
- 0.22%
- Est. flood insurance / yr
- $507 – $1,088
Fire risk 1/10 · Minimal
- Est. fire insurance / yr
- $1,222 – $2,270
Heat risk 9/10 · Severe
- Hot days now (above 109°F)
- 7 days/yr
- Hot days in 30 yrs
- 24 days/yr
Wind risk 9/10 · Severe
- Chance of severe wind over 30 yrs
- 99.0%
Air-quality risk 3/10 · Minor
- Unhealthy air days now
- 3 days/yr
- Unhealthy air days in 30 yrs
- 4 days/yr
Risk factors via First Street. Map © Google.
Why this score? — see what drove the C+ grade
The composite is a weighted blend of 9 inputs, each scored 0–100. Each bar is that input's sub-score; the figure is the points it added to the 100-point composite (weight × sub-score).
- Cash flow +22.1/30.0
- ARV discount +15.0/15.0
- DSCR +7.1/10.0
- 1% rule +5.3/10.0
- Livability +3.7/5.0
- Rent growth +3.0/5.0
- Schools +2.7/10.0
- Condition / age +2.5/5.0
- Appreciation +0.0/10.0
$239,999
🖨 Deal sheet 📄 Offer letter ✓ Due diligence
Listing remarks MLS
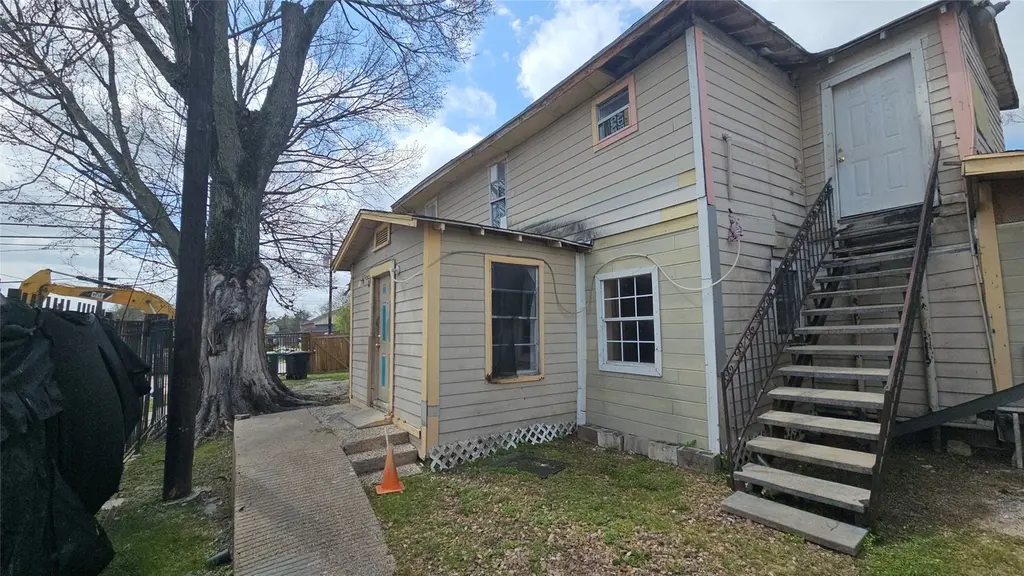
INVESTORS! We just listed this spacious 6-Bedroom Home on CORNER LOT at 6502 W Montgomery Rd, Houston, TX 77091. Welcome to this expansive two-story residence perfectly situated on a desirable corner lot in Houston’s up-and-coming 77091 area. It features SIX LARGE BEDROOMS, 3 full bathrooms, and 2 half baths. This versatile home offers abundant space for large families, multi-generational living, or investment potential. Whether you're looking for a large home with room to grow or an investment opportunity in a rapidly developing area, this property delivers exceptional value. WE MAKE IT EASY TO OWN. This is a great opportunity! Don't wait, call us today to get more information on the owner's easy terms and smooth process that may be able to put the deed in your name and make this your dream property.
Key facts
- 3,589 sq ft lot
- Built 1940
- Listed 251 days
Neighborhood map
What this means for you Summary
Snapshot
- This is a 5-bed/4.0-bath single-family listed at $240k.
Deal economics
- At list price, monthly cash flow is $387 ($5k/yr) — positive.
- The deal already cash-flows at list — no discount required.
- Meets the 1% rule at list price ($2k rent vs $240k).
- Recommended offer: $211k (12.0% below list) — sets the bar for market timing.
- Cap rate 8.2% vs local median 3.2% in Houston — top-decile yield for the area; either an underpriced asset or a hidden risk that comps aren't pricing in. Stress-test before assuming the spread holds.
Location & tenants
- Location reads 74/100 on livability (#184 in TX, #4,771 nationally) — a middle-class / working-renter tenant base. Strengths: amenities A+, cost of living A+, housing A+; Watch: schools D, crime F.
- Houston ISD (urban): math 27% / reading 35% proficiency, ranked #593 of 826 in TX (top 72%) — families likely to look elsewhere, expect single-tenant / working-renter base with shorter leases; 71% free/reduced lunch — lower-income household profile, screen leases tightly.
- Market conditions: Rents rising (+2.1%/yr); 675 active listings in the ZIP; 3 comparable units currently listed for rent nearby; rentals lingering (median 44d on market — plan ~5-8 weeks vacancy on turnover, expect pricing pressure); 67% of comp listings sitting > 30 days — soft ceiling on asking rent; lower-income renter base — watch delinquency; 29,883 units permitted in Harris County in 2024 (8,621 in 5+ unit buildings).
- At $2,465/mo this rent would consume 83% of the median local household income ($35k/yr) (locally 3210% of renters already pay >50% of income on rent) — very limited rent-growth headroom before tenants either downsize or default.
Forward outlook
- Local home prices are declining (-3.0%/yr); year-one equity from $2k of loan paydown is wiped out by about $7k of value loss. Plan a longer hold.
- Harris County population projected at +47% by 2050 — long-run rental-demand tailwind backs the buy-and-hold thesis.
Negotiation context
- It's been on market 251 days — a 12% lower offer ($211k) is reasonable based on typical stale-listing flexibility.
- 9 sale attempts since 19y ago; this cycle's ask is 14026% above the opening price — seller raised mid-cycle; expect resistance to lowballs.
Risks & watch-outs
- Watch-outs: built in 1940 — expect roof / HVAC / electrical / plumbing capex.
- Climate carrying-cost: severe wind risk, 99% chance of damaging wind over 30y; extreme-heat days projected 7→24/yr by 2055 (HVAC capex compounding) — expect insurance premiums to compound above CPI over the hold.
Questions for the listing agent
- It's been on market 251 days. Have you received any prior offers? Is the seller open to a 12% concession, seller financing, or rate buy-down credit?
- Built in 1940 — when were the roof, HVAC, electrical panel, plumbing, and water heater last replaced?
- Why hasn't it sold? Are there any deal-killer items the seller is aware of (foundation, flood, title, zoning, code violations)?
- Is there a deadline driving the sale (1031 exchange, divorce, estate, relocation)? That informs how much negotiation room exists.
- Schools are D-rated, which usually means shorter tenancies and higher turnover. Who's the typical renter profile here, and what's been the actual vacancy rate?
- Crime grade is F in this area — have there been break-ins, vandalism, or insurance claims at this property in the last 3 years? What carrier currently insures it and at what premium?
- What's the average days-on-market for RENTAL listings here right now (not sales)? A rising rental-DOM trend means longer vacancies and softer asking-rent achievability than the comps imply.
- What's the recent tenant-quality profile in this submarket — average credit score on applications, eviction rate, late-payment / NSF rate, and stable-employment percentage? A property-management company in the area should have these aggregated.
- How much new for-sale + rental construction is in the pipeline within 1–3 miles? Heavy new supply typically softens prices + rents 12–24 months out; constrained supply supports both.
Investment metrics
- 1% rule
- 1.03% ✓
- Cap rate
- 8.23%
- Cash-on-cash
- 6.91%
- DSCR
- 1.31
- GRM
- 8.1
CMA / ARV
- ARV (median comp)
- $441,799
- List price
- $239,999
- Delta
- -45.68%
- Verdict
- UNDERPRICED
- Comps
- 3 within 1.0 mi
Show comp detail 8 sales within ~0.75 mi
| Address | Dist | Beds/Ba | Sqft | Sold | Price | $/sf | Match |
|---|---|---|---|---|---|---|---|
| 6519 Utah St | 0.37mi | 4/2.5 (-1) | 2,349 (-2%) | 5mo | $228,000 | $97 | 64 |
| 6506 De Priest St | 0.22mi | 4/3.0 (-1) | 2,728 (+14%) | 0mo | $450,000 | $165 | 58 |
| 6510 Radcliffe St | 0.25mi | 4/2.5 (-1) | 2,348 (-2%) | 21mo | $228,000 | $97 | 56 |
| 6503 Radcliffe St | 0.27mi | 4/2.5 (-1) | 2,348 (-2%) | 21mo | $228,000 | $97 | 55 |
| 6507 Utah St | 0.36mi | 4/2.5 (-1) | 2,349 (-2%) | 21mo | $228,000 | $97 | 51 |
| 6502 Tuskegee St | 0.42mi | 4/2.5 (-1) | 2,349 (-2%) | 20mo | $228,000 | $97 | 49 |
| 1108 Highland Ranch Ln | 0.73mi | 4/3.5 (-1) | 2,250 (-6%) | 20mo | $434,990 | $193 | 32 |
| 5427 Sue Marie Ln | 0.68mi | 4/2.5 (-1) | 2,688 (+12%) | 12mo | $550,000 | $205 | 28 |
Match score weights: distance 35% · size 25% · config 20% · recency 20%. Top-matched comps best support the ARV.
Projected returns pro-forma
-3.0% appreciation · 2.1% rent growth · sell at horizon
- IRR
- -6.7%
- Equity multiple
- 0.75×
- Total profit
- $-16,494
- Equity at exit
- $35,785
- IRR
- 1.8%
- Equity multiple
- 1.12×
- Total profit
- $8,345
- Equity at exit
- $20,751
Cash invested: $67,200 (down + closing). Projections, not guarantees.
Landlord ↔ Tenant lean methodology
- Overall (STATE)
- 87 Strongly Landlord-Friendly
- State Texas
- 87 Strongly Landlord-Friendly · R+5
- County
- — inherits STATE
- City
- — inherits STATE
ZIP-level market 77091
- Home prices YoY
- -24.9%
- Rents YoY
- 2.1%
- Active inventory
- 675
- Price-to-rent
- 8.1×
Monthly cashflow live
- Estimated rent
- $2,465 medium interval (Pro) →
- Mortgage (P&I)
- −$1,259
- Tax from tax record
- −$202 /mo · $2,423/yr
- Insurance
- −$100
- HOA
- −$0
- Vacancy / Maint / Mgmt
- −$518
- Net cashflow
- $387
Break-even live
UW: 25.0% down · 7.5% · 30yr · 1.5% tax · 5.0% vac · 8.0% maint · 8.0% mgmt
Financing live
Cash to close
- Down payment
- $60,000
- Closing costs
- $7,200
- Reserves months
- —
- Total cash needed
- —
Loan-product check · same deal, 3 products live
Conventional
25% down · 7.5% · 30yr
- Down + closing
- —
- Monthly P&I
- —
- Monthly cashflow
- —
- DSCR
- —
- Eligible?
- —
Personal DTI + credit; lowest rate.
DSCR
20% down · 8.5% · 30yr
- Down + closing
- —
- Monthly P&I
- —
- Monthly cashflow
- —
- DSCR
- —
- Eligible?
- —
No personal income docs; deal must DSCR.
Hard money
10% down · 12.0% · 12mo
- Down + closing
- —
- Monthly P&I
- —
- Monthly cashflow
- —
- DSCR
- —
- Eligible?
- —
Short-term bridge; refi at stabilization.
Rent comps 3 comps
| Address | Beds | Baths | Sqft | Rent | $/sqft | DOM | Units | Dist |
|---|---|---|---|---|---|---|---|---|
| 6513 Knox St Houston, TX | 4.0 | 3.0 | 1773 | $2,100 | $1.18 | 43d | 1 | 0.29mi |
| 774 Dillard St Houston, TX | 4.0 | 2.5 | 1899 | $2,405 | $1.27 | 20d | 1 | 0.47mi |
| 402 Del Norte St Houston, TX | 4.0 | 2.0 | 1790 | $2,300 | $1.28 | 43d | 1 | 1.33mi |
Listing history 39 events
-
2026-06-18days on market $239,999 Active 251 DOM
-
2026-06-17days on market $239,999 Active 250 DOM
-
2026-06-16days on market $239,999 Active 249 DOM
-
2026-06-15days on market $239,999 Active 248 DOM
-
2026-06-13days on market $239,999 Active 246 DOM
-
2026-06-10days on market $239,999 Active 242 DOM
-
2026-06-08days on market $239,999 Active 241 DOM
-
2026-06-07days on market $239,999 Active 240 DOM
-
2026-06-04days on market $239,999 Active 237 DOM
-
2026-06-01days on market $239,999 Active 234 DOM
-
2026-05-31days on market $239,999 Active 233 DOM
-
2026-02-17price $239,999 819-char remark
Show marketing remark (819 chars)
INVESTORS! We just listed this spacious 6-Bedroom Home on CORNER LOT at 6502 W Montgomery Rd, Houston, TX 77091. Welcome to this expansive two-story residence perfectly situated on a desirable corner lot in Houston’s up-and-coming 77091 area. It features SIX LARGE BEDROOMS, 3 full bathrooms, and 2 half baths. This versatile home offers abundant space for large families, multi-generational living, or investment potential. Whether you're looking for a large home with room to grow or an investment opportunity in a rapidly developing area, this property delivers exceptional value. WE MAKE IT EASY TO OWN. This is a great opportunity! Don't wait, call us today to get more information on the owner's easy terms and smooth process that may be able to put the deed in your name and make this your dream property.
-
2025-10-11$1,699
-
2025-10-10$249,999 Active 819-char remark
Show marketing remark (819 chars)
INVESTORS! We just listed this spacious 6-Bedroom Home on CORNER LOT at 6502 W Montgomery Rd, Houston, TX 77091. Welcome to this expansive two-story residence perfectly situated on a desirable corner lot in Houston’s up-and-coming 77091 area. It features SIX LARGE BEDROOMS, 3 full bathrooms, and 2 half baths. This versatile home offers abundant space for large families, multi-generational living, or investment potential. Whether you're looking for a large home with room to grow or an investment opportunity in a rapidly developing area, this property delivers exceptional value. WE MAKE IT EASY TO OWN. This is a great opportunity! Don't wait, call us today to get more information on the owner's easy terms and smooth process that may be able to put the deed in your name and make this your dream property.
-
2024-12-16historical
-
2024-10-28price $165,000
-
2024-10-28status Active
-
2024-10-22historical
-
2024-09-03price $175,000
-
2024-08-26price $180,000
-
2024-08-17price $190,000
-
2024-08-13price $200,000
-
2024-06-25price $220,000
-
2024-05-30$230,000 Active
-
2019-05-22soldstatus
-
2013-05-08soldstatus Sold
-
2013-04-26status Pending
-
2013-04-22$24,900 Active
-
2012-06-22soldstatus
-
2012-04-27historical
-
2012-02-14historical
-
2012-01-20$38,000
-
2012-01-20$27,200
-
2009-01-16historical
-
2008-05-27$88,000
-
2008-02-29historical
-
2007-02-27$79,999
-
2004-06-01soldstatus
-
1992-11-30soldstatus
ⓘ Source: listings_history table (triggers on properties + properties_extension) + one-shot
backfill from property_details.listing_events for pre-trigger history.
Tax reassessment forecast TX · Resets to sale price
- Current annual tax
- $2,423 · $202/mo
- Projected year-2 tax
- $4,392 · $366/mo
- Expected delta
- +$1,969/yr (+$164/mo · 81.3%)
ⓘ Screening estimate from a state-policy table — verify with the county assessor before closing.
Climate risk First Street
- Flood 4/10 Moderate FEMA zone X (shaded) · 22% chance over 30 yrs
- Wildfire 1/10 Low
- Heat 9/10 Extreme 7 d/yr ≥109°F today · 24 d/yr by 30 yrs out
- Wind 9/10 Extreme 99% chance of damaging wind over 30 yrs
- Air quality 3/10 Moderate 3 unhealthy d/yr today · 4 by 30 yrs out
Nearby sold comps map
Loading sold comps map…
Walkable amenities ~0.75 mi
Loading nearby amenities…
Taxation est. · year 1
- Rental income
- $29,578
- − Mortgage interest
- −$13,444
- − Property taxes
- −$2,423
- − Insurance
- −$1,200
- − Repairs & maintenance
- −$2,366
- − Management
- −$2,366
- − Depreciation
- −$6,982
- Taxable income
- $797
- Est. tax owed @ 24.0%
- −$191
- After-tax cash flow
- $4,449/yr
For passive investors: Depreciation is non-cash, so a rental often shows a tax loss while cash-flowing — sheltering income. Rental losses are passive: they offset passive income freely, and up to $25,000/yr can offset ordinary (W-2) income if you actively participate and your MAGI is under $100k (phasing out to $0 by $150k); unused losses carry forward. On sale, claimed depreciation is recaptured at up to 25%, and gains may owe capital-gains tax (a 1031 exchange can defer both). Figures are a year-1 estimate at your 24.0% rate — not tax advice; consult a CPA.
Schools (NCES district)
- District
- Houston ISD
- NCES district ID
- 4823640
- Math proficiency
- 27% ▼ -18.00%
- Reading proficiency
- 35% ▼ -6.00%
- Median HH income
- $46,054
- Composite
- 26.63/100
- National rank
- #7173
- State rank
- #593 of 826 in TX
Livability — Houston
- Score
- 74/100
- State rank
- #184
- US rank
- #4771
Category grades
Schools grade is shown separately in the Schools card above.
Census & demographics
- Census place
- Houston, TX
- County
- Harris County · 4,702,590 people
- City population
- 3,226,434
- Metro
- Houston-The Woodlands-Sugar Land, TX
- Population (ZIP)
- 28,728
- Household income
- $35,432
- Rent vs Own
- Severe rent burden
- 3210.0
Population outlook (Harris County) Hauer SSP2
- Today (2025)
- 5,571,493 people
- By 2030
- 6,089,821 · +9.3%
- By 2040
- 7,142,806 · +28.2%
- By 2050
- 8,185,864 · +46.9%
- By 2075
- 10,574,329 · +89.8%
- By 2100
- 12,109,958 · +117.4%
Race, ethnicity, and origin ACS 2023
- Neighborhood character
- Diverse neighborhood (Simpson 0.58)
- Race & ethnicity
- Hispanic / Latino 46% Black 45% Two or more races 15% White 7%
- Hispanic origin (detail)
- Mexican 29%
- Common ancestry
- Italian 1%
- Foreign-born
- 24% · Canada, Jamaica
- Languages at home
- 55% English-only · Spanish 41% French/Haitian/Cajun 2%
Political lean MEDSL · Harris
- 2024 margin
- Lean D (+5.5) · D 52.0% · R 46.4% · Other 1.6%
- 2008→2024 swing
- +3.9pp toward D · 2008: 1.6pp · 2024: 5.5pp
- All cycles
- 2024: D+5.5 2020: D+13.3 2016: D+12.4 2012: D+0.1 2008: D+1.6
Not yet ingested
- Civics
- —
Market trends
- HPI YoY
- ▼ -94.19%
- Current HPI
- 283.7523
- Rent YoY
- ▲ 2.10%
- Metro
- Houston-The Woodlands-Sugar Land, TX
- State GDP YoY
- ▲ 3.95%
- F500 in state
- 110
Industry mix (Fortune 500 HQ in TX)
| Industry | F500 HQs | Revenue |
|---|---|---|
| Energy | 16 | $1,198B |
|
||
| Technology | 5 | $198B |
|
||
| Engineering / Construction | 4 | $72B |
|
||
| Energy Services | 3 | $60B |
|
||
| Utilities | 3 | $41B |
|
||
| Healthcare | 2 | $330B |
|
||
Price history
+200.0% since first listed28 events — show timeline
- 2026-02-17 Price Changed $239,999 HARMLS
- 2025-10-11 Listed for Rent $1,699 HARMLS
- 2025-10-10 Listed $249,999 HARMLS
- 2024-12-16 Listing Removed — HARMLS
- 2024-10-28 Price Changed $165,000 HARMLS
- 2024-10-28 Relisted — HARMLS
- 2024-10-22 Listing Removed — HARMLS
- 2024-09-03 Price Changed $175,000 HARMLS
- 2024-08-26 Price Changed $180,000 HARMLS
- 2024-08-17 Price Changed $190,000 HARMLS
- 2024-08-13 Price Changed $200,000 HARMLS
- 2024-06-25 Price Changed $220,000 HARMLS
- 2024-05-30 Listed $230,000 HARMLS
- 2019-05-22 Sold (Public Records) — Public Records
- 2013-05-08 Sold (MLS) — HARMLS
- 2013-04-26 Pending — HARMLS
- 2013-04-22 Listed $24,900 HARMLS
- 2012-06-22 Sold (MLS) — HARMLS
- 2012-04-27 Listing Removed — HARMLS
- 2012-02-14 Listing Removed — HARMLS
- 2012-01-20 Listed $27,200 HARMLS
- 2012-01-20 Listed $38,000 HARMLS
- 2009-01-16 Listing Removed — HARMLS
- 2008-05-27 Listed $88,000 HARMLS
- 2008-02-29 Listing Removed — HARMLS
- 2007-02-27 Listed $79,999 HARMLS
- 2004-06-01 Sold (Public Records) — Public Records
- 1992-11-30 Sold (Public Records) — Public Records
Property tax history
+7.8%/yrLatest (2025): $2,423 · +11.4% YoY. Source: county tax records.
Cash-flow waterfall
monthlySold comps — $/sqft
last 12 mo · ≤1 miLoading sold comps…