1325 Fairview Ave N · Seattle, WA
Flood risk No data
- FEMA flood zone
- —
- Chance of flooding over 30 yrs
- —
- Est. flood insurance / yr
- —
Fire risk No data
- Est. fire insurance / yr
- —
Heat risk No data
- Hot days now (above threshold)
- —
- Hot days in 30 yrs
- —
Wind risk No data
- Chance of severe wind over 30 yrs
- —
Air-quality risk No data
- Unhealthy air days now
- —
- Unhealthy air days in 30 yrs
- —
Risk factors via First Street. Map © Google.
Why this score? — see what drove the B+ grade
The composite is a weighted blend of 9 inputs, each scored 0–100. Each bar is that input's sub-score; the figure is the points it added to the 100-point composite (weight × sub-score).
- Cash flow +28.5/30.0
- ARV discount +15.0/15.0
- DSCR +10.0/10.0
- 1% rule +7.9/10.0
- Schools +6.1/10.0
- Condition / age +4.0/5.0
- Livability +3.8/5.0
- Rent growth +3.1/5.0
- Appreciation +0.0/10.0
$150,000
🖨 Deal sheet (PDF) 📄 Offer letter ✓ Due diligence
Listing remarks
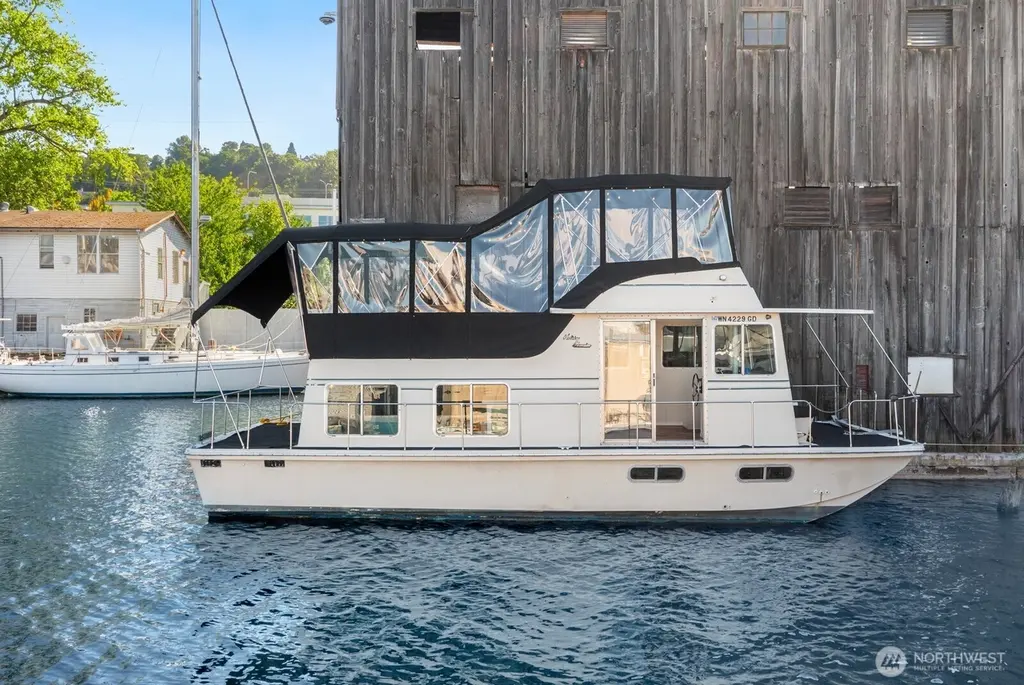
Updated, City-registered houseboat (FOWR 975) on Lake Union offering comfort, charm, and flexibility. Step inside to refinished hardwood floors leading to an updated galley kitchen with seating, fresh paint, new appliances, and fixtures. The light-filled living area features a new propane fireplace for cozy evenings. Below is a private bedroom and updated full bath with new VacuFlush toilet; above, a heated upper deck enclosure with generous seating for guests. All exterior decks have new carpet. Also new: water heater. It can't stay at this location; the seller will assist with relocation—ask your agent for a marina list. Includes 207 sf heated patio within 527 sf total. Seller finan
Key facts
- Lake union
- New appliances
- New fixtures
Tags
Neighborhood map
What this means for you Summary
Snapshot
- This is a 1-bed/1.0-bath other listed at $150k. Condition is rated good.
Deal economics
- At list price, monthly cash flow is $492 ($6k/yr) — positive.
- The deal already cash-flows at list — no discount required.
- Meets the 1% rule at list price ($2k rent vs $150k).
- Recommended offer: $132k (12.0% below list) — sets the bar for market timing.
- Cap rate 10.2% vs local median 1.6% in Seattle — top-decile yield for the area; either an underpriced asset or a hidden risk that comps aren't pricing in. Stress-test before assuming the spread holds.
Location & tenants
- Location reads 75/100 on livability (#166 in WA, #4,033 nationally) — a middle-class / working-renter tenant base. Strengths: amenities A+, commute A+, employment A+; Watch: crime F, cost of living F.
- Seattle Public Schools (urban): math 64% / reading 72% proficiency, ranked #19 of 291 in WA (top 6%) — acceptable for families but not a draw, mixed tenant base, ~2y average lease.
- Market conditions: Rents rising (+2.5%/yr); 192 active listings in the ZIP; 40 comparable units currently listed for rent nearby; rentals leasing fast (median 0d on market — plan ~1-2 weeks tenant-placement turnaround); high-income renter base; 10,555 units permitted in King County in 2024 (7,119 in 5+ unit buildings).
Forward outlook
- Local home prices are declining (-3.0%/yr); year-one equity from $1k of loan paydown is wiped out by about $4k of value loss. Plan a longer hold.
- King County population projected at +44% by 2050 — long-run rental-demand tailwind backs the buy-and-hold thesis.
- At projected returns (-3.0% appreciation + 2.5% rent growth), your $42k cash investment doubles in ~9 years — after that, you're playing with house money.
Negotiation context
- It's been on market 311 days — a 12% lower offer ($132k) is reasonable based on typical stale-listing flexibility.
Questions for the listing agent
- It's been on market 311 days. Have you received any prior offers? Is the seller open to a 12% concession, seller financing, or rate buy-down credit?
- Why hasn't it sold? Are there any deal-killer items the seller is aware of (foundation, flood, title, zoning, code violations)?
- Is there a deadline driving the sale (1031 exchange, divorce, estate, relocation)? That informs how much negotiation room exists.
- Schools are A-rated — typically a magnet for longer-tenancy family renters. What's the average tenant stay here, and is there a school-zone premium baked into asking?
- Crime grade is F in this area — have there been break-ins, vandalism, or insurance claims at this property in the last 3 years? What carrier currently insures it and at what premium?
- What's the average days-on-market for RENTAL listings here right now (not sales)? A rising rental-DOM trend means longer vacancies and softer asking-rent achievability than the comps imply.
- What's the recent tenant-quality profile in this submarket — average credit score on applications, eviction rate, late-payment / NSF rate, and stable-employment percentage? A property-management company in the area should have these aggregated.
- How much new for-sale + rental construction is in the pipeline within 1–3 miles? Heavy new supply typically softens prices + rents 12–24 months out; constrained supply supports both.
Investment metrics
- 1% rule
- 1.29% ✓
- Cap rate
- 10.23%
- Cash-on-cash
- 14.06%
- DSCR
- 1.63
- GRM
- 6.5
CMA / ARV
- ARV (median comp)
- $218,500
- List price
- $150,000
- Delta
- -31.35%
- Verdict
- UNDERPRICED
- Comps
- 2 within 1.0 mi
Projected returns pro-forma
-3.0% appreciation · 2.52% rent growth · sell at horizon
- IRR
- 3.8%
- Equity multiple
- 1.15×
- Total profit
- $6,134
- Equity at exit
- $22,365
- IRR
- 12.9%
- Equity multiple
- 2.00×
- Total profit
- $42,036
- Equity at exit
- $12,969
Cash invested: $42,000 (down + closing). Projections, not guarantees.
Landlord ↔ Tenant lean methodology
- Overall (CITY)
- 0 Strongly Tenant-Friendly
- State Washington
- 28 Tenant-Leaning · D+8
- County
- — inherits STATE
- City Seattle
- 0 Strongly Tenant-Friendly · D+52
ZIP-level market 98102
- Rents YoY
- 2.5%
- Active inventory
- 192
- Price-to-rent
- 6.5×
Monthly cashflow live
- Estimated rent
- $1,935 high interval (Pro) →
- Mortgage (P&I)
- −$787
- Tax est. 1.5%
- −$188 /mo · $2,250/yr
- Insurance
- −$62
- HOA
- −$0
- Vacancy / Maint / Mgmt
- −$406
- Net cashflow
- $492
Break-even live
Sensitivity live
| Price | -10% $596 | -5% $544 | +0% $492 | +5% $440 | +10% $388 |
|---|---|---|---|---|---|
| Rent | -10% $339 | -5% $416 | +0% $492 | +5% $569 | +10% $645 |
| Rate | -1.0pp $568 | -0.5pp $530 | base $492 | +0.5pp $453 | +1.0pp $414 |
UW: 25.0% down · 7.5% · 30yr · 1.5% tax · 5.0% vac · 8.0% maint · 8.0% mgmt
Financing live
Cash to close
- Down payment
- $37,500
- Closing costs
- $4,500
- Reserves months
- —
- Total cash needed
- —
Loan-product check · same deal, 3 products live
Conventional
25% down · 7.5% · 30yr
- Down + closing
- —
- Monthly P&I
- —
- Monthly cashflow
- —
- DSCR
- —
- Eligible?
- —
Personal DTI + credit; lowest rate.
DSCR
20% down · 8.5% · 30yr
- Down + closing
- —
- Monthly P&I
- —
- Monthly cashflow
- —
- DSCR
- —
- Eligible?
- —
No personal income docs; deal must DSCR.
Hard money
10% down · 12.0% · 12mo
- Down + closing
- —
- Monthly P&I
- —
- Monthly cashflow
- —
- DSCR
- —
- Eligible?
- —
Short-term bridge; refi at stabilization.
Rent comps 40 comps
| Address | Beds | Baths | Sqft | Rent | $/sqft | DOM | Units | Dist |
|---|---|---|---|---|---|---|---|---|
| 1520 Eastlake Ave E #212 Seattle, WA | 2.0 | 1.0–2.0 | 823 | $2,780 | $3.38 | 0d | 2 | 0.12mi |
| 1524 Eastlake Ave E Seattle, WA | 1.0 | 1.0–1.5 | 759 | $3,919 | $5.16 | 0d | 10 | 0.13mi |
| 210 E Blaine St Seattle, WA | 1.0–2.0 | 1.0–1.5 | 755 | $1,950 | $2.58 | 0d | 3 | 0.27mi |
| 1027 Bellevue Ct E Seattle, WA | 1.0 | 1.0 | 507 | $1,595 | $3.15 | 15d | 1 | 0.31mi |
| 1940 Yale Ave. E. Seattle, WA | 1.0 | 1.0 | 720 | $1,975 | $2.74 | 44d | 1 | 0.32mi |
| 1940 Yale Ave. E. Seattle, WA | 1.0 | 1.0 | 720 | $1,995 | $2.77 | 0d | 1 | 0.32mi |
| 1917 Eastlake Ave E Apt H Seattle, WA | — | 1.0 | 350 | $1,195 | $3.41 | 15d | 1 | 0.32mi |
| 1917 Eastlake Ave E Unit K Seattle, WA | — | 1.0 | 350 | $1,295 | $3.70 | 15d | 1 | 0.32mi |
| 1917 Eastlake Ave E Apt E Seattle, WA | — | 1.0 | 350 | $995 | $2.84 | 15d | 1 | 0.32mi |
| 1004 Belmont Ave E Seattle, WA | 1.0 | 1.0 | 740 | $2,195 | $2.97 | 0d | 1 | 0.33mi |
| 2001 Eastlake Ave E Seattle, WA | 1.0 | 1.0 | 550 | $1,495 | $2.72 | 0d | 1 | 0.35mi |
| 768 Bellevue Ave E Unit 12 Seattle, WA | — | 1.0 | 380 | $1,395 | $3.67 | 45d | 1 | 0.36mi |
| 2020 Minor Ave E Seattle, WA | 1.0 | 1.0 | 690 | $2,000 | $2.90 | 0d | 1 | 0.38mi |
| 752 Bellevue Ave E #110 Seattle, WA | 1.0 | 1.0 | 448 | $1,850 | $4.13 | 2d | 1 | 0.38mi |
| 752 Bellevue Ave E Seattle, WA | 1.0 | 1.0 | 448 | $1,775 | $3.96 | 2d | 2 | 0.38mi |
| 752 Bellevue Ave E Seattle, WA | 1.0 | 1.0 | 448 | $1,775 | $3.96 | 0d | 2 | 0.38mi |
| 258 E Newton St Apt 1 Seattle, WA | 1.0 | 1.0 | 700 | $1,895 | $2.71 | 44d | 1 | 0.38mi |
| 736 Bellevue Pl E Seattle, WA | 2.0 | 1.0 | 589 | $2,270 | $3.85 | 0d | 10 | 0.40mi |
| 1132 10th Ave E Apt C Seattle, WA | 1.0 | 1.0 | 550 | $1,199 | $2.18 | 44d | 1 | 0.41mi |
| 1101 10th Ave E Seattle, WA | 1.0 | 1.0 | 520 | $1,535 | $2.95 | 4d | 1 | 0.41mi |
| 2031 Franklin Ave E Seattle, WA | 1.0 | 1.0 | 718 | $1,895 | $2.64 | 2d | 1 | 0.41mi |
| 733 Summit Ave E Seattle, WA | 1.0 | 1.0 | 650 | $1,865 | $2.87 | 0d | 1 | 0.43mi |
| 2046 Franklin Ave E Unit 3 Seattle, WA | 1.0 | 1.0 | 450 | $1,695 | $3.77 | 0d | 1 | 0.45mi |
| 2037 Boylston Ave E Unit A Seattle, WA | 2.0 | 1.0 | 750 | $2,495 | $3.33 | 0d | 1 | 0.45mi |
| 2037 Boylston Ave E Seattle, WA | 2.0 | 1.0 | 750 | $2,495 | $3.33 | 2d | 1 | 0.45mi |
| 703 Bellevue Ave E Seattle, WA | 1.0 | 1.0 | 533 | $2,595 | $4.87 | 0d | 8 | 0.47mi |
| 703 Bellevue Ave E Seattle, WA | 2.0 | 1.0–1.5 | 747 | $2,345 | $3.14 | 14d | 14 | 0.47mi |
| 2210 Eastlake Ave E Seattle, WA | 1.0 | 1.0 | 366 | $1,975 | $5.40 | 0d | 3 | 0.47mi |
| 2210 Eastlake Ave E Seattle, WA | 1.0 | 1.0 | 385 | $1,785 | $4.64 | 44d | 3 | 0.47mi |
| 2214 Yale Ave E Seattle, WA | — | 1.0 | 700 | $1,695 | $2.42 | 2d | 1 | 0.47mi |
| 624 Yale Ave N Seattle, WA | 2.0 | 1.0–2.0 | 625 | $2,535 | $4.05 | 0d | 14 | 0.50mi |
| 910 10th Ave E Seattle, WA | 1.0 | 1.0 | 476 | $1,775 | $3.73 | 0d | 1 | 0.50mi |
| 1000 E Aloha St Seattle, WA | 1.0 | 1.0 | 650 | $1,695 | $2.61 | 2d | 1 | 0.51mi |
| 734 Broadway E Apt 101 Seattle, WA | — | 1.0 | 411 | $1,350 | $3.28 | 44d | 1 | 0.52mi |
| 2245 Yale Ave E Seattle, WA | 1.0 | 1.0 | 400 | $1,350 | $3.38 | 0d | 3 | 0.52mi |
| 2231 Franklin Ave E Unit 304 Seattle, WA | 2.0 | 1.0 | 700 | $2,100 | $3.00 | 21d | 1 | 0.53mi |
| 531 Bellevue Ave E Seattle, WA | 1.0 | 1.0 | 624 | $1,906 | $3.05 | 0d | 2 | 0.55mi |
| 603 Pontius Ave N Seattle, WA | — | 1.0 | 615 | $1,818 | $2.96 | 0d | 2 | 0.56mi |
| 526 Yale Ave N Seattle, WA | 2.0 | 1.0–2.0 | 673 | $2,540 | $3.77 | 0d | 14 | 0.56mi |
| 527 Summit Ave E Unit 303 Seattle, WA | 1.0 | 1.0 | 625 | $1,595 | $2.55 | 0d | 1 | 0.57mi |
Listing history 20 events
-
2026-06-21days on market $150,000 Active 311 DOM
-
2026-06-19days on market $150,000 Active 310 DOM
-
2026-06-18days on market $150,000 Active 309 DOM
-
2026-06-17days on market $150,000 Active 308 DOM
-
2026-06-16days on market $150,000 Active 307 DOM
-
2026-06-15days on market $150,000 Active 306 DOM
-
2026-06-15days on market $150,000 Active 305 DOM
-
2026-06-13days on market $150,000 Active 304 DOM
-
2026-06-12days on market $150,000 Active 303 DOM
-
2026-06-10days on market $150,000 Active 301 DOM
-
2026-06-09days on market $150,000 Active 300 DOM
-
2026-06-08days on market $150,000 Active 299 DOM
-
2026-06-07days on market $150,000 Active 298 DOM
-
2026-06-07days on market $150,000 Active 297 DOM
-
2026-06-04days on market $150,000 Active 295 DOM
-
2026-06-03days on market $150,000 Active 294 DOM
-
2026-06-02days on market $150,000 Active 293 DOM
-
2026-06-01days on market $150,000 Active 292 DOM
-
2026-05-31days on market $150,000 Active 291 DOM
-
2025-08-13$150,000 Active
ⓘ Source: listings_history table (triggers on properties + properties_extension) + one-shot
backfill from property_details.listing_events for pre-trigger history.
Nearby sold comps map
Loading sold comps map…
Walkable amenities ~0.75 mi
Loading nearby amenities…
Taxation est. · year 1
- Rental income
- $23,221
- − Mortgage interest
- −$8,402
- − Property taxes
- −$2,250
- − Insurance
- −$750
- − Repairs & maintenance
- −$1,858
- − Management
- −$1,858
- − Depreciation
- −$4,364
- Taxable income
- $3,739
- Est. tax owed @ 24.0%
- −$897
- After-tax cash flow
- $5,008/yr
For passive investors: Depreciation is non-cash, so a rental often shows a tax loss while cash-flowing — sheltering income. Rental losses are passive: they offset passive income freely, and up to $25,000/yr can offset ordinary (W-2) income if you actively participate and your MAGI is under $100k (phasing out to $0 by $150k); unused losses carry forward. On sale, claimed depreciation is recaptured at up to 25%, and gains may owe capital-gains tax (a 1031 exchange can defer both). Figures are a year-1 estimate at your 24.0% rate — not tax advice; consult a CPA.
Condition & rehab AI · 14 photos
This houseboat is in excellent condition with recent updates, making it move-in ready for both resale and rental.
Value-add opportunities
- Both Painting the exterior and interior walls — Fresh paint enhances curb appeal and interior aesthetics.
- Both Re-carpeting the exterior decks — New carpet improves comfort and adds value for both resale and rental.
Renovation cost estimate screening
Value-add ROI direction
- Both Painting the exterior and interior walls — Fresh paint enhances curb appeal and interior aesthetics. ↑
- Both Re-carpeting the exterior decks — New carpet improves comfort and adds value for both resale and rental. ↑
ⓘ Cost ranges are severity-bucket heuristics (US national rule-of-thumb). Get contractor quotes + a written scope before underwriting a rehab budget.
Schools (NCES district)
- District
- Seattle Public Schools
- NCES district ID
- 5307710
- Math proficiency
- 64% ▼ -1.00%
- Reading proficiency
- 72% ▬ 0.00%
- Median HH income
- $68,695
- Composite
- 60.76/100
- National rank
- #1649
- State rank
- #19 of 291 in WA
Livability — Seattle
- Score
- 75/100
- State rank
- #166
- US rank
- #4033
Category grades
Schools grade is shown separately in the Schools card above.
Census & demographics
- Census place
- Seattle, WA
- County
- King County · 2,251,916 people
- City population
- 706,262
- Metro
- Seattle-Tacoma-Bellevue, WA
- Population (ZIP)
- 27,333
- Household income
- $114,925
- Rent vs Own
- Severe rent burden
- 1711.0
Population outlook (King County) Hauer SSP2
- Today (2025)
- 2,576,485 people
- By 2030
- 2,803,316 · +8.8%
- By 2040
- 3,255,921 · +26.4%
- By 2050
- 3,706,444 · +43.9%
- By 2075
- 4,746,063 · +84.2%
- By 2100
- 5,407,730 · +109.9%
Race, ethnicity, and origin ACS 2023
- Neighborhood character
- Predominantly White (68%)
- Race & ethnicity
- White 68% Asian 12% Two or more races 12% Hispanic / Latino 8% Black 2%
- Hispanic origin (detail)
- Mexican 4%
- Common ancestry
- Italian 4% Portuguese 3% Slovak 3%
- Foreign-born
- 15% · Canada, China, South Korea
- Languages at home
- 84% English-only · Spanish 4% Chinese 3% Other Indo-European 2%
Political lean MEDSL · King
- 2024 margin
- Solid D (+51.7) · D 74.2% · R 22.5% · Other 3.4%
- 2008→2024 swing
- +9.6pp toward D · 2008: 42.1pp · 2024: 51.7pp
- All cycles
- 2024: D+51.7 2020: D+52.7 2016: D+50.4 2012: D+39.9 2008: D+42.1
Not yet ingested
- Civics
- —
Market trends
- HPI YoY
- ▼ -386.18%
- Current HPI
- 213.5569
- Rent YoY
- ▲ 2.52%
- Metro
- Seattle-Tacoma-Bellevue, WA
- State GDP YoY
- ▲ 4.65%
- F500 in state
- 22
Industry mix (Fortune 500 HQ in WA)
| Industry | F500 HQs | Revenue |
|---|---|---|
| Retail | 2 | $269B |
|
||
| Technology / Retail | 1 | $638B |
|
||
| Technology | 1 | $245B |
|
||
| Telecommunications | 1 | $38B |
|
||
| Food / Beverage | 1 | $36B |
|
||
| Automotive / Trucks | 1 | $34B |
|
||
Price history
1 event — show timeline
- 2025-08-13 Listed $150,000 NWMLS as Distributed by MLS Grid
Cash-flow waterfall
monthlySold comps — $/sqft
last 12 mo · ≤1 miLoading sold comps…