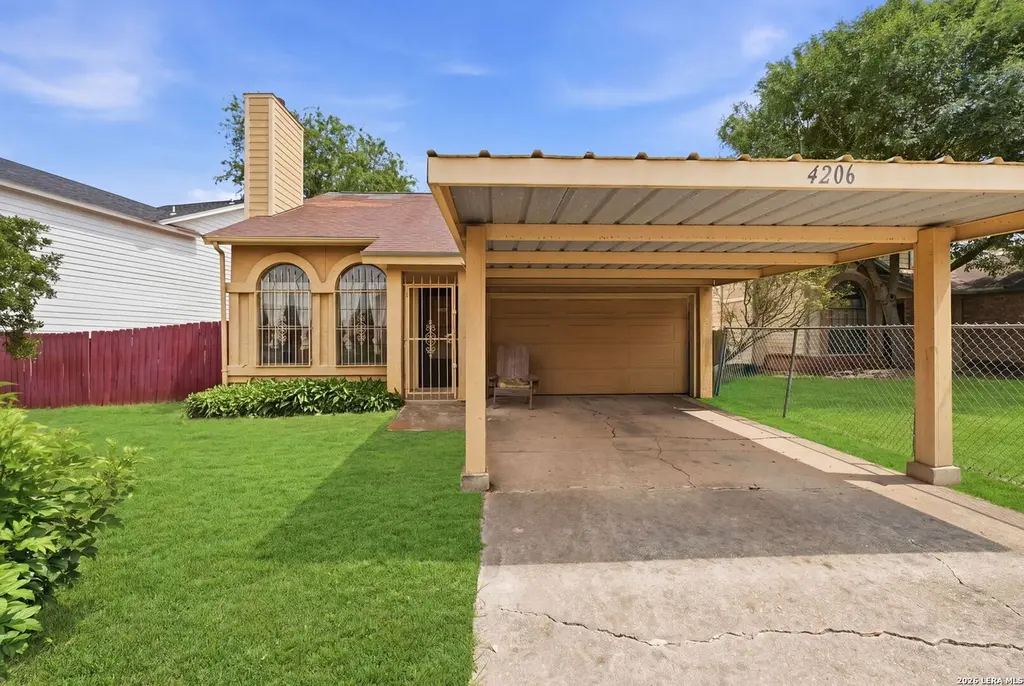
4206 Sunrise Creek Dr · San Antonio, TX
Flood risk 1/10 · Minimal
- FEMA flood zone
- X (unshaded)
- Chance of flooding over 30 yrs
- 0.0%
- Est. flood insurance / yr
- $507 – $1,088
Fire risk 4/10 · Minor
- Est. fire insurance / yr
- $1,222 – $2,270
Heat risk 8/10 · Major
- Hot days now (above 108°F)
- 7 days/yr
- Hot days in 30 yrs
- 22 days/yr
Wind risk 8/10 · Major
- Chance of severe wind over 30 yrs
- 80.0%
Air-quality risk 2/10 · Minimal
- Unhealthy air days now
- 0 days/yr
- Unhealthy air days in 30 yrs
- 1 days/yr
Risk factors via First Street. Map © Google.
Why this score? — see what drove the B+ grade
The composite is a weighted blend of 9 inputs, each scored 0–100. Each bar is that input's sub-score; the figure is the points it added to the 100-point composite (weight × sub-score).
- Cash flow +29.9/30.0
- ARV discount +15.0/15.0
- 1% rule +10.0/10.0
- DSCR +10.0/10.0
- Livability +4.0/5.0
- Rent growth +2.7/5.0
- Condition / age +2.5/5.0
- Schools +2.4/10.0
- Appreciation +0.0/10.0
$100,000
🖨 Deal sheet 📄 Offer letter ✓ Due diligence
Listing remarks
This 3-bedroom, 2-bath home offers 1,086 sq ft of living space with high ceilings, arched front windows, and a cozy fireplace that create a bright and inviting main living area. The kitchen features ample cabinet storage and a convenient pass-through overlooking the living space, giving the home an open and connected feel. Enjoy the convenience of an attached garage, covered carport, and a spacious backyard with mature trees and a deck perfect for relaxing, gardening, or entertaining. Per seller, the AC system is less than 2 years old, a recent HVAC tune-up has been completed, and the home and carpets have been professionally cleaned prior to listing. Conveniently located near schools, shop
Key facts
- Attached garage
- Covered carport
- Cozy fireplace
Tags
Property features AI
Finance
- Other: Possession at closing/funding
- Financial info: Down payment assistance resources available
- HOA & community: Subdivision: SUNRISE
Exterior
- Parking: Attached 1-car garage
- Utilities: City water and sewer
- Home design: Pre-owned single-family home; Approximately 40 years old; Slab foundation; Wood exterior; Other roof type (see remarks)
- Construction: Wood exterior; Slab foundation; Other roof type (see remarks); Built about 40 years ago
- Exterior features: Deck/balcony; Privacy fence
Interior
- Kitchen: Cook top; Built-in oven; Eat-in kitchen (8 x 14)
- Bedrooms: Primary bedroom 10 x 16 with full bath; Bedroom 2 9 x 9; Bedroom 3 9 x 13
- Flooring: Carpeting; Linoleum flooring
- Bathrooms: 2 full bathrooms; Primary bath with tub/shower combination, single vanity and garden tub; Primary bath 5 x 10
- Heating & cooling: Electric heat; Central air conditioning
- Interior features: Ceiling fans; Eat-in kitchen; Utility room inside; Utility area in garage; Some window coverings remain; Living room fireplace; 1 living area
- Laundry & utility: Washer connection; Dryer connection; Utility room inside; Utility area in garage
Neighborhood map
What this means for you Summary
Snapshot
- This is a 3-bed/2.0-bath single-family listed at $100k.
Deal economics
- At list price, monthly cash flow is $370 ($4k/yr) — positive.
- The deal already cash-flows at list — no discount required.
- Meets the 1% rule at list price ($2k rent vs $100k).
- Recommended offer: $97k (3.0% below list) — sets the bar for market timing.
- Cap rate 10.7% vs local median 3.8% in San Antonio — top-decile yield for the area; either an underpriced asset or a hidden risk that comps aren't pricing in. Stress-test before assuming the spread holds.
Location & tenants
- Location reads 80/100 on livability (#31 in TX, #1,616 nationally) — a professional / high-income tenant draw. Strengths: amenities A+, commute A+, cost of living A+; Watch: crime F.
- Judson ISD (suburban): math 21% / reading 33% proficiency, ranked #660 of 826 in TX (top 80%) — low school quality limits family demand, transient renter base, plan for 1-2y turnover.
- Zoned schools: William Paschall El (math 16% / reading 29%, grade F, #3,311 of 4,322 statewide, top 77%, 739 students, 98% FRL); Karen Wagner H S (math 12% / reading 29%, grade F, #1,389 of 1,632 statewide, top 86%, 2,366 students, 80% FRL) — zoned schools average 89% FRL vs 57% district-wide (32 pts higher); higher-poverty schools than district average — tighter screening recommended.
- Market conditions: Rents flat; 187 active listings in the ZIP; 40 comparable units currently listed for rent nearby; rentals at typical pace (median 24d on market — plan ~3-4 weeks tenant-placement turnaround); 48% of comp listings sitting > 30 days — soft ceiling on asking rent; 8,308 units permitted in Bexar County in 2024 (2,506 in 5+ unit buildings).
Forward outlook
- Local home prices are declining (-3.0%/yr); year-one equity from $691 of loan paydown is wiped out by about $3k of value loss. Plan a longer hold.
- Bexar County population projected at +50% by 2050 — long-run rental-demand tailwind backs the buy-and-hold thesis.
- At projected returns (-3.0% appreciation + 0.8% rent growth), your $28k cash investment doubles in ~10 years — after that, you're playing with house money.
Negotiation context
- It's been on market 43 days — a 3% lower offer ($97k) is reasonable based on typical stale-listing flexibility.
- 3 sale attempts; this cycle's ask has dropped $45k (31%) from the opening price — seller is motivated, your offer sets the floor, not the list.
Risks & watch-outs
- Watch-outs: property tax is 3.3% of price.
- Climate carrying-cost: severe wind risk, 80% chance of damaging wind over 30y; extreme-heat days projected 7→22/yr by 2055 (HVAC capex compounding) — expect insurance premiums to compound above CPI over the hold.
Questions for the listing agent
- It's been on market 43 days. Have you received any prior offers? Is the seller open to a 3% concession, seller financing, or rate buy-down credit?
- Property tax is high relative to price — has the assessment been appealed recently, and will the sale trigger a re-assessment?
- Is there a deadline driving the sale (1031 exchange, divorce, estate, relocation)? That informs how much negotiation room exists.
- Crime grade is F in this area — have there been break-ins, vandalism, or insurance claims at this property in the last 3 years? What carrier currently insures it and at what premium?
- What's the average days-on-market for RENTAL listings here right now (not sales)? A rising rental-DOM trend means longer vacancies and softer asking-rent achievability than the comps imply.
- What's the recent tenant-quality profile in this submarket — average credit score on applications, eviction rate, late-payment / NSF rate, and stable-employment percentage? A property-management company in the area should have these aggregated.
- How much new for-sale + rental construction is in the pipeline within 1–3 miles? Heavy new supply typically softens prices + rents 12–24 months out; constrained supply supports both.
Investment metrics
- 1% rule
- 1.53% ✓
- Cap rate
- 10.73%
- Cash-on-cash
- 15.86%
- DSCR
- 1.71
- GRM
- 5.4
CMA / ARV
- ARV (median comp)
- $189,210
- List price
- $100,000
- Delta
- -47.15%
- Verdict
- UNDERPRICED
- Comps
- 20 within 1.0 mi
Show comp detail 12 sales within ~0.75 mi
| Address | Dist | Beds/Ba | Sqft | Sold | Price | $/sf | Match |
|---|---|---|---|---|---|---|---|
| 6339 Aspen Farm | 0.23mi | 3/2.0 | 1,140 (+5%) | 1mo | $105,000 | $92 | 80 |
| 4134 Hunters Sun | 0.26mi | 3/2.0 | 1,131 (+4%) | 2mo | $119,000 | $105 | 79 |
| 4727 Gavlick Farm | 0.15mi | 3/2.0 | 1,189 (+10%) | 2mo | $119,950 | $101 | 76 |
| 4034 Indian Sunrise | 0.46mi | 3/1.0 | 1,091 (+0%) | 1mo | $120,000 | $110 | 73 |
| 4106 Alaskian Sunrise | 0.27mi | 3/1.0 | 1,153 (+6%) | 2mo | $110,000 | $95 | 72 |
| 4119 Sunrise Ter | 0.24mi | 3/1.0 | 989 (-9%) | 2mo | $130,000 | $131 | 68 |
| 4016 Sunrise Crk | 0.44mi | 3/2.0 | 1,008 (-7%) | 5mo | $149,000 | $148 | 64 |
| 4151 Sunrise Crk | 0.18mi | 3/1.0 | 951 (-12%) | 5mo | $84,900 | $89 | 63 |
| 4147 Frontier Sun | 0.45mi | 3/1.0 | 1,155 (+6%) | 4mo | $160,000 | $139 | 62 |
| 4131 Sunrise Pass | 0.57mi | 3/2.0 | 1,176 (+8%) | 3mo | $169,000 | $144 | 58 |
| 4007 Desert Cir | 0.75mi | 3/2.0 | 1,135 (+4%) | 1mo | $179,000 | $158 | 57 |
| 4027 Fire Sun | 0.58mi | 3/2.0 | 1,219 (+12%) | 3mo | $159,900 | $131 | 50 |
Match score weights: distance 35% · size 25% · config 20% · recency 20%. Top-matched comps best support the ARV.
Projected returns pro-forma
-3.0% appreciation · 0.75% rent growth · sell at horizon
- IRR
- 3.9%
- Equity multiple
- 1.15×
- Total profit
- $4,096
- Equity at exit
- $14,910
- IRR
- 10.9%
- Equity multiple
- 1.75×
- Total profit
- $21,093
- Equity at exit
- $8,646
Cash invested: $28,000 (down + closing). Projections, not guarantees.
Landlord ↔ Tenant lean methodology
- Overall (STATE)
- 87 Strongly Landlord-Friendly
- State Texas
- 87 Strongly Landlord-Friendly · R+5
- County
- — inherits STATE
- City
- — inherits STATE
ZIP-level market 78244
- Home prices YoY
- -4.4%
- Rents YoY
- 0.8%
- Active inventory
- 187
- Price-to-rent
- 5.4×
Monthly cashflow live
- Estimated rent
- $1,531 high interval (Pro) →
- Mortgage (P&I)
- −$524
- Tax from tax record
- −$273 /mo · $3,276/yr
- Insurance
- −$42
- HOA
- −$0
- Vacancy / Maint / Mgmt
- −$321
- Net cashflow
- $370
Break-even live
UW: 25.0% down · 7.5% · 30yr · 1.5% tax · 5.0% vac · 8.0% maint · 8.0% mgmt
Financing live
Cash to close
- Down payment
- $25,000
- Closing costs
- $3,000
- Reserves months
- —
- Total cash needed
- —
Loan-product check · same deal, 3 products live
Conventional
25% down · 7.5% · 30yr
- Down + closing
- —
- Monthly P&I
- —
- Monthly cashflow
- —
- DSCR
- —
- Eligible?
- —
Personal DTI + credit; lowest rate.
DSCR
20% down · 8.5% · 30yr
- Down + closing
- —
- Monthly P&I
- —
- Monthly cashflow
- —
- DSCR
- —
- Eligible?
- —
No personal income docs; deal must DSCR.
Hard money
10% down · 12.0% · 12mo
- Down + closing
- —
- Monthly P&I
- —
- Monthly cashflow
- —
- DSCR
- —
- Eligible?
- —
Short-term bridge; refi at stabilization.
Rent comps 40 comps
| Address | Beds | Baths | Sqft | Rent | $/sqft | DOM | Units | Dist |
|---|---|---|---|---|---|---|---|---|
| 5954 Summer Fest Dr San Antonio, TX | 2.0 | 1.0 | 919 | $1,300 | $1.41 | 43d | 1 | 0.10mi |
| 4711 Gavlick Farm San Antonio, TX | 3.0 | 1.0 | 975 | $1,250 | $1.28 | 43d | 1 | 0.13mi |
| 4727 Gavlick Farm San Antonio, TX | 3.0 | 2.0 | 1189 | $1,425 | $1.20 | 43d | 1 | 0.16mi |
| 4807 Georges Farm San Antonio, TX | 3.0 | 2.0 | 1008 | $1,295 | $1.28 | 43d | 1 | 0.20mi |
| 4122 Alaskian Sunrise San Antonio, TX | 3.0 | 2.0 | 1454 | $1,495 | $1.03 | 43d | 1 | 0.23mi |
| 4111 Sunrise Terrace Dr San Antonio, TX | 4.0 | 2.0 | 1220 | $1,800 | $1.48 | 43d | 1 | 0.26mi |
| 4111 Sunrise Terrace Dr San Antonio, TX | 4.0 | 2.0 | 1220 | $1,700 | $1.39 | 2d | 1 | 0.26mi |
| 4411 Mystic Sunrise Dr San Antonio, TX | 3.0 | 2.0 | 1120 | $2,000 | $1.79 | 23d | 1 | 0.26mi |
| 4107 Sunrise Point Dr San Antonio, TX | 2.0 | 1.0 | 822 | $1,095 | $1.33 | 14d | 1 | 0.29mi |
| 4803 Highland Farm San Antonio, TX | 3.0 | 2.0 | 1428 | $880 | $0.62 | 20d | 1 | 0.31mi |
| 5846 Sun Farm San Antonio, TX | 3.0 | 2.0 | 1168 | $1,425 | $1.22 | 23d | 1 | 0.34mi |
| 5916 Mission Sunrise San Antonio, TX | 3.0 | 1.0 | 860 | $1,000 | $1.16 | 23d | 1 | 0.37mi |
| 4162 Frontier Sun San Antonio, TX | 3.0 | 2.5 | 1246 | $1,400 | $1.12 | 43d | 1 | 0.39mi |
| 4047 Indian Sunrise San Antonio, TX | 3.0 | 1.0 | 1089 | $1,150 | $1.06 | 43d | 1 | 0.42mi |
| 4025 Coral Sunrise San Antonio, TX | 4.0 | 1.0 | 825 | $1,495 | $1.81 | 3d | 1 | 0.43mi |
| 4311 Rogans Hbr San Antonio, TX | 3.0 | 2.0 | 1380 | $1,500 | $1.09 | 43d | 1 | 0.44mi |
| 4014 Sunrise Creek Dr San Antonio, TX | 3.0 | 2.0 | 1100 | $1,600 | $1.45 | 43d | 1 | 0.45mi |
| 4123 Frontier Sun San Antonio, TX | 3.0 | 2.0 | 1086 | $1,350 | $1.24 | 43d | 1 | 0.48mi |
| 4001 Colonial Sun Dr San Antonio, TX | 3.0 | 2.0 | 1344 | $1,400 | $1.04 | 43d | 1 | 0.49mi |
| 4078 Enchanted Sun San Antonio, TX | 3.0 | 1.0 | 1056 | $1,250 | $1.18 | 23d | 1 | 0.52mi |
| 6734 Summer Fest Dr Unit 128 San Antonio, TX | 3.0 | 2.5 | 1225 | $1,450 | $1.18 | 43d | 1 | 0.53mi |
| 4102 Dakota Sun San Antonio, TX | 3.0 | 1.0 | 1202 | $1,350 | $1.12 | 43d | 1 | 0.54mi |
| 6734 Summer Fest Dr Unit 148 San Antonio, TX | 3.0 | 2.5 | 1225 | $1,500 | $1.22 | 14d | 1 | 0.54mi |
| 6734 Summer Fest Dr Unit 108 San Antonio, TX | 3.0 | 2.5 | 1225 | $1,450 | $1.18 | 44d | 1 | 0.54mi |
| 6734 Summer Fest Dr Unit 130 San Antonio, TX | 3.0 | 2.5 | 1225 | $1,600 | $1.31 | 23d | 1 | 0.54mi |
| 6734 Summer Fest Dr Unit 150 San Antonio, TX | 3.0 | 2.5 | 1225 | $1,575 | $1.29 | 14d | 1 | 0.54mi |
| 6734 Summer Fest Dr Unit 114 San Antonio, TX | 3.0 | 2.5 | 1225 | $1,400 | $1.14 | 14d | 1 | 0.54mi |
| 5415 N Foster Rd San Antonio, TX | 1.0–2.0 | 1.0–2.0 | 872 | $1,450 | $1.66 | 2d | 24 | 0.55mi |
| 6734 Summer Fest Dr San Antonio, TX | 3.0 | 2.5 | 1225 | $1,550 | $1.27 | 1d | 8 | 0.55mi |
| 4074 Gallery Sun Dr San Antonio, TX | 2.0 | 1.0 | 969 | $1,295 | $1.34 | 43d | 1 | 0.56mi |
| 4082 Sunrise Pass San Antonio, TX | 3.0 | 1.0 | 1125 | $1,355 | $1.20 | 4d | 1 | 0.59mi |
| 3327 Candlemoon Dr San Antonio, TX | 3.0 | 2.0 | 1344 | $1,550 | $1.15 | 43d | 1 | 0.61mi |
| 4066 Sunrise Pass San Antonio, TX | 3.0 | 2.0 | 977 | $1,550 | $1.59 | 4d | 1 | 0.61mi |
| 4002 Fire Sun San Antonio, TX | 3.0 | 2.0 | 1004 | $1,800 | $1.79 | 23d | 1 | 0.61mi |
| 6254 Eddie Way San Antonio, TX | 3.0 | 2.5 | 1225 | $1,375 | $1.12 | 43d | 1 | 0.63mi |
| 3603 Aranda Flds Converse, TX | 3.0 | 2.0 | 1346 | $1,650 | $1.23 | 43d | 1 | 0.64mi |
| 6230 Eddie Way San Antonio, TX | 3.0 | 2.5 | 1225 | $1,350 | $1.10 | 23d | 1 | 0.66mi |
| 5840 Glacier Sun Dr San Antonio, TX | 3.0 | 2.0 | 1344 | $1,749 | $1.30 | 2d | 1 | 0.66mi |
| 6222 Eddie Way Unit 2 San Antonio, TX | 3.0 | 2.5 | 1225 | $1,350 | $1.10 | 3d | 1 | 0.67mi |
| 6222 Eddie Way San Antonio, TX | 3.0 | 2.5 | 1225 | $1,350 | $1.10 | 23d | 1 | 0.67mi |
Listing history 17 events
-
2026-06-17status $100,000 Pending 43 DOM
-
2026-06-17days on market $100,000 Back on Market 43 DOM
-
2026-06-16days on market $100,000 Back on Market 42 DOM
-
2026-06-16pricestatus $100,000 Back on Market 41 DOM
-
2026-06-15days on market $145,000 Active Option 41 DOM
-
2026-06-13days on market $145,000 Active Option 39 DOM
-
2026-06-09days on market $145,000 Active Option 35 DOM
-
2026-06-08statusdays on market $145,000 Active Option 34 DOM
-
2026-06-07days on market $145,000 Active 33 DOM
-
2026-06-04days on market $145,000 Active 30 DOM
-
2026-06-03days on market $145,000 Active 29 DOM
-
2026-06-02days on market $145,000 Active 28 DOM
-
2026-06-01days on market $145,000 Active 27 DOM
-
2026-05-31days on market $145,000 Active 26 DOM
-
2026-05-11status Back on Market 817-char remark
-
2026-05-07historical Active Option 817-char remark
-
2026-05-05$145,000 New 817-char remark
ⓘ Source: listings_history table (triggers on properties + properties_extension) + one-shot
backfill from property_details.listing_events for pre-trigger history.
Tax reassessment forecast TX · Resets to sale price
- Current annual tax
- $3,276 · $273/mo
- Projected year-2 tax
- $3,276 · $273/mo
- Expected delta
- $0/yr ($0/mo · 0.0%)
ⓘ Screening estimate from a state-policy table — verify with the county assessor before closing.
Climate risk First Street
- Flood 1/10 Low FEMA zone X (unshaded) · 0% chance over 30 yrs
- Wildfire 4/10 Moderate
- Heat 8/10 Severe 7 d/yr ≥108°F today · 22 d/yr by 30 yrs out
- Wind 8/10 Severe 80% chance of damaging wind over 30 yrs
- Air quality 2/10 Low 0 unhealthy d/yr today · 1 by 30 yrs out
Nearby sold comps map
Loading sold comps map…
Walkable amenities ~0.75 mi
Loading nearby amenities…
Taxation est. · year 1
- Rental income
- $18,369
- − Mortgage interest
- −$5,602
- − Property taxes
- −$3,276
- − Insurance
- −$500
- − Repairs & maintenance
- −$1,470
- − Management
- −$1,470
- − Depreciation
- −$2,909
- Taxable income
- $3,143
- Est. tax owed @ 24.0%
- −$754
- After-tax cash flow
- $3,688/yr
For passive investors: Depreciation is non-cash, so a rental often shows a tax loss while cash-flowing — sheltering income. Rental losses are passive: they offset passive income freely, and up to $25,000/yr can offset ordinary (W-2) income if you actively participate and your MAGI is under $100k (phasing out to $0 by $150k); unused losses carry forward. On sale, claimed depreciation is recaptured at up to 25%, and gains may owe capital-gains tax (a 1031 exchange can defer both). Figures are a year-1 estimate at your 24.0% rate — not tax advice; consult a CPA.
Schools (NCES district)
- District
- Judson ISD
- NCES district ID
- 4824990
- Math proficiency
- 21% ▼ -21.00%
- Reading proficiency
- 33% ▼ -7.00%
- Median HH income
- $57,542
- Composite
- 24.39/100
- National rank
- #7689
- State rank
- #660 of 826 in TX
Livability — San Antonio
- Score
- 80/100
- State rank
- #31
- US rank
- #1616
Category grades
Schools grade is shown separately in the Schools card above.
Census & demographics
- Census place
- San Antonio, TX
- County
- Bexar County · 1,990,555 people
- City population
- 1,806,925
- Metro
- San Antonio-New Braunfels, TX
- Population (ZIP)
- 38,092
- Household income
- $71,128
- Rent vs Own
- Severe rent burden
- 677.0
Population outlook (Bexar County) Hauer SSP2
- Today (2025)
- 2,336,851 people
- By 2030
- 2,560,728 · +9.6%
- By 2040
- 3,020,569 · +29.3%
- By 2050
- 3,493,522 · +49.5%
- By 2075
- 4,668,459 · +99.8%
- By 2100
- 5,533,242 · +136.8%
Race, ethnicity, and origin ACS 2023
- Neighborhood character
- Diverse neighborhood (Simpson 0.68)
- Race & ethnicity
- Hispanic / Latino 46% Black 27% Two or more races 24% White 20% Asian 2%
- Hispanic origin (detail)
- Mexican 38% Puerto Rican 2% Cuban 2%
- Common ancestry
- Slovak 2% Lithuanian 1% Italian 1%
- Foreign-born
- 14% · Canada, Vietnam
- Languages at home
- 68% English-only · Spanish 28% Vietnamese 1% Tagalog/Filipino 1%
Political lean MEDSL · Bexar
- 2024 margin
- Lean D (+9.8) · D 54.3% · R 44.6% · Other 1.1%
- 2008→2024 swing
- +4.2pp toward D · 2008: 5.6pp · 2024: 9.8pp
- All cycles
- 2024: D+9.8 2020: D+18.2 2016: D+13.5 2012: D+4.6 2008: D+5.6
Not yet ingested
- Civics
- —
Market trends
- HPI YoY
- ▼ -11.42%
- Current HPI
- 249.3834
- Rent YoY
- ▲ 0.75%
- Metro
- San Antonio-New Braunfels, TX
- State GDP YoY
- ▲ 3.95%
- F500 in state
- 110
Industry mix (Fortune 500 HQ in TX)
| Industry | F500 HQs | Revenue |
|---|---|---|
| Energy | 16 | $1,198B |
|
||
| Technology | 5 | $198B |
|
||
| Engineering / Construction | 4 | $72B |
|
||
| Energy Services | 3 | $60B |
|
||
| Utilities | 3 | $41B |
|
||
| Healthcare | 2 | $330B |
|
||
Price history
-31.0% since first listed7 events — show timeline
- 2026-06-17 Pending — LERA
- 2026-06-16 Price Changed $100,000 LERA
- 2026-06-15 Relisted — LERA
- 2026-06-08 Contingent — LERA
- 2026-05-11 Relisted — LERA
- 2026-05-07 Contingent — LERA
- 2026-05-05 Listed $145,000 LERA
Property tax history
+12.0%/yrLatest (2025): $3,276 · +12.2% YoY. Source: county tax records.
Cash-flow waterfall
monthlySold comps — $/sqft
last 12 mo · ≤1 miLoading sold comps…