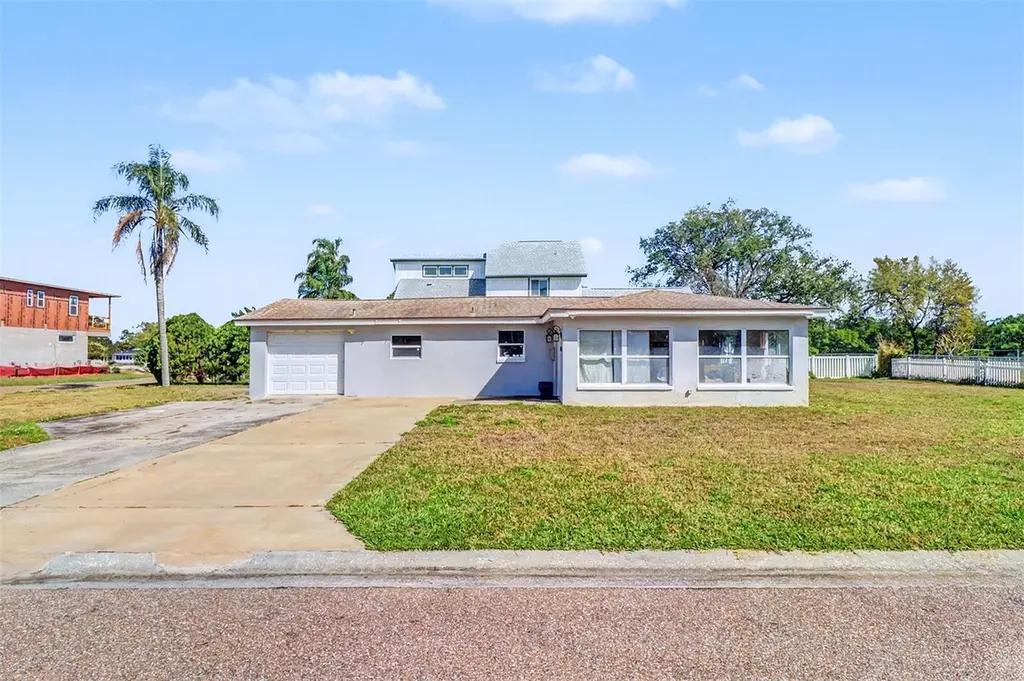
8751 Orient Way NE · St. Petersburg, FL
Flood risk 10/10 · Severe
- FEMA flood zone
- AE
- Chance of flooding over 30 yrs
- 0.99%
- Est. flood insurance / yr
- $1,737 – $8,500
Fire risk 2/10 · Minimal
- Est. fire insurance / yr
- $947 – $1,759
Heat risk 10/10 · Severe
- Hot days now (above 106°F)
- 6 days/yr
- Hot days in 30 yrs
- 21 days/yr
Wind risk 10/10 · Severe
- Chance of severe wind over 30 yrs
- 99.0%
Air-quality risk 3/10 · Minor
- Unhealthy air days now
- 2 days/yr
- Unhealthy air days in 30 yrs
- 3 days/yr
Risk factors via First Street. Map © Google.
Why this score? — see what drove the B grade
The composite is a weighted blend of 9 inputs, each scored 0–100. Each bar is that input's sub-score; the figure is the points it added to the 100-point composite (weight × sub-score).
- Cash flow +30.0/30.0
- ARV discount +15.0/15.0
- DSCR +10.0/10.0
- 1% rule +7.5/10.0
- Schools +4.3/10.0
- Livability +2.5/5.0
- Condition / age +2.5/5.0
- Rent growth +1.9/5.0
- Appreciation +0.0/10.0
$305,900
🖨 Deal sheet (PDF) 📄 Offer letter ✓ Due diligence
Listing remarks
Buyer changed their minds about what they are going to do. Check out this deal!! Unique lot with no through traffic and larger than normal lot for this area!! Just shy of 1/3 acre. This 1562 sq ft 3-2-1 home has so much potential. Complete what was started or build up like others around you. Survey in attachments. This home is almost completed Remodeling was started prior to the hurricanes. A little water came in and the drywall was removed 3 ft up. The electrical and plumbing was done and the kitchen has cabinets on top Hall bath is completed very nicely(mirror does not convey) and there is wood plank looking ceramic tile throughout the living space. Bedrooms except have same plank fl
Key facts
- Walk-in closet
- 0.3 acre lot
- Garage
Tags
Property features AI
Finance
- Other: Lot approx. 0.3 acres (approx. 101 x 121); Property listed as homestead; Universal property ID recorded
- Financial info: Lease restrictions apply
- HOA & community: No HOA association indicated
Exterior
- Parking: Attached garage (1 car)
- Utilities: Public sewer; Water connected; Electricity connected; Cable available; Water source listed as none
- Home design: Single-family residence; One story; Faces south; Fixer condition
- Construction: Block and stucco construction; Shingle roof; Built on a slab foundation; Living area about 1,562 sq ft (per public records); Building area about 1,862 sq ft (per public records)
- Exterior features: Irrigation equipment; Asphalt road access
Interior
- Kitchen: Gas water heater
- Bedrooms: 3 bedrooms
- Flooring: Ceramic tile; Slab foundation (interior level detail)
- Bathrooms: 2 full bathrooms
- Heating & cooling: Central heating (electric); Central air conditioning
- Interior features: Split-bedroom floor plan; Walk-in closets; Water filtration system
- Laundry & utility: Laundry located in the garage
Neighborhood map
What this means for you Summary
Snapshot
- This is a 3-bed/1.0-bath single-family listed at $306k.
Deal economics
- At list price, monthly cash flow is $785 ($9k/yr) — positive.
- The deal already cash-flows at list — no discount required.
- Meets the 1% rule at list price ($4k rent vs $306k).
- Recommended offer: $288k (6.0% below list) — sets the bar for market timing.
- Cap rate 11.0% vs local median 2.6% in St. Petersburg — top-decile yield for the area; either an underpriced asset or a hidden risk that comps aren't pricing in. Stress-test before assuming the spread holds.
Location & tenants
- Location reads: area grade B — affects rentability + tenant quality, not the cash-flow math above.
- Pinellas (suburban): math 51% / reading 51% proficiency, ranked #31 of 73 in FL (top 42%) — acceptable for families but not a draw, mixed tenant base, ~2y average lease.
- Zoned schools: Shore Acres Elementary School (math 61% / reading 52%, grade C+, #816 of 2,144 statewide, top 39%, 709 students, 46% FRL); Northeast High School (math 35% / reading 47%, grade F, #289 of 667 statewide, top 44%, 1,736 students, 50% FRL) — zoned schools at 48% FRL track the district average.
- Market conditions: Rents soft (-2.2%/yr); 385 active listings in the ZIP; 22 comparable units currently listed for rent nearby; rentals leasing fast (median 5d on market — plan ~1-2 weeks tenant-placement turnaround); 2,676 units permitted in Pinellas County in 2024 (1,422 in 5+ unit buildings).
- At $3,829/mo this rent would consume 68% of the median local household income ($67k/yr) (locally 1000% of renters already pay >50% of income on rent) — very limited rent-growth headroom before tenants either downsize or default.
Forward outlook
- Local home prices are declining (-3.0%/yr); year-one equity from $2k of loan paydown is wiped out by about $9k of value loss. Plan a longer hold.
- Pinellas County population projected at +14% by 2050 — modest demand growth; plan on rents tracking national, not racing it.
Negotiation context
- It's been on market 66 days — a 6% lower offer ($288k) is reasonable based on typical stale-listing flexibility.
- 2 sale attempts; this cycle's ask has dropped $94k (24%) from the opening price — seller is motivated, your offer sets the floor, not the list.
- Current owner paid $80k; list at $306k implies a 285% gain — meaningful room to come down on a strong offer.
Risks & watch-outs
- Watch-outs: flood insurance adds $427/mo; built in 1959 — expect roof / HVAC / electrical / plumbing capex.
- Climate carrying-cost: in FEMA flood zone AE (mandatory federal flood insurance); severe wind risk, 99% chance of damaging wind over 30y; extreme-heat days projected 6→21/yr by 2055 (HVAC capex compounding) — expect insurance premiums to compound above CPI over the hold.
Questions for the listing agent
- It's been on market 66 days. Have you received any prior offers? Is the seller open to a 6% concession, seller financing, or rate buy-down credit?
- Built in 1959 — when were the roof, HVAC, electrical panel, plumbing, and water heater last replaced?
- What's the actual annual flood-insurance premium (NFIP or private), and is the property in a SFHA with mandatory coverage?
- Why hasn't it sold? Are there any deal-killer items the seller is aware of (foundation, flood, title, zoning, code violations)?
- Is there a deadline driving the sale (1031 exchange, divorce, estate, relocation)? That informs how much negotiation room exists.
- What's the average days-on-market for RENTAL listings here right now (not sales)? A rising rental-DOM trend means longer vacancies and softer asking-rent achievability than the comps imply.
- What's the recent tenant-quality profile in this submarket — average credit score on applications, eviction rate, late-payment / NSF rate, and stable-employment percentage? A property-management company in the area should have these aggregated.
- How much new for-sale + rental construction is in the pipeline within 1–3 miles? Heavy new supply typically softens prices + rents 12–24 months out; constrained supply supports both.
Investment metrics
- 1% rule
- 1.25% ✓
- Cap rate
- 11.05%
- Cash-on-cash
- 16.98%
- DSCR
- 1.76
- GRM
- 6.7
CMA / ARV
- ARV (on-the-fly)
- $482,658
- Comps found
- 12
Show comp detail 12 sales within ~0.75 mi
| Address | Dist | Beds/Ba | Sqft | Sold | Price | $/sf | Match |
|---|---|---|---|---|---|---|---|
| 336 87th Ave NE | 0.11mi | 3/2.0 | 1,658 (+6%) | 4mo | $550,000 | $332 | 78 |
| 110 92nd Ave NE | 0.37mi | 3/2.0 | 1,559 (-0%) | 1mo | $445,000 | $285 | 78 |
| 9294 Treasure Ln NE | 0.34mi | 3/2.0 | 1,662 (+6%) | 1mo | $785,000 | $472 | 68 |
| 9045 3rd St N | 0.46mi | 4/2.0 (+1) | 1,545 (-1%) | 1mo | $275,000 | $178 | 67 |
| 9107 Bay St NE | 0.33mi | 3/2.0 | 1,680 (+8%) | 3mo | $430,000 | $256 | 66 |
| 223 94th Ave NE | 0.45mi | 4/2.0 (+1) | 1,478 (-5%) | 4mo | $370,000 | $250 | 58 |
| 7922 2nd Way N | 0.63mi | 3/2.0 | 1,630 (+4%) | 2mo | $503,000 | $309 | 58 |
| 1044 Romano Ct NE | 0.71mi | 3/2.0 | 1,501 (-4%) | 0mo | $472,500 | $315 | 56 |
| 279 79th Ave N | 0.66mi | 3/2.0 | 1,479 (-5%) | 3mo | $430,000 | $291 | 54 |
| 248 79th Ave NE | 0.60mi | 3/2.0 | 1,430 (-8%) | 4mo | $482,125 | $337 | 51 |
| 131 80th Ave NE | 0.48mi | 3/3.0 | 1,344 (-14%) | 4mo | $180,000 | $134 | 43 |
| 9665 2nd St N | 0.65mi | 3/2.0 | 1,345 (-14%) | 1mo | $462,000 | $343 | 42 |
Match score weights: distance 35% · size 25% · config 20% · recency 20%. Top-matched comps best support the ARV.
Projected returns pro-forma
-3.0% appreciation · 0.0% rent growth · sell at horizon
- IRR
- -3.4%
- Equity multiple
- 0.88×
- Total profit
- $-10,629
- Equity at exit
- $45,611
- IRR
- 2.3%
- Equity multiple
- 1.14×
- Total profit
- $12,347
- Equity at exit
- $26,449
Cash invested: $85,652 (down + closing). Projections, not guarantees.
Landlord ↔ Tenant lean methodology
- Overall (STATE)
- 87 Strongly Landlord-Friendly
- State Florida
- 87 Strongly Landlord-Friendly · R+3
- County
- — inherits STATE
- City
- — inherits STATE
ZIP-level market 33702
- Rents YoY
- -2.2%
- Active inventory
- 385
- Price-to-rent
- 6.7×
Monthly cashflow live
- Estimated rent
- $3,829 high interval (Pro) →
- Mortgage (P&I)
- −$1,604
- Tax from tax record
- −$81 /mo · $971/yr
- Insurance
- −$127
- Flood insurance flood zone
- −$427 /mo · $5,118/yr
- HOA
- −$0
- Vacancy / Maint / Mgmt
- −$804
- Net cashflow
- $785
Break-even live
Sensitivity live
| Price | -10% $959 | -5% $872 | +0% $785 | +5% $699 | +10% $612 |
|---|---|---|---|---|---|
| Rent | -10% $483 | -5% $634 | +0% $785 | +5% $937 | +10% $1,088 |
| Rate | -1.0pp $939 | -0.5pp $863 | base $785 | +0.5pp $706 | +1.0pp $626 |
UW: 25.0% down · 7.5% · 30yr · 1.5% tax · 5.0% vac · 8.0% maint · 8.0% mgmt
Financing live
Cash to close
- Down payment
- $76,475
- Closing costs
- $9,177
- Reserves months
- —
- Total cash needed
- —
Loan-product check · same deal, 3 products live
Conventional
25% down · 7.5% · 30yr
- Down + closing
- —
- Monthly P&I
- —
- Monthly cashflow
- —
- DSCR
- —
- Eligible?
- —
Personal DTI + credit; lowest rate.
DSCR
20% down · 8.5% · 30yr
- Down + closing
- —
- Monthly P&I
- —
- Monthly cashflow
- —
- DSCR
- —
- Eligible?
- —
No personal income docs; deal must DSCR.
Hard money
10% down · 12.0% · 12mo
- Down + closing
- —
- Monthly P&I
- —
- Monthly cashflow
- —
- DSCR
- —
- Eligible?
- —
Short-term bridge; refi at stabilization.
Rent comps 22 comps
| Address | Beds | Baths | Sqft | Rent | $/sqft | DOM | Units | Dist |
|---|---|---|---|---|---|---|---|---|
| 292 Sunlit Cove Dr NE St Petersburg, FL | 3.0 | 2.0 | 2058 | $7,000 | $3.40 | 25d | 1 | 0.13mi |
| 239 93rd Ave N Saint Petersburg, FL | 4.0 | 2.0 | 1111 | $2,905 | $2.61 | 25d | 1 | 0.52mi |
| 8627 5th St N Saint Petersburg, FL | 3.0 | 3.0 | 1976 | $4,750 | $2.40 | 25d | 1 | 0.55mi |
| 1070 Sanabel Ct NE Saint Petersburg, FL | 3.0 | 3.0 | 1804 | $4,500 | $2.49 | 25d | 1 | 0.84mi |
| 861 88th Ave N Saint Petersburg, FL | 3.0 | 2.0 | 1301 | $2,550 | $1.96 | 5d | 1 | 0.93mi |
| 592 100th Ave N #202 Saint Petersburg, FL | 2.0 | 2.5 | 1260 | $2,000 | $1.59 | 5d | 1 | 1.00mi |
| 9940 7th Way N #101 Saint Petersburg, FL | 2.0 | 2.0 | 1090 | $2,000 | $1.83 | 4d | 1 | 1.03mi |
| 720 100th Ave N #203 Saint Petersburg, FL | 3.0 | 2.0 | 1440 | $1,800 | $1.25 | 5d | 1 | 1.05mi |
| 10491 Gandy Blvd N Saint Petersburg, FL | 1.0–2.0 | 1.0–2.0 | 966 | $2,575 | $2.67 | 2d | 10 | 1.07mi |
| 10501 3rd St N Saint Petersburg, FL | 1.0–3.0 | 1.0–2.0 | 970 | $2,095 | $2.16 | 4d | 29 | 1.14mi |
| 10217 Dolce Vista Dr NE St Petersburg, FL | 4.0 | 2.5 | 1866 | $3,300 | $1.77 | 25d | 1 | 1.15mi |
| 10475 Gandy Blvd N Saint Petersburg, FL | 3.0 | 1.0–2.0 | 996 | $2,900 | $2.91 | 3d | 4 | 1.16mi |
| 10350 2nd Way N St. Petersburg, FL | 3.0 | 2.5 | 1814 | $4,200 | $2.32 | 25d | 1 | 1.19mi |
| 10601 Gandy Blvd N St Petersburg, FL | 1.0–3.0 | 1.0–2.0 | 1028 | $3,173 | $3.09 | 4d | 27 | 1.24mi |
| 871 Ibis Walk Pl N Saint Petersburg, FL | 1.0–3.0 | 1.0–2.0 | 1075 | $2,955 | $2.75 | 3d | 62 | 1.28mi |
| 873 Ibis Walk Pl N Unit 3 St. Petersburg, FL | 2.0 | 2.0 | 1146 | $2,159 | $1.88 | 25d | 1 | 1.33mi |
| 10600 4th St N Saint Petersburg, FL | 1.0–3.0 | 1.0–2.0 | 838 | $2,189 | $2.61 | 2d | 14 | 1.34mi |
| 7325 10th St N Saint Petersburg, FL | 3.0 | 2.0 | 1762 | $3,300 | $1.87 | 25d | 1 | 1.35mi |
| 7325 10th St N Saint Petersburg, FL | 3.0 | 2.0 | 1762 | $3,300 | $1.87 | 23d | 1 | 1.35mi |
| 10901 Brighton Bay Blvd NE Saint Petersburg, FL | 1.0–3.0 | 1.0–2.0 | 979 | $2,439 | $2.49 | 2d | 17 | 1.43mi |
| 190 112th Ave N Saint Petersburg, FL | 1.0–2.0 | 1.0–2.0 | 847 | $2,375 | $2.80 | 3d | 43 | 1.46mi |
| 547 Black Lion Dr NE Saint Petersburg, FL | 3.0 | 2.5 | 1680 | $3,000 | $1.79 | 25d | 1 | 1.48mi |
Listing history 15 events
-
2026-06-18days on market $305,900 Active 66 DOM
-
2026-06-17days on market $305,900 Active 65 DOM
-
2026-06-16days on market $305,900 Active 64 DOM
-
2026-06-15days on market $305,900 Active 63 DOM
-
2026-06-13days on market $305,900 Active 61 DOM
-
2026-06-09days on market $305,900 Active 57 DOM
-
2026-06-08pricestatus $305,900 Active 56 DOM
-
2026-05-19price $339,500
-
2026-05-19price $3,395,000
-
2026-05-19status Active
-
2026-05-15status Pending
-
2026-04-17price $354,900
-
2026-04-03price $374,900
-
2026-03-24$399,900 Active
-
1998-03-20soldstatus $79,500
ⓘ Source: listings_history table (triggers on properties + properties_extension) + one-shot
backfill from property_details.listing_events for pre-trigger history.
Tax reassessment forecast FL · Resets to sale price
- Current annual tax
- $971 · $81/mo
- Projected year-2 tax
- $2,539 · $212/mo
- Expected delta
- +$1,568/yr (+$131/mo · 161.4%)
ⓘ Screening estimate from a state-policy table — verify with the county assessor before closing.
Climate risk First Street
- Flood 10/10 Extreme FEMA zone AE · 99% chance over 30 yrs
- Wildfire 2/10 Low
- Heat 10/10 Extreme 6 d/yr ≥106°F today · 21 d/yr by 30 yrs out
- Wind 10/10 Extreme 99% chance of damaging wind over 30 yrs
- Air quality 3/10 Moderate 2 unhealthy d/yr today · 3 by 30 yrs out
Nearby sold comps map
Loading sold comps map…
Walkable amenities ~0.75 mi
Loading nearby amenities…
Taxation est. · year 1
- Rental income
- $45,943
- − Mortgage interest
- −$17,135
- − Property taxes
- −$971
- − Insurance
- −$6,648
- − Repairs & maintenance
- −$3,675
- − Management
- −$3,675
- − Depreciation
- −$8,899
- Taxable income
- $4,939
- Est. tax owed @ 24.0%
- −$1,185
- After-tax cash flow
- $8,240/yr
For passive investors: Depreciation is non-cash, so a rental often shows a tax loss while cash-flowing — sheltering income. Rental losses are passive: they offset passive income freely, and up to $25,000/yr can offset ordinary (W-2) income if you actively participate and your MAGI is under $100k (phasing out to $0 by $150k); unused losses carry forward. On sale, claimed depreciation is recaptured at up to 25%, and gains may owe capital-gains tax (a 1031 exchange can defer both). Figures are a year-1 estimate at your 24.0% rate — not tax advice; consult a CPA.
Schools (NCES district)
- District
- Pinellas
- NCES district ID
- 1201560
- Math proficiency
- 51% ▼ -5.00%
- Reading proficiency
- 51% ▼ -3.00%
- Median HH income
- $46,270
- Composite
- 43.27/100
- National rank
- #3046
- State rank
- #31 of 73 in FL
Livability — St. Petersburg
No livability data for this city. (Only ~50 U.S. cities are tracked.)
Census & demographics
- Census place
- St. Petersburg, FL
- County
- Pinellas County · 939,478 people
- City population
- 249,151
- Metro
- Tampa-St. Petersburg-Clearwater, FL
- Population (ZIP)
- 31,294
- Household income
- $67,463
- Rent vs Own
- Severe rent burden
- 1000.0
Population outlook (Pinellas County) Hauer SSP2
- Today (2025)
- 1,027,532 people
- By 2030
- 1,063,586 · +3.5%
- By 2040
- 1,125,020 · +9.5%
- By 2050
- 1,168,637 · +13.7%
- By 2075
- 1,265,188 · +23.1%
- By 2100
- 1,260,357 · +22.7%
Race, ethnicity, and origin ACS 2023
- Neighborhood character
- Predominantly White (73%)
- Race & ethnicity
- White 73% Hispanic / Latino 12% Two or more races 10% Black 6% Asian 4%
- Hispanic origin (detail)
- Mexican 2% Puerto Rican 3% Cuban 2%
- Common ancestry
- Lithuanian 4% Romanian 3% Slovak 2%
- Foreign-born
- 12% · Canada, Vietnam, Jamaica
- Languages at home
- 83% English-only · Spanish 8% Russian/Polish/Slavic 3% Other Indo-European 1%
Political lean MEDSL · Pinellas
- 2024 margin
- Lean R (+5.2) · D 46.9% · R 52.1%
- 2008→2024 swing
- -13.5pp toward R · 2008: 8.3pp · 2024: -5.2pp
- All cycles
- 2024: R+5.2 2020: D+0.2 2016: R+1.1 2012: D+5.6 2008: D+8.3
Not yet ingested
- Civics
- —
Market trends
- HPI YoY
- ▼ -516.17%
- Current HPI
- 347.1781
- Rent YoY
- ▼ -2.22%
- Metro
- Tampa-St. Petersburg-Clearwater, FL
- State GDP YoY
- ▲ 3.28%
- F500 in state
- 36
Industry mix (Fortune 500 HQ in FL)
| Industry | F500 HQs | Revenue |
|---|---|---|
| Industrial Technology | 2 | $29B |
|
||
| Insurance | 2 | $17B |
|
||
| Retail | 1 | $60B |
|
||
| Technology Distribution | 1 | $58B |
|
||
| Homebuilding | 1 | $35B |
|
||
| Technology Manufacturing | 1 | $35B |
|
||
Price history
+327.0% since first listed8 events — show timeline
- 2026-05-19 Price Changed $339,500 Stellar MLS as Distributed by MLS Grid
- 2026-05-19 Price Changed $3,395,000 Stellar MLS as Distributed by MLS Grid
- 2026-05-19 Relisted — Stellar MLS as Distributed by MLS Grid
- 2026-05-15 Pending — Stellar MLS as Distributed by MLS Grid
- 2026-04-17 Price Changed $354,900 Stellar MLS as Distributed by MLS Grid
- 2026-04-03 Price Changed $374,900 Stellar MLS as Distributed by MLS Grid
- 2026-03-24 Listed $399,900 Stellar MLS as Distributed by MLS Grid
- 1998-03-20 Sold (Public Records) $79,500 Public Records
Property tax history
-6.9%/yrLatest (2025): $971 · -37.7% YoY. Source: county tax records.
Cash-flow waterfall
monthlySold comps — $/sqft
last 12 mo · ≤1 miLoading sold comps…