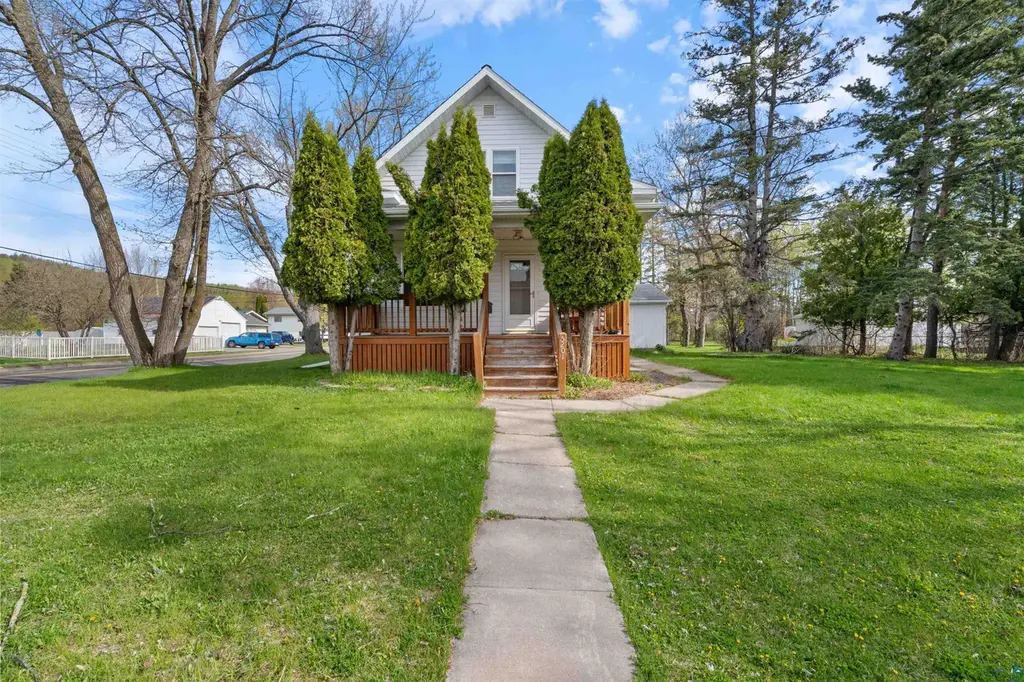
5201 Ivanhoe St · Duluth, MN
Flood risk 1/10 · Minimal
- FEMA flood zone
- X
- Chance of flooding over 30 yrs
- 0.0%
- Est. flood insurance / yr
- $473 – $860
Fire risk 3/10 · Minor
- Est. fire insurance / yr
- $888 – $1,650
Heat risk 1/10 · Minimal
- Hot days now (above 90°F)
- 7 days/yr
- Hot days in 30 yrs
- 14 days/yr
Wind risk 1/10 · Minimal
- Chance of severe wind over 30 yrs
- —
Air-quality risk 2/10 · Minimal
- Unhealthy air days now
- 0 days/yr
- Unhealthy air days in 30 yrs
- 1 days/yr
Risk factors via First Street. Map © Google.
Why this score? — see what drove the D+ grade
The composite is a weighted blend of 9 inputs, each scored 0–100. Each bar is that input's sub-score; the figure is the points it added to the 100-point composite (weight × sub-score).
- Cash flow +14.2/30.0
- ARV discount +14.2/15.0
- DSCR +4.3/10.0
- Schools +4.2/10.0
- Livability +4.1/5.0
- 1% rule +3.8/10.0
- Rent growth +2.5/5.0
- Condition / age +2.5/5.0
- Appreciation +0.0/10.0
$250,000
🖨 Deal sheet (PDF) 📄 Offer letter ✓ Due diligence
Listing remarks
Set on a spacious corner lot, this home offers standout curb appeal with mature trees, a well-kept yard, and effortless access to parks, schools, and everyday amenities. Inside, the bright and inviting main level features a generous living room where large windows flood the space with natural light, creating a warm and welcoming atmosphere. Step outside to a private backyard designed for relaxation and play — perfect for gardening, outdoor dining, or quiet evenings at home. A detached garage and additional off-street parking add convenience and functionality. Located just minutes from Lester Park trails, Brighton Beach, and the heart of Duluth’s Lakeside neighborhood, this prope
Key facts
- Well-kept yard
- Private backyard
- Off-street parking
Tags
Property features AI
Exterior
- Parking: Detached 2-car garage
- Utilities: Public water; Public sewer
- Home design: Single-family detached residence; 2 stories
- Exterior features: 100 x 140 lot (0.32 acres)
Interior
- Bathrooms: 1 full bathroom
- Heating & cooling: Forced-air heating; Natural gas heating
- Interior features: Wood-burning fireplace; Full basement
Neighborhood map
What this means for you Summary
Snapshot
- This is a 3-bed/1.0-bath single-family listed at $250k.
Deal economics
- At list price, monthly cash flow is $39 ($472/yr) — positive.
- The deal already cash-flows at list — no discount required.
- To meet the 1% rule (rent ≥ 1% of price), the offer needs to be $221k (11.6% below list).
- Recommended offer: $221k (11.6% below list) — sets the bar for 1% rule.
- Cap rate 6.5% vs local median 4.9% in Duluth — top-decile yield for the area; either an underpriced asset or a hidden risk that comps aren't pricing in. Stress-test before assuming the spread holds.
Location & tenants
- Location reads 82/100 on livability (#36 in MN, #1,060 nationally) — a professional / high-income tenant draw. Strengths: commute A+, cost of living A+, housing A+; Watch: amenities F.
- Duluth Public School District (urban): math 44% / reading 55% proficiency, ranked #132 of 301 in MN (top 44%) — families likely to look elsewhere, expect single-tenant / working-renter base with shorter leases.
- Zoned schools: Lester Park Elementary (math 73% / reading 77%, grade A, #31 of 857 statewide, top 4%, 575 students, 20% FRL); Ordean East Middle School (math 45% / reading 61%, grade C+, #53 of 258 statewide, top 22%, 989 students, 26% FRL); East High School (math 42% / reading 73%, grade C, #59 of 471 statewide, top 13%, 1,494 students, 23% FRL) — zoned schools average 23% FRL vs 39% district-wide (16 pts lower); this property's tenant base skews higher-income than the district average.
- Zoned-school proficiency averages 62% at this address vs 50% district-wide (+12 pts) — the actual schools serving this property are materially stronger than the Duluth Public School District average implies; a family-tenant draw the district grade alone would hide.
- Market conditions: 100 active listings in the ZIP; 2 comparable units currently listed for rent nearby; 639 units permitted in St. Louis County in 2024 (338 in 5+ unit buildings).
Forward outlook
- Local home prices are declining (-3.0%/yr); year-one equity from $2k of loan paydown is wiped out by about $8k of value loss. Plan a longer hold.
Negotiation context
- Only 6 days on market — expect competitive offers; lowballing is unlikely to land.
Risks & watch-outs
- Watch-outs: built in 1912 — expect roof / HVAC / electrical / plumbing capex.
Questions for the listing agent
- Built in 1912 — when were the roof, HVAC, electrical panel, plumbing, and water heater last replaced?
- Is there a deadline driving the sale (1031 exchange, divorce, estate, relocation)? That informs how much negotiation room exists.
- Schools are B-rated — typically a magnet for longer-tenancy family renters. What's the average tenant stay here, and is there a school-zone premium baked into asking?
- The area grade is low — what's the realistic commute time and amenity access for the typical tenant pool here? Any planned neighborhood developments (good or bad) we should know about?
- What's the average days-on-market for RENTAL listings here right now (not sales)? A rising rental-DOM trend means longer vacancies and softer asking-rent achievability than the comps imply.
- What's the recent tenant-quality profile in this submarket — average credit score on applications, eviction rate, late-payment / NSF rate, and stable-employment percentage? A property-management company in the area should have these aggregated.
- How much new for-sale + rental construction is in the pipeline within 1–3 miles? Heavy new supply typically softens prices + rents 12–24 months out; constrained supply supports both.
Investment metrics
- 1% rule
- 0.88% ✗
- Cap rate
- 6.48%
- Cash-on-cash
- 0.67%
- DSCR
- 1.03
- GRM
- 9.4
CMA / ARV
- ARV (on-the-fly)
- $294,000
- Comps found
- 12
Show comp detail 12 sales within ~0.75 mi
| Address | Dist | Beds/Ba | Sqft | Sold | Price | $/sf | Match |
|---|---|---|---|---|---|---|---|
| 5211 Avondale St | 0.28mi | 3/1.5 | 1,068 (-9%) | 4mo | $175,000 | $164 | 67 |
| 5323 Wyoming St | 0.37mi | 3/1.0 | 1,232 (+5%) | 12mo | $295,000 | $239 | 65 |
| 5402 Juniata St | 0.48mi | 2/1.0 (-1) | 1,108 (-6%) | 8mo | $277,000 | $250 | 56 |
| 4919 Oakley St | 0.31mi | 2/2.0 (-1) | 1,296 (+10%) | 4mo | $165,000 | $127 | 56 |
| 4722 Oneida St | 0.70mi | 3/1.5 | 1,091 (-7%) | 2mo | $286,000 | $262 | 52 |
| 4831 Oneida St | 0.62mi | 3/2.0 | 1,118 (-5%) | 8mo | $296,900 | $266 | 52 |
| 828 N 54th Ave Ave E | 0.25mi | 2/1.5 (-1) | 1,081 (-8%) | 22mo | $305,000 | $282 | 50 |
| 5331 Glenwood St | 0.51mi | 3/1.5 | 1,284 (+9%) | 16mo | $225,000 | $175 | 45 |
| 5840 Tioga St | 0.74mi | 3/1.0 | 1,085 (-8%) | 9mo | $290,000 | $267 | 45 |
| 5122 Glenwood St | 0.52mi | 2/1.5 (-1) | 999 (-15%) | 1mo | $290,000 | $290 | 43 |
| 4930 Oneida St | 0.62mi | 3/1.5 | 1,030 (-12%) | 19mo | $165,000 | $160 | 33 |
| 4621 Oneida St | 0.74mi | 2/1.0 (-1) | 1,021 (-13%) | 9mo | $250,000 | $245 | 31 |
Match score weights: distance 35% · size 25% · config 20% · recency 20%. Top-matched comps best support the ARV.
Projected returns pro-forma
-3.0% appreciation · 3.0% rent growth · sell at horizon
- IRR
- -15.2%
- Equity multiple
- 0.46×
- Total profit
- $-37,986
- Equity at exit
- $37,276
- IRR
- -6.6%
- Equity multiple
- 0.57×
- Total profit
- $-29,770
- Equity at exit
- $21,615
Cash invested: $70,000 (down + closing). Projections, not guarantees.
Landlord ↔ Tenant lean methodology
- Overall (STATE)
- 46 Balanced
- State Minnesota
- 46 Balanced · D+2
- County
- — inherits STATE
- City
- — inherits STATE
ZIP-level market 55804
- Active inventory
- 100
- Price-to-rent
- 9.4×
Monthly cashflow live
- Estimated rent
- $2,210 medium interval (Pro) →
- Mortgage (P&I)
- −$1,311
- Tax from tax record
- −$292 /mo · $3,500/yr
- Insurance
- −$104
- HOA
- −$0
- Vacancy / Maint / Mgmt
- −$464
- Net cashflow
- $39
Break-even live
Sensitivity live
| Price | -10% $181 | -5% $110 | +0% $39 | +5% $-31 | +10% $-102 |
|---|---|---|---|---|---|
| Rent | -10% $-135 | -5% $-48 | +0% $39 | +5% $127 | +10% $214 |
| Rate | -1.0pp $165 | -0.5pp $103 | base $39 | +0.5pp $-25 | +1.0pp $-91 |
UW: 25.0% down · 7.5% · 30yr · 1.5% tax · 5.0% vac · 8.0% maint · 8.0% mgmt
Financing live
Cash to close
- Down payment
- $62,500
- Closing costs
- $7,500
- Reserves months
- —
- Total cash needed
- —
Loan-product check · same deal, 3 products live
Conventional
25% down · 7.5% · 30yr
- Down + closing
- —
- Monthly P&I
- —
- Monthly cashflow
- —
- DSCR
- —
- Eligible?
- —
Personal DTI + credit; lowest rate.
DSCR
20% down · 8.5% · 30yr
- Down + closing
- —
- Monthly P&I
- —
- Monthly cashflow
- —
- DSCR
- —
- Eligible?
- —
No personal income docs; deal must DSCR.
Hard money
10% down · 12.0% · 12mo
- Down + closing
- —
- Monthly P&I
- —
- Monthly cashflow
- —
- DSCR
- —
- Eligible?
- —
Short-term bridge; refi at stabilization.
Rent comps 2 comps
| Address | Beds | Baths | Sqft | Rent | $/sqft | DOM | Units | Dist |
|---|---|---|---|---|---|---|---|---|
| 5231 Wyoming St Duluth, MN | 3.0 | 1.0 | 1500 | $2,250 | $1.50 | 23d | 1 | 0.38mi |
| 5090 London Rd Unit 1 Duluth, MN | 2.0 | 2.0 | 959 | $2,100 | $2.19 | 15d | 1 | 1.11mi |
Listing history 6 events
-
2026-06-03status $250,000 Pending 6 DOM
-
2026-06-02days on market $250,000 Active 6 DOM
-
2026-06-01days on market $250,000 Active 5 DOM
-
2026-05-31days on market $250,000 Active 4 DOM
-
2026-05-30days on market $250,000 Active 3 DOM
-
2026-05-27$250,000 Active
ⓘ Source: listings_history table (triggers on properties + properties_extension) + one-shot
backfill from property_details.listing_events for pre-trigger history.
Tax reassessment forecast MN · Partial reset (capped growth)
- Current annual tax
- $3,500 · $292/mo
- Projected year-2 tax
- $3,500 · $292/mo
- Expected delta
- $0/yr ($0/mo · 0.0%)
ⓘ Screening estimate from a state-policy table — verify with the county assessor before closing.
Climate risk First Street
- Flood 1/10 Low FEMA zone X · 0% chance over 30 yrs
- Wildfire 3/10 Moderate
- Heat 1/10 Low 7 d/yr ≥90°F today · 14 d/yr by 30 yrs out
- Wind 1/10 Low
- Air quality 2/10 Low 0 unhealthy d/yr today · 1 by 30 yrs out
Nearby sold comps map
Loading sold comps map…
Walkable amenities ~0.75 mi
Loading nearby amenities…
Taxation est. · year 1
- Rental income
- $26,524
- − Mortgage interest
- −$14,004
- − Property taxes
- −$3,500
- − Insurance
- −$1,250
- − Repairs & maintenance
- −$2,122
- − Management
- −$2,122
- − Depreciation
- −$7,273
- Taxable loss
- −$3,746
- Est. tax savings @ 24.0%
- +$899
- After-tax cash flow
- $1,371/yr
For passive investors: Depreciation is non-cash, so a rental often shows a tax loss while cash-flowing — sheltering income. Rental losses are passive: they offset passive income freely, and up to $25,000/yr can offset ordinary (W-2) income if you actively participate and your MAGI is under $100k (phasing out to $0 by $150k); unused losses carry forward. On sale, claimed depreciation is recaptured at up to 25%, and gains may owe capital-gains tax (a 1031 exchange can defer both). Figures are a year-1 estimate at your 24.0% rate — not tax advice; consult a CPA.
Schools (NCES district)
- District
- Duluth Public School District
- NCES district ID
- 2711040
- Math proficiency
- 44% ▼ -10.00%
- Reading proficiency
- 55% ▼ -6.00%
- Median HH income
- $45,692
- Composite
- 41.92/100
- National rank
- #3360
- State rank
- #132 of 301 in MN
Livability — Duluth
- Score
- 82/100
- State rank
- #36
- US rank
- #1060
Category grades
Schools grade is shown separately in the Schools card above.
Census & demographics
- Census place
- Duluth, MN
- City population
- 71,097
- Population (ZIP)
- 16,018
Population outlook (St. Louis County) Hauer SSP2
- Today (2025)
- 202,411 people
- By 2030
- 203,234 · +0.4%
- By 2040
- 202,520 · +0.1%
- By 2050
- 200,853 · -0.8%
- By 2075
- 200,943 · -0.7%
- By 2100
- 192,058 · -5.1%
Race, ethnicity, and origin ACS 2023
- Neighborhood character
- Predominantly White (92%)
- Race & ethnicity
- White 92% Two or more races 5% Hispanic / Latino 1% Asian 1%
- Common ancestry
- Portuguese 14% Scottish 4% Romanian 4%
- Foreign-born
- 3% · Canada
- Languages at home
- 96% English-only · Spanish 1%
Political lean MEDSL · St. Louis
- 2024 margin
- D (+13.7) · D 55.9% · R 42.2% · Other 1.8%
- 2008→2024 swing
- -18.8pp toward R · 2008: 32.5pp · 2024: 13.7pp
- All cycles
- 2024: D+13.7 2020: D+15.6 2016: D+11.8 2012: D+29.6 2008: D+32.5
Not yet ingested
- Civics
- —
Market trends
- HPI YoY
- ▼ -253.94%
- Current HPI
- 199.4064
- Rent YoY
- —
- Metro
- —
- State GDP YoY
- ▲ 2.41%
- F500 in state
- 34
Industry mix (Fortune 500 HQ in MN)
| Industry | F500 HQs | Revenue |
|---|---|---|
| Healthcare | 2 | $407B |
|
||
| Retail | 2 | $150B |
|
||
| Consumer Goods | 2 | $32B |
|
||
| Industrial Machinery | 2 | $6B |
|
||
| Agriculture | 1 | $40B |
|
||
| Healthcare / Medical Devices | 1 | $32B |
|
||
Price history
1 event — show timeline
- 2026-05-27 Listed $250,000 LSAR
Property tax history
+4.4%/yrLatest (2025): $3,500 · +9.3% YoY. Source: county tax records.
Cash-flow waterfall
monthlySold comps — $/sqft
last 12 mo · ≤1 miLoading sold comps…