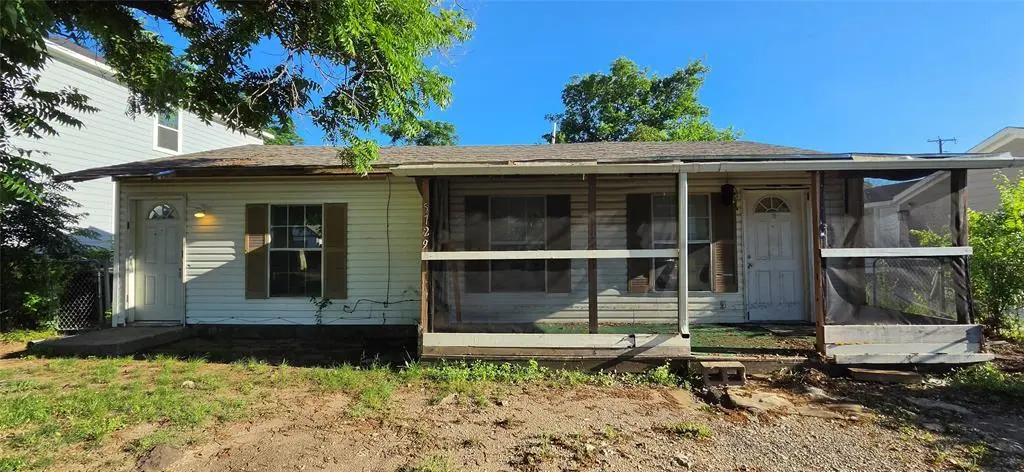
5729 Wellesley Ave · Fort Worth, TX
Flood risk 6/10 · Moderate
- FEMA flood zone
- X (unshaded)
- Chance of flooding over 30 yrs
- 0.74%
- Est. flood insurance / yr
- $507 – $1,088
Fire risk 1/10 · Minimal
- Est. fire insurance / yr
- $1,222 – $2,270
Heat risk 7/10 · Major
- Hot days now (above 108°F)
- 7 days/yr
- Hot days in 30 yrs
- 23 days/yr
Wind risk 4/10 · Minor
- Chance of severe wind over 30 yrs
- 24.0%
Air-quality risk 3/10 · Minor
- Unhealthy air days now
- 2 days/yr
- Unhealthy air days in 30 yrs
- 3 days/yr
Risk factors via First Street. Map © Google.
Why this score? — see what drove the C+ grade
The composite is a weighted blend of 9 inputs, each scored 0–100. Each bar is that input's sub-score; the figure is the points it added to the 100-point composite (weight × sub-score).
- Cash flow +22.5/30.0
- ARV discount +15.0/15.0
- DSCR +7.2/10.0
- 1% rule +6.5/10.0
- Livability +4.0/5.0
- Rent growth +3.2/5.0
- Condition / age +2.5/5.0
- Schools +2.0/10.0
- Appreciation +0.0/10.0
$139,900
🖨 Deal sheet 📄 Offer letter ✓ Due diligence
Listing remarks
Whether you're looking for a high-yield rental or a fix-and-flip project in the heart of Fort Worth, 5729 Wellesley Ave represents a premier entry-level opportunity. This property is being offered strictly As-Is, providing a blank canvas for an investor or a handy homeowner to build immediate equity. Property also has an enclosed, detached garage and has a back alley way. The potential is there! This property will not stay on the market long. This property will sell. Don't miss out on this opportunity!
Key facts
- Back alley way
- 6,250 sq ft lot
- Built 1953
Tags
Property features AI
Finance
- Other: Property is for sale; Standard listing conditions; Possession: Other
- Financial info: No second mortgage listed; Loan type: Treat as clear
- HOA & community: No association
Exterior
- Parking: No garage; No covered or carport spaces
- Utilities: City water; City sewer; No municipal utility district
- Home design: Single-family residence; Residential property; Built in 1953; Not attached to another unit; No accessory unit
- Construction: Frame construction; Shingle roof; Slab foundation
- Exterior features: Alley access; Common parking area; Lot under 0.5 acre
Interior
- Kitchen: No appliances included
- Bedrooms: 3 bedrooms (primary bedroom on level 1, approx. 12 x 9)
- Flooring: Laminate flooring
- Bathrooms: 1 full bathroom
- Heating & cooling: No heating; No cooling
- Interior features: One-level layout; Open living/dining arrangement; Other interior features
- Laundry & utility: No laundry features listed
Neighborhood map
What this means for you Summary
Snapshot
- This is a 3-bed/1.0-bath single-family listed at $140k.
Deal economics
- At list price, monthly cash flow is $234 ($3k/yr) — positive.
- The deal already cash-flows at list — no discount required.
- Meets the 1% rule at list price ($2k rent vs $140k).
- Cap rate 8.3% vs local median 3.9% in Fort Worth — top-decile yield for the area; either an underpriced asset or a hidden risk that comps aren't pricing in. Stress-test before assuming the spread holds.
Location & tenants
- Location reads 80/100 on livability (#49 in TX, #1,954 nationally) — a professional / high-income tenant draw. Strengths: amenities A+, cost of living A+, housing A+; Watch: schools D+, crime F.
- Fort Worth ISD (urban): math 18% / reading 28% proficiency, ranked #742 of 826 in TX (top 90%) — low school quality limits family demand, transient renter base, plan for 1-2y turnover; 73% free/reduced lunch — lower-income household profile, screen leases tightly.
- Market conditions: Rents rising (+2.9%/yr); 271 active listings in the ZIP; 40 comparable units currently listed for rent nearby; rentals at typical pace (median 22d on market — plan ~3-4 weeks tenant-placement turnaround); solid renter incomes; 18,938 units permitted in Tarrant County in 2024 (8,336 in 5+ unit buildings).
Forward outlook
- Local home prices are declining (-3.0%/yr); year-one equity from $967 of loan paydown is wiped out by about $4k of value loss. Plan a longer hold.
- Tarrant County population projected at +41% by 2050 — long-run rental-demand tailwind backs the buy-and-hold thesis.
Negotiation context
- Only 11 days on market — expect competitive offers; lowballing is unlikely to land.
Risks & watch-outs
- Watch-outs: built in 1953 — expect roof / HVAC / electrical / plumbing capex.
- Climate carrying-cost: major flood risk; extreme-heat days projected 7→23/yr by 2055 (HVAC capex compounding) — expect insurance premiums to compound above CPI over the hold.
Questions for the listing agent
- Built in 1953 — when were the roof, HVAC, electrical panel, plumbing, and water heater last replaced?
- Is there a deadline driving the sale (1031 exchange, divorce, estate, relocation)? That informs how much negotiation room exists.
- Schools are D-rated, which usually means shorter tenancies and higher turnover. Who's the typical renter profile here, and what's been the actual vacancy rate?
- Crime grade is F in this area — have there been break-ins, vandalism, or insurance claims at this property in the last 3 years? What carrier currently insures it and at what premium?
- What's the average days-on-market for RENTAL listings here right now (not sales)? A rising rental-DOM trend means longer vacancies and softer asking-rent achievability than the comps imply.
- What's the recent tenant-quality profile in this submarket — average credit score on applications, eviction rate, late-payment / NSF rate, and stable-employment percentage? A property-management company in the area should have these aggregated.
- How much new for-sale + rental construction is in the pipeline within 1–3 miles? Heavy new supply typically softens prices + rents 12–24 months out; constrained supply supports both.
Investment metrics
- 1% rule
- 1.15% ✓
- Cap rate
- 8.30%
- Cash-on-cash
- 7.18%
- DSCR
- 1.32
- GRM
- 7.2
CMA / ARV
- ARV (median comp)
- $195,530
- List price
- $139,900
- Delta
- -28.45%
- Verdict
- UNDERPRICED
- Comps
- 20 within 1.0 mi
Show comp detail 12 sales within ~0.75 mi
| Address | Dist | Beds/Ba | Sqft | Sold | Price | $/sf | Match |
|---|---|---|---|---|---|---|---|
| 5720 Goodman Ave | 0.23mi | 3/1.0 | 889 (-2%) | 11mo | $117,500 | $132 | 76 |
| 5921 Houghton Ave | 0.20mi | 2/1.0 (-1) | 912 (0%) | 12mo | $187,500 | $206 | 75 |
| 5433 Houghton Ave | 0.32mi | 2/1.0 (-1) | 936 (+3%) | 4mo | $149,900 | $160 | 72 |
| 5809 Fletcher Ave | 0.09mi | 3/2.0 | 960 (+5%) | 15mo | $189,900 | $198 | 71 |
| 5801 Houghton Ave | 0.08mi | 2/1.0 (-1) | 843 (-8%) | 12mo | $187,000 | $222 | 68 |
| 5936 Libbey Ave | 0.38mi | 2/1.0 (-1) | 912 (0%) | 13mo | $205,000 | $225 | 67 |
| 5836 Kilpatrick Ave | 0.20mi | 3/1.0 | 1,034 (+13%) | 2mo | $210,000 | $203 | 66 |
| 2512 Earl Ln | 0.71mi | 3/1.0 | 912 (0%) | 3mo | $250,000 | $274 | 65 |
| 5909 Locke Ave | 0.49mi | 3/1.0 | 941 (+3%) | 12mo | $235,000 | $250 | 62 |
| 5329 Libbey Ave | 0.54mi | 2/1.0 (-1) | 975 (+7%) | 8mo | $169,000 | $173 | 52 |
| 5520 Birchman Ave | 0.72mi | 2/1.0 (-1) | 925 (+1%) | 9mo | $247,000 | $267 | 52 |
| 5321 Lovell | 0.58mi | 3/1.0 | 1,036 (+14%) | 9mo | $211,900 | $205 | 43 |
Match score weights: distance 35% · size 25% · config 20% · recency 20%. Top-matched comps best support the ARV.
Projected returns pro-forma
-3.0% appreciation · 2.94% rent growth · sell at horizon
- IRR
- -5.3%
- Equity multiple
- 0.80×
- Total profit
- $-7,766
- Equity at exit
- $20,860
- IRR
- 4.3%
- Equity multiple
- 1.32×
- Total profit
- $12,350
- Equity at exit
- $12,096
Cash invested: $39,172 (down + closing). Projections, not guarantees.
Landlord ↔ Tenant lean methodology
- Overall (STATE)
- 87 Strongly Landlord-Friendly
- State Texas
- 87 Strongly Landlord-Friendly · R+5
- County
- — inherits STATE
- City
- — inherits STATE
ZIP-level market 76107
- Rents YoY
- 2.9%
- Active inventory
- 271
- Price-to-rent
- 7.2×
Monthly cashflow live
- Estimated rent
- $1,614 high interval (Pro) →
- Mortgage (P&I)
- −$734
- Tax from tax record
- −$249 /mo · $2,986/yr
- Insurance
- −$58
- HOA
- −$0
- Vacancy / Maint / Mgmt
- −$339
- Net cashflow
- $234
Break-even live
UW: 25.0% down · 7.5% · 30yr · 1.5% tax · 5.0% vac · 8.0% maint · 8.0% mgmt
Financing live
Cash to close
- Down payment
- $34,975
- Closing costs
- $4,197
- Reserves months
- —
- Total cash needed
- —
Loan-product check · same deal, 3 products live
Conventional
25% down · 7.5% · 30yr
- Down + closing
- —
- Monthly P&I
- —
- Monthly cashflow
- —
- DSCR
- —
- Eligible?
- —
Personal DTI + credit; lowest rate.
DSCR
20% down · 8.5% · 30yr
- Down + closing
- —
- Monthly P&I
- —
- Monthly cashflow
- —
- DSCR
- —
- Eligible?
- —
No personal income docs; deal must DSCR.
Hard money
10% down · 12.0% · 12mo
- Down + closing
- —
- Monthly P&I
- —
- Monthly cashflow
- —
- DSCR
- —
- Eligible?
- —
Short-term bridge; refi at stabilization.
Rent comps 40 comps
| Address | Beds | Baths | Sqft | Rent | $/sqft | DOM | Units | Dist |
|---|---|---|---|---|---|---|---|---|
| 5536 Fletcher Ave Fort Worth, TX | 2.0 | 1.0 | 852 | $1,375 | $1.61 | 24d | 1 | 0.17mi |
| 5809 Kilpatrick Ave Fort Worth, TX | 2.0 | 1.0 | 814 | $1,395 | $1.71 | 5d | 1 | 0.20mi |
| 5809 Kilpatrick Ave Fort Worth, TX | 2.0 | 1.0 | 814 | $1,395 | $1.71 | 24d | 1 | 0.20mi |
| 5529 Diaz Ave Fort Worth, TX | 3.0 | 1.0 | 816 | $1,400 | $1.72 | 6d | 1 | 0.24mi |
| 5512 Humbert Ave Fort Worth, TX | 2.0 | 1.0 | 840 | $2,000 | $2.38 | 43d | 1 | 0.47mi |
| 5832 Locke Ave Fort Worth, TX | 2.0 | 2.0 | 885 | $1,550 | $1.75 | 43d | 1 | 0.52mi |
| 5832 Locke Ave Fort Worth, TX | 2.0 | 1.0 | 884 | $1,450 | $1.64 | 15d | 1 | 0.52mi |
| 5904 Locke Ave Fort Worth, TX | 3.0 | 1.0 | 1054 | $1,750 | $1.66 | 43d | 1 | 0.54mi |
| 5209 Kilpatrick Ave Fort Worth, TX | 2.0 | 1.0 | 650 | $1,500 | $2.31 | 43d | 1 | 0.58mi |
| 5885 Calmont Ave Fort Worth, TX | 1.0–3.0 | 1.0–2.5 | 1214 | $3,358 | $2.77 | 1d | 151 | 0.63mi |
| 4500 Westridge Ave #21 Fort Worth, TX | 2.0 | 2.0 | 1104 | $2,400 | $2.17 | 43d | 1 | 0.66mi |
| 4716 Littlepage St Fort Worth, TX | 2.0 | 1.0 | 748 | $1,195 | $1.60 | 24d | 1 | 0.73mi |
| 4900 Bryant Irvin Rd N Unit 2121 Fort Worth, TX | 2.0 | 2.0 | 750 | $1,257 | $1.68 | 3d | 1 | 0.80mi |
| 4900 Bryant Irvin Rd N Unit 4957 Fort Worth, TX | 2.0 | 2.0 | 750 | $1,300 | $1.73 | 11d | 1 | 0.82mi |
| 4900 Bryant Irvin Rd N Unit 4927 Fort Worth, TX | 2.0 | 2.0 | 776 | $1,324 | $1.71 | 22d | 1 | 0.82mi |
| 5002 Geddes Ave Fort Worth, TX | 2.0 | 1.0 | 924 | $1,495 | $1.62 | 43d | 1 | 0.83mi |
| 5101 Locke Ave Unit 2900 Fort Worth, TX | 2.0 | 1.0 | 995 | $1,300 | $1.31 | 24d | 1 | 0.84mi |
| 3602 Eldridge St Fort Worth, TX | 1.0–2.0 | 1.0–2.0 | 916 | $1,600 | $1.75 | 2d | 10 | 0.88mi |
| 4933 Curzon Ave Fort Worth, TX | 2.0 | 2.0 | 900 | $1,650 | $1.83 | 43d | 1 | 0.90mi |
| 6455 Waverly Way Fort Worth, TX | 2.0 | 1.0 | 1017 | $1,600 | $1.57 | 6d | 1 | 0.91mi |
| 4914 Donnelly Ave Fort Worth, TX | 2.0 | 1.0 | 760 | $1,100 | $1.45 | 22d | 1 | 0.91mi |
| 4824 Wellesley Ave Apt C Fort Worth, TX | 2.0 | 1.0 | 837 | $1,400 | $1.67 | 19d | 1 | 0.95mi |
| 4824 Wellesley Ave Unit A Fort Worth, TX | 2.0 | 1.0 | 837 | $1,400 | $1.67 | 43d | 1 | 0.95mi |
| 4919 Lovell Ave Unit 4919 Fort Worth, TX | 2.0 | 1.5 | 880 | $1,350 | $1.53 | 43d | 1 | 0.95mi |
| 4811 Houghton Ave Fort Worth, TX | 2.0 | 2.0 | 1000 | $1,395 | $1.40 | 19d | 1 | 0.99mi |
| 4720 Wellesley Ave Fort Worth, TX | 1.0–2.0 | 1.0 | 745 | $1,175 | $1.58 | 24d | 1 | 1.05mi |
| 4720 Wellesley Ave Fort Worth, TX | 2.0 | 1.0 | 920 | $1,175 | $1.28 | 20d | 1 | 1.05mi |
| 4727 Wellesley Ave Fort Worth, TX | 2.0 | 1.0–2.0 | 786 | $1,430 | $1.82 | 10d | 15 | 1.06mi |
| 4814 Lovell Ave Fort Worth, TX | 2.0 | 1.0 | 900 | $1,400 | $1.56 | 24d | 1 | 1.07mi |
| 2409 Ridgmar Plz Fort Worth, TX | 1.0–2.0 | 1.0–2.0 | 1015 | $1,025 | $1.01 | 3d | 12 | 1.09mi |
| 6037 Westridge Ln Unit 6094 Fort Worth, TX | 2.0 | 2.0 | 1056 | $1,107 | $1.05 | 43d | 1 | 1.10mi |
| 6037 Westridge Ln Unit 2121 Fort Worth, TX | 2.0 | 2.0 | 1056 | $1,074 | $1.02 | 3d | 1 | 1.10mi |
| 2500 River Park Dr Fort Worth, TX | 1.0–2.0 | 1.0–2.0 | 1006 | $2,686 | $2.67 | 2d | 19 | 1.17mi |
| 4928 El Campo Ave Fort Worth, TX | 1.0–2.0 | 1.0 | 800 | $1,350 | $1.69 | 1d | 5 | 1.19mi |
| 4945 Gage Ave Fort Worth, TX | 3.0 | 1.0–3.0 | 1217 | $4,290 | $3.52 | 1d | 45 | 1.23mi |
| 2508 Ridgmar Blvd Fort Worth, TX | 1.0–3.0 | 1.0–2.0 | 1025 | $1,549 | $1.51 | 20d | 3 | 1.27mi |
| 2201 Ridgmar Blvd Fort Worth, TX | 2.0 | 1.0–2.0 | 805 | $1,435 | $1.78 | 43d | 25 | 1.28mi |
| 4900 Gage Ave Fort Worth, TX | 1.0–3.0 | 1.0–2.0 | 1128 | $6,416 | $5.69 | 2d | 42 | 1.30mi |
| 4908 Byers Ave Unit D Fort Worth, TX | 2.0 | 2.0 | 1026 | $1,295 | $1.26 | 24d | 1 | 1.31mi |
| 4901 Bryce Ave Unit 9 Fort Worth, TX | 2.0 | 1.0 | 894 | $1,450 | $1.62 | 43d | 1 | 1.33mi |
Listing history 5 events
-
2026-05-16price $144,900 507-char remark
-
2026-05-13$149,900 Active 507-char remark
-
2000-08-23soldstatus
-
1994-01-27soldstatus
-
1991-12-18soldstatus
ⓘ Source: listings_history table (triggers on properties + properties_extension) + one-shot
backfill from property_details.listing_events for pre-trigger history.
Tax reassessment forecast TX · Resets to sale price
- Current annual tax
- $2,986 · $249/mo
- Projected year-2 tax
- $2,986 · $249/mo
- Expected delta
- $0/yr ($0/mo · 0.0%)
ⓘ Screening estimate from a state-policy table — verify with the county assessor before closing.
Climate risk First Street
- Flood 6/10 Major FEMA zone X (unshaded) · 74% chance over 30 yrs
- Wildfire 1/10 Low
- Heat 7/10 Severe 7 d/yr ≥108°F today · 23 d/yr by 30 yrs out
- Wind 4/10 Moderate 24% chance of damaging wind over 30 yrs
- Air quality 3/10 Moderate 2 unhealthy d/yr today · 3 by 30 yrs out
Nearby sold comps map
Loading sold comps map…
Walkable amenities ~0.75 mi
Loading nearby amenities…
Taxation est. · year 1
- Rental income
- $19,371
- − Mortgage interest
- −$7,837
- − Property taxes
- −$2,986
- − Insurance
- −$700
- − Repairs & maintenance
- −$1,550
- − Management
- −$1,550
- − Depreciation
- −$4,070
- Taxable income
- $679
- Est. tax owed @ 24.0%
- −$163
- After-tax cash flow
- $2,650/yr
For passive investors: Depreciation is non-cash, so a rental often shows a tax loss while cash-flowing — sheltering income. Rental losses are passive: they offset passive income freely, and up to $25,000/yr can offset ordinary (W-2) income if you actively participate and your MAGI is under $100k (phasing out to $0 by $150k); unused losses carry forward. On sale, claimed depreciation is recaptured at up to 25%, and gains may owe capital-gains tax (a 1031 exchange can defer both). Figures are a year-1 estimate at your 24.0% rate — not tax advice; consult a CPA.
Schools (NCES district)
- District
- Fort Worth ISD
- NCES district ID
- 4819700
- Math proficiency
- 18% ▼ -16.00%
- Reading proficiency
- 28% ▼ -6.00%
- Median HH income
- $42,109
- Composite
- 19.61/100
- National rank
- #8753
- State rank
- #742 of 826 in TX
Livability — Fort Worth
- Score
- 80/100
- State rank
- #49
- US rank
- #1954
Category grades
Schools grade is shown separately in the Schools card above.
Census & demographics
- Census place
- Fort Worth, TX
- County
- Tarrant County · 2,033,669 people
- City population
- 911,619
- Metro
- Dallas-Fort Worth-Arlington, TX
- Population (ZIP)
- 30,994
- Household income
- $79,990
- Rent vs Own
- Severe rent burden
- 2303.0
Population outlook (Tarrant County) Hauer SSP2
- Today (2025)
- 2,380,417 people
- By 2030
- 2,578,900 · +8.3%
- By 2040
- 2,974,995 · +25.0%
- By 2050
- 3,350,489 · +40.8%
- By 2075
- 4,216,909 · +77.2%
- By 2100
- 4,741,527 · +99.2%
Race, ethnicity, and origin ACS 2023
- Neighborhood character
- Diverse neighborhood (Simpson 0.58)
- Race & ethnicity
- White 59% Hispanic / Latino 20% Black 15% Two or more races 8% Asian 3%
- Hispanic origin (detail)
- Mexican 17%
- Common ancestry
- Slovak 3% Lithuanian 2% Romanian 1%
- Foreign-born
- 9% · Canada, China, Vietnam
- Languages at home
- 82% English-only · Spanish 14% French/Haitian/Cajun 1% Chinese 1%
Political lean MEDSL · Tarrant
- 2024 margin
- Lean R (+5.1) · D 46.7% · R 51.9% · Other 1.4%
- 2008→2024 swing
- +6.6pp toward D · 2008: -11.7pp · 2024: -5.1pp
- All cycles
- 2024: R+5.1 2020: D+0.2 2016: R+8.7 2012: R+15.7 2008: R+11.7
Not yet ingested
- Civics
- —
Market trends
- HPI YoY
- ▼ -447.90%
- Current HPI
- 296.4355
- Rent YoY
- ▲ 2.94%
- Metro
- Dallas-Fort Worth-Arlington, TX
- State GDP YoY
- ▲ 3.95%
- F500 in state
- 110
Industry mix (Fortune 500 HQ in TX)
| Industry | F500 HQs | Revenue |
|---|---|---|
| Energy | 16 | $1,198B |
|
||
| Technology | 5 | $198B |
|
||
| Engineering / Construction | 4 | $72B |
|
||
| Energy Services | 3 | $60B |
|
||
| Utilities | 3 | $41B |
|
||
| Healthcare | 2 | $330B |
|
||
Price history
-6.7% since first listed8 events — show timeline
- 2026-05-25 Listing Removed — NTREIS
- 2026-05-20 Price Changed $139,900 NTREIS
- 2026-05-16 Price Changed $144,900 NTREIS
- 2026-05-13 Listed $149,900 NTREIS
- 2026-05-12 Sold (Public Records) — Public Records
- 2000-08-23 Sold (Public Records) — Public Records
- 1994-01-27 Sold (Public Records) — Public Records
- 1991-12-18 Sold (Public Records) — Public Records
Property tax history
+9.7%/yrLatest (2025): $2,986 · -11.3% YoY. Source: county tax records.
Cash-flow waterfall
monthlySold comps — $/sqft
last 12 mo · ≤1 miLoading sold comps…