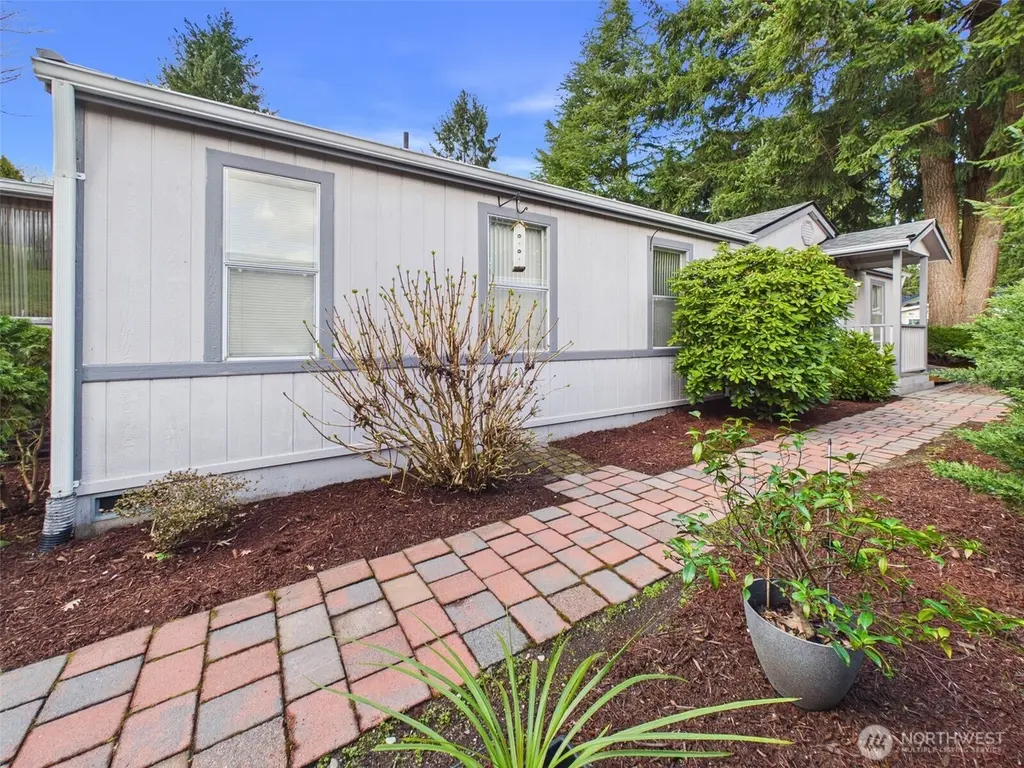
5250 College St SE #12 · Lacey, WA
Flood risk 1/10 · Minimal
- FEMA flood zone
- X (unshaded)
- Chance of flooding over 30 yrs
- 0.0%
- Est. flood insurance / yr
- $507 – $1,088
Fire risk 3/10 · Minor
- Est. fire insurance / yr
- $604 – $1,122
Heat risk 3/10 · Minor
- Hot days now (above 88°F)
- 7 days/yr
- Hot days in 30 yrs
- 14 days/yr
Wind risk 1/10 · Minimal
- Chance of severe wind over 30 yrs
- —
Air-quality risk 6/10 · Moderate
- Unhealthy air days now
- 7 days/yr
- Unhealthy air days in 30 yrs
- 8 days/yr
Risk factors via First Street. Map © Google.
Why this score? — see what drove the B grade
The composite is a weighted blend of 9 inputs, each scored 0–100. Each bar is that input's sub-score; the figure is the points it added to the 100-point composite (weight × sub-score).
- Cash flow +30.0/30.0
- 1% rule +10.0/10.0
- DSCR +10.0/10.0
- ARV discount +7.0/15.0
- Schools +5.1/10.0
- Livability +4.2/5.0
- Rent growth +3.4/5.0
- Condition / age +2.5/5.0
- Appreciation +0.0/10.0
$129,000
🖨 Deal sheet (PDF) 📄 Offer letter ✓ Due diligence
Listing remarks
Move-in ready and affordable 3-bedroom, 2-bath manufactured home in Emerald Park, a desirable 55+ community in Lacey near College St with nearby shopping, golf, and convenient bus lines. This light-filled home features an open-concept living, kitchen, and dining area with vaulted ceilings and abundant natural light. The kitchen boasts and eating bar, eating nook and offers extensive cabinetry, fully equipped with a Whirlpool/GE stainless steel appliance package, plus washer and dryer included. Spacious primary suite with private full bath, with two additional bedrooms and full guest bath on the opposite side for added privacy. Recent updates include a brand new roof (2026), heat pump (2022)
Key facts
- Recent updates
- Hvac
- Extensive cabinetry
Tags
Neighborhood map
What this means for you Summary
Snapshot
- This is a 3-bed/2.0-bath manufactured listed at $129k.
Deal economics
- At list price, monthly cash flow is $949 ($11k/yr) — positive.
- The deal already cash-flows at list — no discount required.
- Meets the 1% rule at list price ($2k rent vs $129k).
- Recommended offer: $121k (6.0% below list) — sets the bar for market timing.
- Cap rate 15.1% vs local median 3.0% in Lacey — top-decile yield for the area; either an underpriced asset or a hidden risk that comps aren't pricing in. Stress-test before assuming the spread holds.
Location & tenants
- Location reads 85/100 on livability (#33 in WA, #581 nationally) — a professional / high-income tenant draw. Strengths: amenities A+, commute A+, housing A+; Watch: cost of living D+.
- North Thurston Public Schools (suburban): math 51% / reading 62% proficiency, ranked #80 of 291 in WA (top 28%) — acceptable for families but not a draw, mixed tenant base, ~2y average lease.
- Market conditions: Rents rising (+3.6%/yr); 190 active listings in the ZIP; 24 comparable units currently listed for rent nearby; rentals at typical pace (median 22d on market — plan ~3-4 weeks tenant-placement turnaround); solid renter incomes; 1,222 units permitted in Thurston County in 2024 (508 in 5+ unit buildings).
- This rent runs 31% of the median local income ($89k/yr) — at the standard rent-burdened threshold; future hikes will face affordability resistance.
Forward outlook
- Local home prices are declining (-3.0%/yr); year-one equity from $892 of loan paydown is wiped out by about $4k of value loss. Plan a longer hold.
- Thurston County population projected at +27% by 2050 — long-run rental-demand tailwind backs the buy-and-hold thesis.
- At projected returns (-3.0% appreciation + 3.6% rent growth), your $36k cash investment doubles in ~4 years — after that, you're playing with house money.
Negotiation context
- It's been on market 85 days — a 6% lower offer ($121k) is reasonable based on typical stale-listing flexibility.
Questions for the listing agent
- It's been on market 85 days. Have you received any prior offers? Is the seller open to a 6% concession, seller financing, or rate buy-down credit?
- Why hasn't it sold? Are there any deal-killer items the seller is aware of (foundation, flood, title, zoning, code violations)?
- Is there a deadline driving the sale (1031 exchange, divorce, estate, relocation)? That informs how much negotiation room exists.
- Schools are B-rated — typically a magnet for longer-tenancy family renters. What's the average tenant stay here, and is there a school-zone premium baked into asking?
- What's the average days-on-market for RENTAL listings here right now (not sales)? A rising rental-DOM trend means longer vacancies and softer asking-rent achievability than the comps imply.
- What's the recent tenant-quality profile in this submarket — average credit score on applications, eviction rate, late-payment / NSF rate, and stable-employment percentage? A property-management company in the area should have these aggregated.
- How much new for-sale + rental construction is in the pipeline within 1–3 miles? Heavy new supply typically softens prices + rents 12–24 months out; constrained supply supports both.
Investment metrics
- 1% rule
- 1.81% ✓
- Cap rate
- 15.12%
- Cash-on-cash
- 31.52%
- DSCR
- 2.40
- GRM
- 4.6
CMA / ARV
- ARV (median comp)
- $127,475
- List price
- $129,000
- Delta
- 1.20%
- Verdict
- FAIR
- Comps
- 10 within 1.0 mi
Show comp detail 8 sales within ~0.75 mi
| Address | Dist | Beds/Ba | Sqft | Sold | Price | $/sf | Match |
|---|---|---|---|---|---|---|---|
| 5250 College St SE #26 | 0.04mi | 2/2.0 (-1) | 1,325 (+2%) | 4mo | $123,400 | $93 | 86 |
| 5514 Asotin Ln SE | 0.29mi | 3/2.0 | 1,344 (+4%) | 4mo | $125,000 | $93 | 77 |
| 5231 Mountain Greens Ln SE #292 | 0.22mi | 3/2.0 | 1,456 (+12%) | 5mo | $129,950 | $89 | 65 |
| 5215 Mountain Green Ln SE | 0.21mi | 3/2.0 | 1,248 (-4%) | 24mo | $160,000 | $128 | 64 |
| 5305 Yakima Ln SE | 0.34mi | 3/2.0 | 1,440 (+11%) | 8mo | $75,000 | $52 | 59 |
| 5532 Chelan Ln SE #47 | 0.38mi | 2/2.0 (-1) | 1,248 (-4%) | 18mo | $87,500 | $70 | 56 |
| 5212 Yakima Ln SE #104 | 0.36mi | 2/2.0 (-1) | 1,434 (+11%) | 6mo | $100,000 | $70 | 55 |
| 5516 SE Mt Green Ln | 0.33mi | 3/2.0 | 1,440 (+11%) | 23mo | $118,000 | $82 | 47 |
Match score weights: distance 35% · size 25% · config 20% · recency 20%. Top-matched comps best support the ARV.
Projected returns pro-forma
-3.0% appreciation · 3.56% rent growth · sell at horizon
- IRR
- 27.1%
- Equity multiple
- 2.13×
- Total profit
- $40,888
- Equity at exit
- $19,234
- IRR
- 35.0%
- Equity multiple
- 4.30×
- Total profit
- $119,046
- Equity at exit
- $11,154
Cash invested: $36,120 (down + closing). Projections, not guarantees.
Landlord ↔ Tenant lean methodology
- Overall (STATE)
- 28 Tenant-Leaning
- State Washington
- 28 Tenant-Leaning · D+8
- County
- — inherits STATE
- City
- — inherits STATE
ZIP-level market 98503
- Rents YoY
- 3.6%
- Active inventory
- 190
- Price-to-rent
- 4.6×
Monthly cashflow live
- Estimated rent
- $2,330 high interval (Pro) →
- Mortgage (P&I)
- −$676
- Tax est. 1.5%
- −$161 /mo · $1,935/yr
- Insurance
- −$54
- HOA
- −$0
- Vacancy / Maint / Mgmt
- −$489
- Net cashflow
- $949
Break-even live
Sensitivity live
| Price | -10% $1,038 | -5% $993 | +0% $949 | +5% $904 | +10% $860 |
|---|---|---|---|---|---|
| Rent | -10% $765 | -5% $857 | +0% $949 | +5% $1,041 | +10% $1,133 |
| Rate | -1.0pp $1,014 | -0.5pp $982 | base $949 | +0.5pp $915 | +1.0pp $881 |
UW: 25.0% down · 7.5% · 30yr · 1.5% tax · 5.0% vac · 8.0% maint · 8.0% mgmt
Financing live
Cash to close
- Down payment
- $32,250
- Closing costs
- $3,870
- Reserves months
- —
- Total cash needed
- —
Loan-product check · same deal, 3 products live
Conventional
25% down · 7.5% · 30yr
- Down + closing
- —
- Monthly P&I
- —
- Monthly cashflow
- —
- DSCR
- —
- Eligible?
- —
Personal DTI + credit; lowest rate.
DSCR
20% down · 8.5% · 30yr
- Down + closing
- —
- Monthly P&I
- —
- Monthly cashflow
- —
- DSCR
- —
- Eligible?
- —
No personal income docs; deal must DSCR.
Hard money
10% down · 12.0% · 12mo
- Down + closing
- —
- Monthly P&I
- —
- Monthly cashflow
- —
- DSCR
- —
- Eligible?
- —
Short-term bridge; refi at stabilization.
Rent comps 24 comps
| Address | Beds | Baths | Sqft | Rent | $/sqft | DOM | Units | Dist |
|---|---|---|---|---|---|---|---|---|
| 4950 51st Ln SE Unit F-201 Lacey, WA | 2.0 | 2.0 | 975 | $1,650 | $1.69 | 22d | 1 | 0.07mi |
| 4625 45th Ave SE Lacey, WA | 1.0–3.0 | 1.0–3.0 | 975 | $2,485 | $2.55 | 14d | 21 | 0.38mi |
| 4533 Stonegate St SE Lacey, WA | 3.0 | 2.5 | 1868 | $2,695 | $1.44 | 44d | 1 | 0.47mi |
| 4566 Beckonridge Loop SE Lacey, WA | 3.0 | 2.5 | 1648 | $2,595 | $1.57 | 44d | 1 | 0.55mi |
| 4820 41st Ln SE Lacey, WA | 3.0 | 2.5 | 1716 | $2,395 | $1.40 | 14d | 1 | 0.59mi |
| 5649 46th Ln SE Lacey, WA | 3.0 | 3.0 | 1100 | $2,300 | $2.09 | 22d | 1 | 0.66mi |
| 5301 Ivy Hill Ln SE Lacey, WA | 2.0 | 2.0 | 1361 | $2,495 | $1.83 | 44d | 1 | 0.67mi |
| 5216 Ivy Hill Ln SE Lacey, WA | 2.0 | 2.0 | 1361 | $2,595 | $1.91 | 14d | 1 | 0.69mi |
| 5207 65th Ave SE Olympia, WA | 3.0 | 2.0 | 1546 | $2,695 | $1.74 | 14d | 1 | 0.86mi |
| 6029 54th Ct SE Lacey, WA | 3.0 | 2.0 | 1558 | $2,395 | $1.54 | 14d | 1 | 0.90mi |
| 6031 Thornbury Pl SE Lacey, WA | 3.0 | 2.5 | 1720 | $2,749 | $1.60 | 14d | 1 | 0.95mi |
| 3725 Wildspitz Ln SE Lacey, WA | 3.0–4.0 | 3.0 | 1774 | $2,695 | $1.52 | 44d | 4 | 0.99mi |
| 5916 Illinois Ln SE Lacey, WA | 3.0 | 3.0 | 1580 | $2,600 | $1.65 | 44d | 1 | 1.04mi |
| 6949 Stone St SE Olympia, WA | 3.0 | 2.0 | 1712 | $2,795 | $1.63 | 22d | 1 | 1.09mi |
| 3622 57th Ln SE Olympia, WA | 2.0 | 2.0 | 1156 | $1,999 | $1.73 | 14d | 1 | 1.11mi |
| 5407 Komachin Loop SE Lacey, WA | 3.0 | 2.0 | 1590 | $2,500 | $1.57 | 22d | 1 | 1.12mi |
| 3301 College St SE Lacey, WA | 2.0 | 2.0 | 900 | $1,845 | $2.05 | 22d | 1 | 1.13mi |
| 3539 Landview Dr SE Olympia, WA | 1.0–3.0 | 1.0–2.0 | 1314 | $2,895 | $2.20 | 14d | 19 | 1.14mi |
| 3425 Polo Club Ln SE Olympia, WA | 1.0–3.0 | 1.0–2.0 | 934 | $2,329 | $2.49 | 14d | 9 | 1.25mi |
| 6720 Alder Glen Dr SE Olympia, WA | 4.0 | 2.0 | 1548 | $3,600 | $2.33 | 44d | 1 | 1.35mi |
| 5905 Cherokee Loop SE Lacey, WA | 3.0 | 2.5 | 1570 | $2,500 | $1.59 | 44d | 1 | 1.35mi |
| 5323 Rumac St SE Olympia, WA | 2.0 | 1.5 | 1012 | $2,095 | $2.07 | 44d | 1 | 1.39mi |
| 5203 Rumac St SE Unit A Olympia, WA | 2.0 | 1.5 | 1012 | $2,195 | $2.17 | 44d | 1 | 1.41mi |
| 5701 30th Ave SE Lacey, WA | 2.0 | 2.0 | 899 | $1,503 | $1.67 | 14d | 2 | 1.49mi |
Listing history 13 events
-
2026-06-18days on market $129,000 Active 85 DOM
-
2026-06-17days on market $129,000 Active 84 DOM
-
2026-06-16days on market $129,000 Active 83 DOM
-
2026-06-15days on market $129,000 Active 82 DOM
-
2026-06-14days on market $129,000 Active 80 DOM
-
2026-06-13days on market $129,000 Active 79 DOM
-
2026-06-10days on market $129,000 Active 77 DOM
-
2026-06-09days on market $129,000 Active 76 DOM
-
2026-06-08days on market $129,000 Active 75 DOM
-
2026-06-07statusdays on market $129,000 Active 74 DOM
-
2026-05-30status $129,000 Pending 71 DOM
-
2026-04-29price $129,000
-
2026-03-19$139,900 Active
ⓘ Source: listings_history table (triggers on properties + properties_extension) + one-shot
backfill from property_details.listing_events for pre-trigger history.
Climate risk First Street
- Flood 1/10 Low FEMA zone X (unshaded) · 0% chance over 30 yrs
- Wildfire 3/10 Moderate
- Heat 3/10 Moderate 7 d/yr ≥88°F today · 14 d/yr by 30 yrs out
- Wind 1/10 Low
- Air quality 6/10 Major 7 unhealthy d/yr today · 8 by 30 yrs out
Nearby sold comps map
Loading sold comps map…
Walkable amenities ~0.75 mi
Loading nearby amenities…
Taxation est. · year 1
- Rental income
- $27,955
- − Mortgage interest
- −$7,226
- − Property taxes
- −$1,935
- − Insurance
- −$645
- − Repairs & maintenance
- −$2,236
- − Management
- −$2,236
- − Depreciation
- −$3,753
- Taxable income
- $9,924
- Est. tax owed @ 24.0%
- −$2,382
- After-tax cash flow
- $9,005/yr
For passive investors: Depreciation is non-cash, so a rental often shows a tax loss while cash-flowing — sheltering income. Rental losses are passive: they offset passive income freely, and up to $25,000/yr can offset ordinary (W-2) income if you actively participate and your MAGI is under $100k (phasing out to $0 by $150k); unused losses carry forward. On sale, claimed depreciation is recaptured at up to 25%, and gains may owe capital-gains tax (a 1031 exchange can defer both). Figures are a year-1 estimate at your 24.0% rate — not tax advice; consult a CPA.
Schools (NCES district)
- District
- North Thurston Public Schools
- NCES district ID
- 5305850
- Math proficiency
- 51% ▬ 0.00%
- Reading proficiency
- 62% ▬ 0.00%
- Median HH income
- $62,338
- Composite
- 51.09/100
- National rank
- #3798
- State rank
- #80 of 291 in WA
Livability — Lacey
- Score
- 85/100
- State rank
- #33
- US rank
- #581
Category grades
Schools grade is shown separately in the Schools card above.
Census & demographics
- Census place
- Lacey, WA
- County
- Thurston County · 269,345 people
- City population
- 108,850
- Metro
- Olympia-Lacey-Tumwater, WA
- Population (ZIP)
- 41,656
- Household income
- $89,002
- Rent vs Own
- Severe rent burden
- 2195.0
Population outlook (Thurston County) Hauer SSP2
- Today (2025)
- 308,239 people
- By 2030
- 326,483 · +5.9%
- By 2040
- 359,890 · +16.8%
- By 2050
- 391,800 · +27.1%
- By 2075
- 468,024 · +51.8%
- By 2100
- 519,890 · +68.7%
Race, ethnicity, and origin ACS 2023
- Neighborhood character
- Diverse neighborhood (Simpson 0.56)
- Race & ethnicity
- White 65% Two or more races 12% Hispanic / Latino 12% Asian 7% Black 5% Pacific Islander 2% Native American 1%
- Hispanic origin (detail)
- Mexican 8% Puerto Rican 1%
- Common ancestry
- Portuguese 4% Slovak 3% Lithuanian 3%
- Foreign-born
- 10% · Canada, Vietnam, South Korea
- Languages at home
- 82% English-only · Spanish 6% German/W. Germanic 3% Other Asian/Pacific 2%
Political lean MEDSL · Thurston
- 2024 margin
- Strong D (+20.4) · D 58.5% · R 38.1% · Other 3.5%
- 2008→2024 swing
- -1.3pp toward R · 2008: 21.7pp · 2024: 20.4pp
- All cycles
- 2024: D+20.4 2020: D+18.6 2016: D+15.4 2012: D+19.0 2008: D+21.7
Not yet ingested
- Civics
- —
Market trends
- HPI YoY
- ▼ -385.93%
- Current HPI
- 361.0974
- Rent YoY
- ▲ 3.56%
- Metro
- Olympia-Lacey-Tumwater, WA
- State GDP YoY
- ▲ 4.65%
- F500 in state
- 22
Industry mix (Fortune 500 HQ in WA)
| Industry | F500 HQs | Revenue |
|---|---|---|
| Retail | 2 | $269B |
|
||
| Technology / Retail | 1 | $638B |
|
||
| Technology | 1 | $245B |
|
||
| Telecommunications | 1 | $38B |
|
||
| Food / Beverage | 1 | $36B |
|
||
| Automotive / Trucks | 1 | $34B |
|
||
Price history
-7.8% since first listed2 events — show timeline
- 2026-04-29 Price Changed $129,000 NWMLS as Distributed by MLS Grid
- 2026-03-19 Listed $139,900 NWMLS as Distributed by MLS Grid
Property tax history
-31.6%/yrLatest (2026): $86 · -92.4% YoY. Source: county tax records.
Cash-flow waterfall
monthlySold comps — $/sqft
last 12 mo · ≤1 miLoading sold comps…