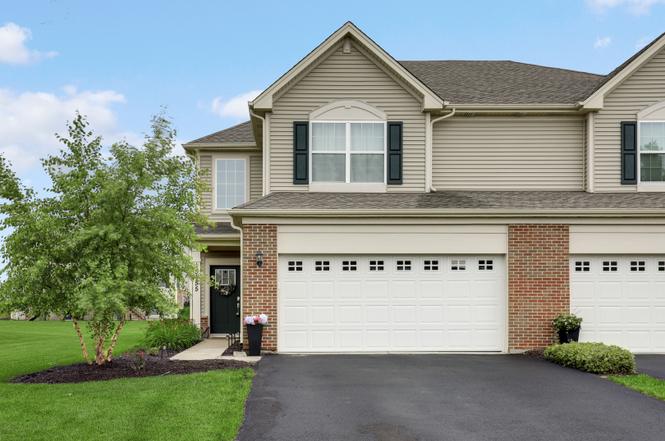
15155 W Cyrus Dr · Manhattan, IL
Flood risk No data
- FEMA flood zone
- —
- Chance of flooding over 30 yrs
- —
- Est. flood insurance / yr
- —
Fire risk No data
- Est. fire insurance / yr
- —
Heat risk No data
- Hot days now (above threshold)
- —
- Hot days in 30 yrs
- —
Wind risk No data
- Chance of severe wind over 30 yrs
- —
Air-quality risk No data
- Unhealthy air days now
- —
- Unhealthy air days in 30 yrs
- —
Risk factors via First Street. Map © Google.
Why this score? — see what drove the D- grade
The composite is a weighted blend of 9 inputs, each scored 0–100. Each bar is that input's sub-score; the figure is the points it added to the 100-point composite (weight × sub-score).
- Cash flow +11.4/30.0
- ARV discount +5.9/15.0
- Schools +4.3/10.0
- 1% rule +4.1/10.0
- Livability +3.5/5.0
- DSCR +3.3/10.0
- Rent growth +2.5/5.0
- Condition / age +2.5/5.0
- Appreciation +0.0/10.0
$315,000
🖨 Deal sheet (PDF) 📄 Offer letter ✓ Due diligence
Listing remarks MLS
Welcome to Stonegate-Presented by Lennar--The Hottest Subdivision in the Southwest Burbs! Check out this Stunning 2 Story End Unit Duplex. 3 beds/2.5 baths plus loft! (Ready in November!). Deluxe Master Bath included! Buyer can pick out interior finishes! Our Everything's Included new duplexes include top of the line features! Our fully appointed kitchens include; quartz counter tops, farmhouse under mount sinks, Aristokraft cabinets and stainless steel GE appliances. Homes also feature; LED surface mounted lighting in the hallways and bedrooms, modern two panel interior doors and colonist trim, vinyl plank flooring in kitchen, foyer, bathrooms and laundry room, a garage door opener, 30 year architectural shingles and so much more, all of which are included with your new home at no extra cost. Plus, the new homes at Stonegate have WiFi CERTIFIED designation that keeps you connected and will be built with superior Smart Home Automation (Ring doorbell, Schlage Smartlock plus WiFi Thermostat!) Great location within Manhattan! Don't miss this fantastic opportunity! Stock photos are being used and may differ from home.
Key facts
- Quartz countertops
- Chef's kitchen
- Turn-key duplex
Tags
Property features AI
Finance
- Other: Not currently leased; Ownership: Fee simple with homeowners association; School bus service and commuter train access; Subdivision: Stonegate; Directions available: Cedar Rd to Smith Rd to McCormick Way
- HOA & community: Monthly HOA fee of $110; HOA covers insurance, exterior maintenance, lawn care, and snow removal; Developer controls management; Park amenity; Pets allowed (cats and dogs permitted; max pet weight listed as 999); Master association fee $400 yearly; Special Service Area: Yes
Exterior
- Parking: Attached garage (garage owned) with garage door opener; Asphalt driveway; 2 total parking spaces, 2 garage spaces
- Security: CO detectors
- Utilities: Public water; Public sewer; Electric with circuit breakers
- Home design: Attached single (1/2 duplex), end unit; Entry level: 1; Model: COURTNEY II
- Construction: Approximately 6–10 years old; Vinyl siding and brick exterior; Asphalt roof; Concrete perimeter foundation
- Exterior features: Patio; Landscaped lot
Interior
- Kitchen: Range; Microwave; Dishwasher; Refrigerator; Eating area with breakfast bar; Pantry closet
- Bedrooms: 3 bedrooms (master and two additional bedrooms on the second floor)
- Flooring: Carpet in bedrooms and great room; Vinyl flooring in kitchen, dining area, and laundry
- Bathrooms: 2 full bathrooms and 1 half bathroom
- Heating & cooling: Natural gas forced-air heating; Central air conditioning; CO detectors
- Interior features: Walk-in closet(s); L-shaped dining room; 6 total rooms
- Laundry & utility: Upper-level, in-unit laundry
Neighborhood map
What this means for you Summary
Snapshot
- This is a 3-bed/2.5-bath townhouse listed at $315k.
Deal economics
- At list price, monthly cash flow is $-107 ($-1k/yr) — negative.
- To cash-flow at today's rent, offer at most $296k (6.0% below list).
- To meet the 1% rule (rent ≥ 1% of price), the offer needs to be $286k (9.1% below list).
- Recommended offer: $286k (9.1% below list) — sets the bar for 1% rule.
- Cap rate 5.9% vs local median 2.6% in Manhattan — top-decile yield for the area; either an underpriced asset or a hidden risk that comps aren't pricing in. Stress-test before assuming the spread holds.
Location & tenants
- Location reads 69/100 on livability (#396 in IL) — a middle-class / working-renter tenant base. Strengths: crime A+, employment A+, housing A+; Watch: amenities F, commute F, health & safety F.
- Lincoln Way Chsd 210 (suburban): math 44% / reading 49% proficiency, ranked #60 of 620 in IL (top 10%) — families likely to look elsewhere, expect single-tenant / working-renter base with shorter leases.
- Zoned schools: Wilson Creek Elem Sch (732 students, 0% FRL); Manhattan Jr High School (math 32% / reading 37%, grade F, #201 of 665 statewide, top 31%, 570 students, 0% FRL); Lincoln-Way East High School (math 46% / reading 53%, grade D, #44 of 693 statewide, top 7%, 2,749 students, 0% FRL).
- Market conditions: 117 active listings in the ZIP; 3 comparable units currently listed for rent nearby; rentals lingering (median 46d on market — plan ~5-8 weeks vacancy on turnover, expect pricing pressure); 67% of comp listings sitting > 30 days — soft ceiling on asking rent; 2,028 units permitted in Will County in 2024 (530 in 5+ unit buildings).
Forward outlook
- Local home prices are declining (-3.0%/yr); year-one equity from $2k of loan paydown is wiped out by about $9k of value loss. Plan a longer hold.
- Will County population projected to shrink 4% by 2050 — rents likely to lag national; underwrite the cash flow, not the appreciation.
Negotiation context
- Only 3 days on market — expect competitive offers; lowballing is unlikely to land.
- 5 sale attempts since 7y ago with the ask held roughly flat each time — persistent listings suggest the price (not the market) is what's stuck; bring a comps-based counter.
- Current owner paid $197k; list at $315k implies a 60% gain — meaningful room to come down on a strong offer.
Questions for the listing agent
- What do current leases actually rent for vs. the listed asking? Can we see a recent rent roll and the last 12 months of T-12 income?
- What does the HOA fee cover, when was the last increase, and are there any pending special assessments or reserve-fund shortfalls?
- Is there a deadline driving the sale (1031 exchange, divorce, estate, relocation)? That informs how much negotiation room exists.
- Schools are B-rated — typically a magnet for longer-tenancy family renters. What's the average tenant stay here, and is there a school-zone premium baked into asking?
- The area grade is low — what's the realistic commute time and amenity access for the typical tenant pool here? Any planned neighborhood developments (good or bad) we should know about?
- What's the average days-on-market for RENTAL listings here right now (not sales)? A rising rental-DOM trend means longer vacancies and softer asking-rent achievability than the comps imply.
- What's the recent tenant-quality profile in this submarket — average credit score on applications, eviction rate, late-payment / NSF rate, and stable-employment percentage? A property-management company in the area should have these aggregated.
- How much new for-sale + rental construction is in the pipeline within 1–3 miles? Heavy new supply typically softens prices + rents 12–24 months out; constrained supply supports both.
Investment metrics
- 1% rule
- 0.91% ✗
- Cap rate
- 5.88%
- Cash-on-cash
- -1.46%
- DSCR
- 0.93
- GRM
- 9.2
CMA / ARV
- ARV (on-the-fly)
- $304,479
- Comps found
- 12
Show comp detail 12 sales within ~0.75 mi
| Address | Dist | Beds/Ba | Sqft | Sold | Price | $/sf | Match |
|---|---|---|---|---|---|---|---|
| 24754 S Mccormick Way | 0.13mi | 3/2.5 | 1,715 (+1%) | 4mo | $312,950 | $182 | 90 |
| 15020 W Quincy Cir | 0.26mi | 3/2.5 | 1,760 (+4%) | 4mo | $290,000 | $165 | 79 |
| 24949 Clare Cir | 0.41mi | 3/1.5 | 1,642 (-4%) | 1mo | $268,000 | $163 | 70 |
| 15352 Kenmare Cir | 0.36mi | 2/1.5 (-1) | 1,642 (-4%) | 2mo | $261,000 | $159 | 67 |
| 15007 W Quincy Cir | 0.30mi | 2/2.5 (-1) | 1,558 (-8%) | 1mo | $288,500 | $185 | 66 |
| 25109 Colligan St | 0.54mi | 3/2.5 | 1,629 (-4%) | 2mo | $295,000 | $181 | 66 |
| 25029 Clare Cir | 0.43mi | 3/1.5 | 1,611 (-5%) | 3mo | $262,500 | $163 | 65 |
| 25047 Clare Cir | 0.48mi | 3/2.5 | 1,556 (-8%) | 1mo | $281,000 | $181 | 62 |
| 15238 Kenmare Cir | 0.29mi | 3/1.5 | 1,510 (-11%) | 2mo | $265,000 | $175 | 62 |
| 25340 Colligan St | 0.73mi | 3/2.5 | 1,629 (-4%) | 1mo | $311,500 | $191 | 58 |
| 25116 Colligan St | 0.57mi | 2/1.5 (-1) | 1,613 (-5%) | 2mo | $289,000 | $179 | 54 |
| 25109 Clare Cir | 0.50mi | 2/1.5 (-1) | 1,520 (-11%) | 3mo | $262,000 | $172 | 47 |
Match score weights: distance 35% · size 25% · config 20% · recency 20%. Top-matched comps best support the ARV.
Projected returns pro-forma
-3.0% appreciation · 3.0% rent growth · sell at horizon
- IRR
- -18.6%
- Equity multiple
- 0.35×
- Total profit
- $-57,727
- Equity at exit
- $46,968
- IRR
- -11.0%
- Equity multiple
- 0.34×
- Total profit
- $-58,426
- Equity at exit
- $27,235
Cash invested: $88,200 (down + closing). Projections, not guarantees.
Landlord ↔ Tenant lean methodology
- Overall (STATE)
- 43 Moderately Tenant-Leaning
- State Illinois
- 43 Moderately Tenant-Leaning · D+7
- County
- — inherits STATE
- City
- — inherits STATE
ZIP-level market 60442
- Home prices YoY
- -9.3%
- Active inventory
- 117
- Price-to-rent
- 9.2×
Monthly cashflow live
- Estimated rent
- $2,863 medium interval (Pro) →
- Mortgage (P&I)
- −$1,652
- Tax from tax record
- −$443 /mo · $5,317/yr
- Insurance
- −$131
- HOA
- −$143
- Vacancy / Maint / Mgmt
- −$601
- Net cashflow
- $-107
Break-even live
Sensitivity live
| Price | -10% $71 | -5% $-18 | +0% $-107 | +5% $-197 | +10% $-286 |
|---|---|---|---|---|---|
| Rent | -10% $-334 | -5% $-221 | +0% $-107 | +5% $6 | +10% $119 |
| Rate | -1.0pp $51 | -0.5pp $-27 | base $-107 | +0.5pp $-189 | +1.0pp $-272 |
UW: 25.0% down · 7.5% · 30yr · 1.5% tax · 5.0% vac · 8.0% maint · 8.0% mgmt
Financing live
Cash to close
- Down payment
- $78,750
- Closing costs
- $9,450
- Reserves months
- —
- Total cash needed
- —
Loan-product check · same deal, 3 products live
Conventional
25% down · 7.5% · 30yr
- Down + closing
- —
- Monthly P&I
- —
- Monthly cashflow
- —
- DSCR
- —
- Eligible?
- —
Personal DTI + credit; lowest rate.
DSCR
20% down · 8.5% · 30yr
- Down + closing
- —
- Monthly P&I
- —
- Monthly cashflow
- —
- DSCR
- —
- Eligible?
- —
No personal income docs; deal must DSCR.
Hard money
10% down · 12.0% · 12mo
- Down + closing
- —
- Monthly P&I
- —
- Monthly cashflow
- —
- DSCR
- —
- Eligible?
- —
Short-term bridge; refi at stabilization.
Rent comps 3 comps
| Address | Beds | Baths | Sqft | Rent | $/sqft | DOM | Units | Dist |
|---|---|---|---|---|---|---|---|---|
| 15030 W Cyrus Dr Manhattan, IL | 3.0 | 2.5 | 1760 | $2,900 | $1.65 | 45d | 1 | 0.07mi |
| 15749 W Crobally Way Manhattan, IL | 2.0 | 2.5 | 1508 | $2,900 | $1.92 | 46d | 1 | 0.93mi |
| 25273 Faraday Rd Manhattan, IL | 2.0 | 1.5 | 1274 | $2,250 | $1.77 | 12d | 1 | 1.17mi |
HOA detail
- Monthly dues
- $143 · $1,716/yr
- Likely covers
- internet
Listing history 3 events
-
2026-06-21days on market $315,000 Active 3 DOM
-
2026-06-18remarks 699-char remark
-
2026-06-18$315,000 Active 1 DOM
ⓘ Source: listings_history table (triggers on properties + properties_extension) + one-shot
backfill from property_details.listing_events for pre-trigger history.
Tax reassessment forecast IL · Partial reset (capped growth)
- Current annual tax
- $5,317 · $443/mo
- Projected year-2 tax
- $6,234 · $519/mo
- Expected delta
- +$917/yr (+$76/mo · 17.2%)
ⓘ Screening estimate from a state-policy table — verify with the county assessor before closing.
Nearby sold comps map
Loading sold comps map…
Walkable amenities ~0.75 mi
Loading nearby amenities…
Taxation est. · year 1
- Rental income
- $34,355
- − Mortgage interest
- −$17,645
- − Property taxes
- −$5,317
- − Insurance
- −$1,575
- − Repairs & maintenance
- −$2,748
- − Management
- −$2,748
- − HOA
- −$1,716
- − Depreciation
- −$9,164
- Taxable loss
- −$6,558
- Est. tax savings @ 24.0%
- +$1,574
- After-tax cash flow
- $284/yr
For passive investors: Depreciation is non-cash, so a rental often shows a tax loss while cash-flowing — sheltering income. Rental losses are passive: they offset passive income freely, and up to $25,000/yr can offset ordinary (W-2) income if you actively participate and your MAGI is under $100k (phasing out to $0 by $150k); unused losses carry forward. On sale, claimed depreciation is recaptured at up to 25%, and gains may owe capital-gains tax (a 1031 exchange can defer both). Figures are a year-1 estimate at your 24.0% rate — not tax advice; consult a CPA.
Schools (NCES district)
- District
- Lincoln Way Chsd 210
- NCES district ID
- 1723070
- Math proficiency
- 44% ▼ -13.00%
- Reading proficiency
- 49% ▼ -9.00%
- Median HH income
- $86,879
- Composite
- 43.4/100
- National rank
- #3019
- State rank
- #60 of 620 in IL
Livability — Manhattan
- Score
- 69/100
- State rank
- #396
- US rank
- #8289
Category grades
Schools grade is shown separately in the Schools card above.
Census & demographics
- Census place
- Manhattan, IL
- City population
- 13,467
- Population (ZIP)
- 13,467
Population outlook (Will County) Hauer SSP2
- Today (2025)
- 705,368 people
- By 2030
- 708,154 · +0.4%
- By 2040
- 702,692 · -0.4%
- By 2050
- 680,249 · -3.6%
- By 2075
- 611,990 · -13.2%
- By 2100
- 516,215 · -26.8%
Race, ethnicity, and origin ACS 2023
- Neighborhood character
- Predominantly White (82%)
- Race & ethnicity
- White 82% Two or more races 11% Hispanic / Latino 10% Black 3%
- Hispanic origin (detail)
- Mexican 10%
- Common ancestry
- Romanian 15% Iranian 3% Portuguese 1%
- Foreign-born
- 4% · Canada
- Languages at home
- 91% English-only · Spanish 5% Russian/Polish/Slavic 3%
Political lean MEDSL · Will
- 2024 margin
- Toss-up / Even · D 50.1% · R 48.5% · Other 1.4%
- 2008→2024 swing
- -11.6pp toward R · 2008: 13.2pp · 2024: 1.6pp
- All cycles
- 2024: D+1.6 2020: D+8.3 2016: D+5.7 2012: D+3.7 2008: D+13.2
Not yet ingested
- Civics
- —
Market trends
- HPI YoY
- ▼ -23.77%
- Current HPI
- 232.3641
- Rent YoY
- —
- Metro
- —
- State GDP YoY
- ▲ 1.59%
- F500 in state
- 60
Industry mix (Fortune 500 HQ in IL)
| Industry | F500 HQs | Revenue |
|---|---|---|
| Insurance | 4 | $201B |
|
||
| Consumer Goods | 4 | $87B |
|
||
| Industrial Machinery | 3 | $64B |
|
||
| Healthcare | 2 | $55B |
|
||
| Retail / Pharmacy | 1 | $148B |
|
||
| Agriculture / Food | 1 | $86B |
|
||
Price history
-64.5% since first listed14 events — show timeline
- 2026-06-18 Listed $315,000 MRED as Distributed by MLS Grid
- 2020-12-24 Sold (MLS) $197,365 MRED as Distributed by MLS Grid
- 2020-12-18 Sold (MLS) $209,975 MRED as Distributed by MLS Grid
- 2020-08-31 Pending — MRED as Distributed by MLS Grid
- 2020-08-19 Price Changed $199,365 MRED as Distributed by MLS Grid
- 2020-08-19 Price Changed $198,365 MRED as Distributed by MLS Grid
- 2020-08-18 Listing Removed — MRED as Distributed by MLS Grid
- 2020-08-18 Listed $209,975 MRED as Distributed by MLS Grid
- 2020-08-06 Listed $197,365 MRED as Distributed by MLS Grid
- 2019-09-26 Listing Removed — MRED as Distributed by MLS Grid
- 2019-09-26 Listing Removed — MRED as Distributed by MLS Grid
- 2019-02-14 Listed — MRED as Distributed by MLS Grid
- 2019-02-14 Listed — MRED as Distributed by MLS Grid
- 2018-06-26 Sold (Public Records) $886,474 Public Records
Property tax history
-2.1%/yrLatest (2020): $5,317 · -66.4% YoY. Source: county tax records.
Cash-flow waterfall
monthlySold comps — $/sqft
last 12 mo · ≤1 miLoading sold comps…