Single Family on E 29th St · Wilmington, DE
Flood risk 1/10 · Minimal
- FEMA flood zone
- X (unshaded)
- Chance of flooding over 30 yrs
- 0.0%
- Est. flood insurance / yr
- $473 – $860
Fire risk 1/10 · Minimal
- Est. fire insurance / yr
- $476 – $884
Heat risk 8/10 · Major
- Hot days now (above 103°F)
- 7 days/yr
- Hot days in 30 yrs
- 16 days/yr
Wind risk 6/10 · Moderate
- Chance of severe wind over 30 yrs
- 27.0%
Air-quality risk 3/10 · Minor
- Unhealthy air days now
- 2 days/yr
- Unhealthy air days in 30 yrs
- 3 days/yr
Risk factors via First Street. Map © Google.
Why this score? — see what drove the B grade
The composite is a weighted blend of 9 inputs, each scored 0–100. Each bar is that input's sub-score; the figure is the points it added to the 100-point composite (weight × sub-score).
- Cash flow +28.4/30.0
- ARV discount +15.0/15.0
- DSCR +10.0/10.0
- 1% rule +7.8/10.0
- Rent growth +3.9/5.0
- Livability +3.2/5.0
- Schools +3.1/10.0
- Condition / age +1.0/5.0
- Appreciation +0.0/10.0
$139,900
🖨 Deal sheet 📄 Offer letter ✓ Due diligence
Listing remarks MLS
Shell/rehab investor opportunity in Wilmington! This 3 bed/1bath property in Wilmington just needs the final touches to make it home! All major systems have been updated to include: new roof, new windows, new HVAC, new electrical and plumbing, framed out. Financing needed is cash, hard money or a reno loan. Schedule your tour today!
Key facts
- New plumbing
- New hvac
- New electrical
Tags
Neighborhood map
What this means for you Summary
Snapshot
- This is a 3-bed/1.0-bath townhouse listed at $140k. Condition is rated poor.
Deal economics
- At list price, monthly cash flow is $453 ($5k/yr) — positive.
- The deal already cash-flows at list — no discount required.
- Meets the 1% rule at list price ($2k rent vs $140k).
- Recommended offer: $127k (9.0% below list) — sets the bar for market timing.
- Cap rate 10.2% vs local median 5.6% in Wilmington — top-decile yield for the area; either an underpriced asset or a hidden risk that comps aren't pricing in. Stress-test before assuming the spread holds.
Location & tenants
- Location reads 64/100 on livability (#52 in DE) — a middle-class / working-renter tenant base. Strengths: cost of living A+, housing A; Watch: employment D+, schools D, commute D.
- Brandywine School District (suburban): math 28% / reading 40% proficiency, ranked #11 of 26 in DE (top 42%) — families likely to look elsewhere, expect single-tenant / working-renter base with shorter leases.
- Market conditions: Rents rising fast (+5.7%/yr); 119 active listings in the ZIP; 40 comparable units currently listed for rent nearby; rentals at typical pace (median 24d on market — plan ~3-4 weeks tenant-placement turnaround); 1,367 units permitted in New Castle County in 2024 (201 in 5+ unit buildings).
- This rent runs 40% of the median local income ($54k/yr) — at the standard rent-burdened threshold; future hikes will face affordability resistance.
Forward outlook
- Local home prices are declining (-3.0%/yr); year-one equity from $967 of loan paydown is wiped out by about $4k of value loss. Plan a longer hold.
- New Castle County population projected at +9% by 2050 — modest demand growth; plan on rents tracking national, not racing it.
- At projected returns (-3.0% appreciation + 5.7% rent growth), your $39k cash investment doubles in ~7 years — after that, you're playing with house money.
Negotiation context
- It's been on market 114 days — a 9% lower offer ($127k) is reasonable based on typical stale-listing flexibility.
- 2 sale attempts with the ask held roughly flat each time — persistent listings suggest the price (not the market) is what's stuck; bring a comps-based counter.
Risks & watch-outs
- Watch-outs: built in 1917 — expect roof / HVAC / electrical / plumbing capex.
- Climate carrying-cost: major wind risk, 27% chance of damaging wind over 30y; extreme-heat days projected 7→16/yr by 2055 (HVAC capex compounding) — expect insurance premiums to compound above CPI over the hold.
Questions for the listing agent
- It's been on market 114 days. Have you received any prior offers? Is the seller open to a 9% concession, seller financing, or rate buy-down credit?
- Have any recent inspections been done? Can we get a copy of the seller's disclosures and any deferred-maintenance estimates?
- Built in 1917 — when were the roof, HVAC, electrical panel, plumbing, and water heater last replaced?
- Why hasn't it sold? Are there any deal-killer items the seller is aware of (foundation, flood, title, zoning, code violations)?
- Is there a deadline driving the sale (1031 exchange, divorce, estate, relocation)? That informs how much negotiation room exists.
- Schools are D-rated, which usually means shorter tenancies and higher turnover. Who's the typical renter profile here, and what's been the actual vacancy rate?
- Crime grade is F in this area — have there been break-ins, vandalism, or insurance claims at this property in the last 3 years? What carrier currently insures it and at what premium?
- What's the average days-on-market for RENTAL listings here right now (not sales)? A rising rental-DOM trend means longer vacancies and softer asking-rent achievability than the comps imply.
- What's the recent tenant-quality profile in this submarket — average credit score on applications, eviction rate, late-payment / NSF rate, and stable-employment percentage? A property-management company in the area should have these aggregated.
- How much new for-sale + rental construction is in the pipeline within 1–3 miles? Heavy new supply typically softens prices + rents 12–24 months out; constrained supply supports both.
Investment metrics
- 1% rule
- 1.28% ✓
- Cap rate
- 10.18%
- Cash-on-cash
- 13.88%
- DSCR
- 1.62
- GRM
- 6.5
CMA / ARV
- ARV (median comp)
- $207,919
- List price
- $139,900
- Delta
- -32.71%
- Verdict
- UNDERPRICED
- Comps
- 20 within 1.0 mi
Show comp detail 12 sales within ~0.75 mi
| Address | Dist | Beds/Ba | Sqft | Sold | Price | $/sf | Match |
|---|---|---|---|---|---|---|---|
| 2717 N West St | 0.21mi | 3/1.0 | 1,150 (-2%) | 2mo | $155,000 | $135 | 85 |
| 2708 Thompson Pl | 0.31mi | 3/1.0 | 1,175 (0%) | 1mo | $215,000 | $183 | 85 |
| 103 W 29th St | 0.13mi | 3/1.5 | 1,250 (+6%) | 2mo | $150,000 | $120 | 80 |
| 212 W 25th St | 0.32mi | 3/1.0 | 1,225 (+4%) | 1mo | $80,000 | $65 | 77 |
| 2412 Lamotte St | 0.23mi | 3/1.0 | 1,275 (+8%) | 0mo | $125,000 | $98 | 75 |
| 3208 N Madison St | 0.45mi | 3/1.0 | 1,200 (+2%) | 2mo | $274,999 | $229 | 74 |
| 417 E 35th St | 0.48mi | 3/1.0 | 1,150 (-2%) | 2mo | $227,000 | $197 | 72 |
| 206 W 26th St | 0.27mi | 3/2.0 | 1,250 (+6%) | 2mo | $228,000 | $182 | 71 |
| 3003 N Tatnall St | 0.17mi | 2/1.0 (-1) | 1,050 (-11%) | 1mo | $165,000 | $157 | 69 |
| 623 W Twenty Eighth St | 0.55mi | 3/1.5 | 1,250 (+6%) | 0mo | $235,000 | $188 | 62 |
| 2601 N Heald St | 0.42mi | 3/1.0 | 1,022 (-13%) | 2mo | $145,000 | $142 | 57 |
| 11 E 42nd St | 0.74mi | 3/1.5 | 1,075 (-8%) | 1mo | $252,500 | $235 | 48 |
Match score weights: distance 35% · size 25% · config 20% · recency 20%. Top-matched comps best support the ARV.
Projected returns pro-forma
-3.0% appreciation · 5.72% rent growth · sell at horizon
- IRR
- 7.1%
- Equity multiple
- 1.29×
- Total profit
- $11,267
- Equity at exit
- $20,860
- IRR
- 18.7%
- Equity multiple
- 2.76×
- Total profit
- $69,002
- Equity at exit
- $12,096
Cash invested: $39,172 (down + closing). Projections, not guarantees.
Landlord ↔ Tenant lean methodology
- Overall (STATE)
- 70 Landlord-Friendly
- State Delaware
- 70 Landlord-Friendly · D+7
- County
- — inherits STATE
- City
- — inherits STATE
ZIP-level market 19802
- Rents YoY
- 5.7%
- Active inventory
- 119
- Price-to-rent
- 6.5×
Monthly cashflow live
- Estimated rent
- $1,797 high interval (Pro) →
- Mortgage (P&I)
- −$734
- Tax est. 1.5%
- −$175 /mo · $2,098/yr
- Insurance
- −$58
- HOA
- −$0
- Vacancy / Maint / Mgmt
- −$377
- Net cashflow
- $453
Break-even live
UW: 25.0% down · 7.5% · 30yr · 1.5% tax · 5.0% vac · 8.0% maint · 8.0% mgmt
Financing live
Cash to close
- Down payment
- $34,975
- Closing costs
- $4,197
- Reserves months
- —
- Total cash needed
- —
Loan-product check · same deal, 3 products live
Conventional
25% down · 7.5% · 30yr
- Down + closing
- —
- Monthly P&I
- —
- Monthly cashflow
- —
- DSCR
- —
- Eligible?
- —
Personal DTI + credit; lowest rate.
DSCR
20% down · 8.5% · 30yr
- Down + closing
- —
- Monthly P&I
- —
- Monthly cashflow
- —
- DSCR
- —
- Eligible?
- —
No personal income docs; deal must DSCR.
Hard money
10% down · 12.0% · 12mo
- Down + closing
- —
- Monthly P&I
- —
- Monthly cashflow
- —
- DSCR
- —
- Eligible?
- —
Short-term bridge; refi at stabilization.
Rent comps 40 comps
| Address | Beds | Baths | Sqft | Rent | $/sqft | DOM | Units | Dist |
|---|---|---|---|---|---|---|---|---|
| 2705 Speakman Pl Wilmington, DE | 3.0 | 1.5 | 1100 | $1,975 | $1.80 | 12d | 1 | 0.14mi |
| 103 E 24th St Unit 1 Wilmington, DE | 3.0 | 1.0 | 1025 | $1,795 | $1.75 | 43d | 1 | 0.23mi |
| 3005 N West St Wilmington, DE | 3.0 | 1.0 | 1176 | $1,900 | $1.62 | 24d | 1 | 0.24mi |
| 5 E 24th St Unit 1 Wilmington, DE | 3.0 | 1.0 | 1150 | $1,795 | $1.56 | 43d | 1 | 0.25mi |
| 2923 N Washington St Wilmington, DE | 3.0 | 1.0 | 1225 | $1,600 | $1.31 | 1d | 1 | 0.29mi |
| 3003 N Washington St Wilmington, DE | 3.0 | 1.0 | 1250 | $1,950 | $1.56 | 43d | 1 | 0.30mi |
| 400 W 29th St Wilmington, DE | 3.0 | 1.5 | 1125 | $1,950 | $1.73 | 43d | 1 | 0.34mi |
| 2601 N Heald St Wilmington, DE | 3.0 | 1.0 | 1025 | $1,795 | $1.75 | 1d | 1 | 0.42mi |
| 302 W 23rd St Unit 1 Wilmington, DE | 2.0 | 1.0 | 1450 | $1,295 | $0.89 | 24d | 1 | 0.45mi |
| 306 W 23rd St Unit 2 Wilmington, DE | 2.0 | 1.0 | 1475 | $1,295 | $0.88 | 43d | 1 | 0.45mi |
| 306 W 23rd St Unit 1 Wilmington, DE | 2.0 | 1.0 | 1475 | $1,295 | $0.88 | 24d | 1 | 0.45mi |
| 306 Concord Ave Unit 2 Wilmington, DE | 3.0 | 1.0 | 1100 | $1,350 | $1.23 | 43d | 1 | 0.47mi |
| 517 W 26th St Unit NA Wilmington, DE | 3.0 | 1.5 | 1344 | $1,900 | $1.41 | 24d | 1 | 0.47mi |
| 312 Concord Ave Unit 2 Wilmington, DE | 2.0 | 1.0 | 700 | $1,295 | $1.85 | 24d | 1 | 0.48mi |
| 314 Concord Ave Unit 2 Wilmington, DE | 2.0 | 1.0 | 1300 | $1,295 | $1.00 | 24d | 1 | 0.48mi |
| 547 Eastlawn Ave Wilmington, DE | 3.0 | 1.0 | 1400 | $1,995 | $1.43 | 43d | 1 | 0.52mi |
| 918 E 17th St Unit 1 Wilmington, DE | 3.0 | 1.0 | 1100 | $1,795 | $1.63 | 1d | 1 | 0.58mi |
| 507 Barrett St Wilmington, DE | 3.0 | 1.0 | 1275 | $1,700 | $1.33 | 43d | 1 | 0.64mi |
| 409 W 20th St Unit 2 Wilmington, DE | 2.0 | 1.0 | 1100 | $1,700 | $1.55 | 10d | 1 | 0.64mi |
| 409 W 20th St Unit 2 Wilmington, DE | 2.0 | 1.0 | 1100 | $1,500 | $1.36 | 12d | 1 | 0.64mi |
| 604 W 20th St Unit 2 Wilmington, DE | 2.0 | 1.0 | 900 | $1,195 | $1.33 | 24d | 1 | 0.72mi |
| 608 W 20th St Wilmington, DE | 2.0 | 1.0 | 800 | $1,400 | $1.75 | 43d | 1 | 0.73mi |
| 3408 Miller Rd Wilmington, DE | 1.0–2.0 | 1.0–2.0 | 889 | $1,775 | $2.00 | 5d | 6 | 0.80mi |
| 518 E 12th St Wilmington, DE | 2.0 | 1.0 | 875 | $1,425 | $1.63 | 20d | 1 | 0.82mi |
| 1217 N King St Wilmington, DE | 3.0 | 1.5 | 1300 | $2,145 | $1.65 | 18d | 1 | 0.84mi |
| 1124 Clifford Brown Walk Wilmington, DE | 2.0 | 1.0 | 1240 | $1,625 | $1.31 | 43d | 1 | 0.85mi |
| 107 W 13th St Wilmington, DE | 3.0 | 1.5 | 1325 | $1,895 | $1.43 | 43d | 1 | 0.88mi |
| 608 W Lea Blvd Wilmington, DE | 1.0–2.0 | 1.0 | 825 | $1,500 | $1.82 | 43d | 1 | 0.89mi |
| 1026 Bennett St Wilmington, DE | 3.0 | 1.0 | 1125 | $1,685 | $1.50 | 1d | 1 | 0.91mi |
| 2 Colony Blvd Wilmington, DE | 1.0–2.0 | 1.0–2.0 | 1112 | $2,500 | $2.25 | 1d | 6 | 0.91mi |
| 1004 N Spruce St Wilmington, DE | 3.0 | 1.5 | 1075 | $1,800 | $1.67 | 18d | 1 | 0.92mi |
| 605 E 10th St Wilmington, DE | 3.0 | 1.0 | 1200 | $1,850 | $1.54 | 24d | 1 | 0.94mi |
| 928 Kirkwood St Wilmington, DE | 3.0 | 1.5 | 1150 | $1,700 | $1.48 | 17d | 1 | 0.97mi |
| 1001 N Orange St Wilmington, DE | 1.0–2.0 | 1.0–2.0 | 833 | $2,135 | $2.56 | 1d | 62 | 1.03mi |
| 835 N Spruce St Wilmington, DE | 3.0 | 1.0 | 775 | $1,700 | $2.19 | 1d | 1 | 1.05mi |
| 913 N Market St Wilmington, DE | 1.0–2.0 | 1.0–2.0 | 974 | $1,985 | $2.04 | 43d | 5 | 1.06mi |
| 310 Shipley Rd Wilmington, DE | 2.0 | 2.0 | 1010 | $1,722 | $1.71 | 1d | 2 | 1.13mi |
| 116 W 9th St Wilmington, DE | 1.0–2.0 | 1.0–2.0 | 813 | $2,250 | $2.77 | 1d | 16 | 1.14mi |
| 201 Philadelphia Pike Unit 216 Wilmington, DE | 2.0 | 1.0 | 850 | $1,400 | $1.65 | 43d | 1 | 1.14mi |
| 228 W 9th St Unit 201 Wilmington, DE | 2.0 | 2.0 | 1031 | $1,695 | $1.64 | 44d | 1 | 1.15mi |
Listing history 16 events
-
2026-06-18days on market $139,900 Active 114 DOM
-
2026-06-17days on market $139,900 Active 113 DOM
-
2026-06-16days on market $139,900 Active 112 DOM
-
2026-06-15days on market $139,900 Active 111 DOM
-
2026-06-13days on market $139,900 Active 109 DOM
-
2026-06-09days on market $139,900 Active 105 DOM
-
2026-06-08days on market $139,900 Active 104 DOM
-
2026-06-07days on market $139,900 Active 103 DOM
-
2026-06-04days on market $139,900 Active 100 DOM
-
2026-06-03days on market $139,900 Active 99 DOM
-
2026-06-02days on market $139,900 Active 98 DOM
-
2026-06-01days on market $139,900 Active 97 DOM
-
2026-05-31days on market $139,900 Active 96 DOM
-
2026-02-24status Active 334-char remark
Show marketing remark (334 chars)
Shell/rehab investor opportunity in Wilmington! This 3 bed/1bath property in Wilmington just needs the final touches to make it home! All major systems have been updated to include: new roof, new windows, new HVAC, new electrical and plumbing, framed out. Financing needed is cash, hard money or a reno loan. Schedule your tour today!
-
2026-02-20$139,900 Active 334-char remark
Show marketing remark (334 chars)
Shell/rehab investor opportunity in Wilmington! This 3 bed/1bath property in Wilmington just needs the final touches to make it home! All major systems have been updated to include: new roof, new windows, new HVAC, new electrical and plumbing, framed out. Financing needed is cash, hard money or a reno loan. Schedule your tour today!
-
2026-02-20historical 334-char remark
Show marketing remark (334 chars)
Shell/rehab investor opportunity in Wilmington! This 3 bed/1bath property in Wilmington just needs the final touches to make it home! All major systems have been updated to include: new roof, new windows, new HVAC, new electrical and plumbing, framed out. Financing needed is cash, hard money or a reno loan. Schedule your tour today!
ⓘ Source: listings_history table (triggers on properties + properties_extension) + one-shot
backfill from property_details.listing_events for pre-trigger history.
Climate risk First Street
- Flood 1/10 Low FEMA zone X (unshaded) · 0% chance over 30 yrs
- Wildfire 1/10 Low
- Heat 8/10 Severe 7 d/yr ≥103°F today · 16 d/yr by 30 yrs out
- Wind 6/10 Major 27% chance of damaging wind over 30 yrs
- Air quality 3/10 Moderate 2 unhealthy d/yr today · 3 by 30 yrs out
Nearby sold comps map
Loading sold comps map…
Walkable amenities ~0.75 mi
Loading nearby amenities…
Taxation est. · year 1
- Rental income
- $21,568
- − Mortgage interest
- −$7,837
- − Property taxes
- −$2,098
- − Insurance
- −$700
- − Repairs & maintenance
- −$1,725
- − Management
- −$1,725
- − Depreciation
- −$4,070
- Taxable income
- $3,413
- Est. tax owed @ 24.0%
- −$819
- After-tax cash flow
- $4,618/yr
For passive investors: Depreciation is non-cash, so a rental often shows a tax loss while cash-flowing — sheltering income. Rental losses are passive: they offset passive income freely, and up to $25,000/yr can offset ordinary (W-2) income if you actively participate and your MAGI is under $100k (phasing out to $0 by $150k); unused losses carry forward. On sale, claimed depreciation is recaptured at up to 25%, and gains may owe capital-gains tax (a 1031 exchange can defer both). Figures are a year-1 estimate at your 24.0% rate — not tax advice; consult a CPA.
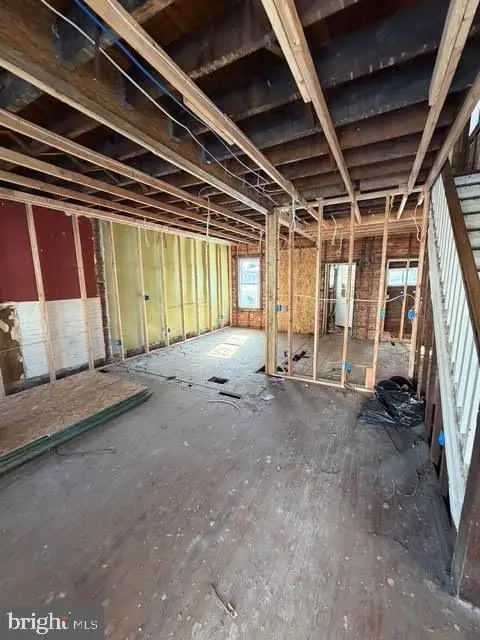
Condition & rehab AI · 12 photos
This property requires extensive renovation, including new framing, drywall, flooring, windows, HVAC, and exterior siding. A comprehensive renovation would significantly increase both resale and rental value.
Repairs flagged
- Major framing — Exposed framing throughout
- Major roof — Exposed beams, no shingles
- Major exterior — Exposed framing, no siding
- Major flooring — Exposed framing, no flooring
- Major interior walls — Exposed framing, no drywall
- Major windows — Exposed framing, no windows
- Major foundation — Exposed framing, no foundation
- Major HVAC — Exposed framing, no HVAC
Value-add opportunities
- Both Complete renovation including new framing, drywall, flooring, windows, HVAC, and exterior siding — Comprehensive renovation would significantly increase both resale and rental value
- Both New roof and waterproofing — New roof and waterproofing would protect the structure and increase both resale and rental value
- Both Landscaping and curb appeal improvements — Landscaping and curb appeal improvements would enhance the home's appeal and increase both resale and rental value
Renovation cost estimate screening
| Repair item | Severity | Est. cost |
|---|---|---|
| framing · Exposed framing throughout | Major | $15,000–50,000 |
| roof · Exposed beams, no shingles | Major | $15,000–50,000 |
| exterior · Exposed framing, no siding | Major | $15,000–50,000 |
| flooring · Exposed framing, no flooring | Major | $15,000–50,000 |
| interior walls · Exposed framing, no drywall | Major | $15,000–50,000 |
| windows · Exposed framing, no windows | Major | $15,000–50,000 |
| foundation · Exposed framing, no foundation | Major | $15,000–50,000 |
| HVAC · Exposed framing, no HVAC | Major | $15,000–50,000 |
| Total estimated repair cost · 8 items | $120,000–400,000 |
Value-add ROI direction
- Both Complete renovation including new framing, drywall, flooring, windows, HVAC, and exterior siding — Comprehensive renovation would significantly increase both resale and rental value ↑
- Both New roof and waterproofing — New roof and waterproofing would protect the structure and increase both resale and rental value ↑
- Both Landscaping and curb appeal improvements — Landscaping and curb appeal improvements would enhance the home's appeal and increase both resale and rental value ↑
ⓘ Cost ranges are severity-bucket heuristics (US national rule-of-thumb). Get contractor quotes + a written scope before underwriting a rehab budget.
Schools (NCES district)
- District
- Brandywine School District
- NCES district ID
- 1001240
- Math proficiency
- 28% ▼ -13.00%
- Reading proficiency
- 40% ▼ -13.00%
- Median HH income
- $68,743
- Composite
- 31.27/100
- National rank
- #6019
- State rank
- #11 of 26 in DE
Livability — Wilmington
- Score
- 64/100
- State rank
- #52
- US rank
- #14251
Category grades
Schools grade is shown separately in the Schools card above.
Census & demographics
- Census place
- Wilmington, DE
- County
- New Castle County · 483,412 people
- City population
- 173,480
- Metro
- Philadelphia-Camden-Wilmington, PA-NJ-DE-MD
- Population (ZIP)
- 26,051
- Household income
- $53,812
- Rent vs Own
- Severe rent burden
- 1816.0
Population outlook (New Castle County) Hauer SSP2
- Today (2025)
- 594,686 people
- By 2030
- 609,164 · +2.4%
- By 2040
- 632,154 · +6.3%
- By 2050
- 649,068 · +9.1%
- By 2075
- 687,771 · +15.7%
- By 2100
- 694,961 · +16.9%
Race, ethnicity, and origin ACS 2023
- Neighborhood character
- Predominantly Black (68%)
- Race & ethnicity
- Black 68% White 20% Hispanic / Latino 7% Two or more races 5%
- Hispanic origin (detail)
- Puerto Rican 4%
- Common ancestry
- Slovak 1% Romanian 1% Italian 1%
- Foreign-born
- 11% · Canada, Jamaica, China
- Languages at home
- 92% English-only · Spanish 4% Arabic 0%
Political lean MEDSL · New Castle
- 2024 margin
- Solid D (+32.6) · D 65.5% · R 32.9% · Other 1.6%
- 2008→2024 swing
- -8.1pp toward R · 2008: 40.6pp · 2024: 32.6pp
- All cycles
- 2024: D+32.6 2020: D+37.1 2016: D+29.6 2012: D+34.1 2008: D+40.6
Not yet ingested
- Civics
- —
Market trends
- HPI YoY
- ▼ -296.47%
- Current HPI
- 225.6613
- Rent YoY
- ▲ 5.72%
- Metro
- Philadelphia-Camden-Wilmington, PA-NJ-DE-MD
- State GDP YoY
- —
- F500 in state
- 0
Price history
3 events — show timeline
- 2026-02-24 Relisted — BRIGHT MLS
- 2026-02-20 Listing Removed — BRIGHT MLS
- 2026-02-20 Listed $139,900 BRIGHT MLS
Cash-flow waterfall
monthlySold comps — $/sqft
last 12 mo · ≤1 miLoading sold comps…