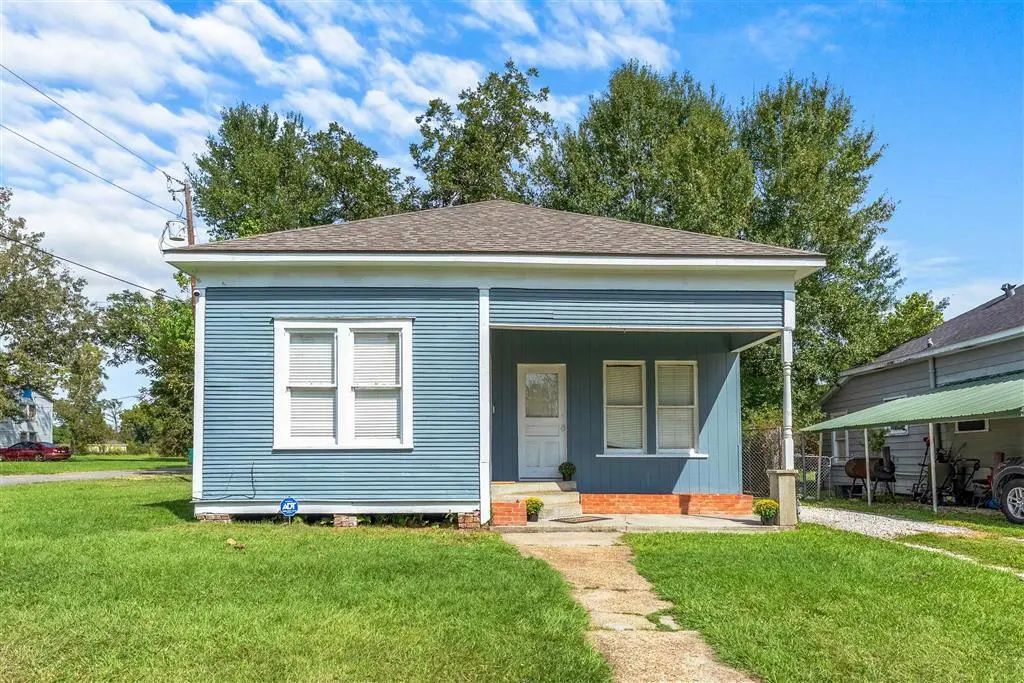
412 Yoakum Ave · DeQuincy, LA
Flood risk 1/10 · Minimal
- FEMA flood zone
- X (unshaded)
- Chance of flooding over 30 yrs
- 0.0%
- Est. flood insurance / yr
- $507 – $1,088
Fire risk 5/10 · Moderate
- Est. fire insurance / yr
- $1,269 – $2,357
Heat risk 9/10 · Severe
- Hot days now (above 110°F)
- 7 days/yr
- Hot days in 30 yrs
- 24 days/yr
Wind risk 9/10 · Severe
- Chance of severe wind over 30 yrs
- 99.0%
Air-quality risk 2/10 · Minimal
- Unhealthy air days now
- 1 days/yr
- Unhealthy air days in 30 yrs
- 1 days/yr
Risk factors via First Street. Map © Google.
Why this score? — see what drove the C grade
The composite is a weighted blend of 9 inputs, each scored 0–100. Each bar is that input's sub-score; the figure is the points it added to the 100-point composite (weight × sub-score).
- Cash flow +21.7/30.0
- ARV discount +10.8/15.0
- DSCR +6.9/10.0
- 1% rule +4.4/10.0
- Livability +3.6/5.0
- Schools +3.1/10.0
- Rent growth +2.5/5.0
- Condition / age +2.5/5.0
- Appreciation +0.0/10.0
$99,000
🖨 Deal sheet (PDF) 📄 Offer letter ✓ Due diligence
Listing remarks MLS
Welcome home to this charming cottage in DeQuincy! With 2 bedrooms and 1 bathroom, this sweet corner-lot home is full of character. You’ll love the warmth of the real hardwood floors flowing throughout, giving the whole space a cozy, inviting feel. The fenced backyard is the perfect place to unwind—complete with a covered patio for relaxing afternoons and a workshop ready for hobbies, projects, or extra storage. This cottage is a perfect blend of charm and comfort, just waiting for its new owner to make it home.
Key facts
- 6,970 sq ft lot
- Built 1963
- Listed 71 days
Neighborhood map
What this means for you Summary
Snapshot
- This is a 2-bed/1.0-bath single-family listed at $99k.
Deal economics
- At list price, monthly cash flow is $152 ($2k/yr) — positive.
- The deal already cash-flows at list — no discount required.
- To meet the 1% rule (rent ≥ 1% of price), the offer needs to be $93k (6.3% below list).
- Recommended offer: $93k (6.3% below list) — sets the bar for 1% rule.
- Cap rate 8.1% vs local median 5.6% in DeQuincy — top-decile yield for the area; either an underpriced asset or a hidden risk that comps aren't pricing in. Stress-test before assuming the spread holds.
Location & tenants
- Location reads 71/100 on livability (#51 in LA) — a middle-class / working-renter tenant base. Strengths: cost of living A+, housing A+, health & safety A; Watch: amenities F, commute F.
- Calcasieu Parish (other): math 30% / reading 44% proficiency, ranked #29 of 98 in LA (top 30%) — families likely to look elsewhere, expect single-tenant / working-renter base with shorter leases.
- Market conditions: 108 active listings in the ZIP; 1,298 units permitted in Calcasieu Parish in 2024 (526 in 5+ unit buildings).
Forward outlook
- Local home prices are declining (-3.0%/yr); year-one equity from $684 of loan paydown is wiped out by about $3k of value loss. Plan a longer hold.
- Calcasieu County population projected at +11% by 2050 — modest demand growth; plan on rents tracking national, not racing it.
Negotiation context
- It's been on market 72 days — a 6% lower offer ($93k) is reasonable based on typical stale-listing flexibility.
- 2 sale attempts since 13y ago with the ask held roughly flat each time — persistent listings suggest the price (not the market) is what's stuck; bring a comps-based counter.
- Current owner paid $55k; list at $99k implies a 80% gain — meaningful room to come down on a strong offer.
Risks & watch-outs
- Climate carrying-cost: severe wind risk, 99% chance of damaging wind over 30y; moderate wildfire risk; extreme-heat days projected 7→24/yr by 2055 (HVAC capex compounding) — expect insurance premiums to compound above CPI over the hold.
Questions for the listing agent
- It's been on market 72 days. Have you received any prior offers? Is the seller open to a 6% concession, seller financing, or rate buy-down credit?
- Built in 1963 — when were the roof, HVAC, electrical panel, plumbing, and water heater last replaced?
- Why hasn't it sold? Are there any deal-killer items the seller is aware of (foundation, flood, title, zoning, code violations)?
- Is there a deadline driving the sale (1031 exchange, divorce, estate, relocation)? That informs how much negotiation room exists.
- Schools are B-rated — typically a magnet for longer-tenancy family renters. What's the average tenant stay here, and is there a school-zone premium baked into asking?
- What's the average days-on-market for RENTAL listings here right now (not sales)? A rising rental-DOM trend means longer vacancies and softer asking-rent achievability than the comps imply.
- What's the recent tenant-quality profile in this submarket — average credit score on applications, eviction rate, late-payment / NSF rate, and stable-employment percentage? A property-management company in the area should have these aggregated.
- How much new for-sale + rental construction is in the pipeline within 1–3 miles? Heavy new supply typically softens prices + rents 12–24 months out; constrained supply supports both.
Investment metrics
- 1% rule
- 0.94% ✗
- Cap rate
- 8.14%
- Cash-on-cash
- 6.59%
- DSCR
- 1.29
- GRM
- 8.9
CMA / ARV
- ARV (median comp)
- $106,901
- List price
- $99,000
- Delta
- -7.39%
- Verdict
- FAIR
- Comps
- 16 within 1.0 mi
Show comp detail 4 sales within ~0.75 mi
| Address | Dist | Beds/Ba | Sqft | Sold | Price | $/sf | Match |
|---|---|---|---|---|---|---|---|
| 309 S Perkins St S | 0.08mi | 2/1.0 | 1,036 (+3%) | 14mo | $97,500 | $94 | 80 |
| 306 Coffee St | 0.19mi | 2/1.0 | 1,139 (+13%) | 2mo | $100,000 | $88 | 68 |
| 320 N Frazier St | 0.51mi | 3/1.0 (+1) | 920 (-9%) | 5mo | $120,000 | $130 | 52 |
| 306 N Green St N | 0.43mi | 3/2.0 (+1) | 1,036 (+3%) | 23mo | $115,000 | $111 | 47 |
Match score weights: distance 35% · size 25% · config 20% · recency 20%. Top-matched comps best support the ARV.
Projected returns pro-forma
-3.0% appreciation · 3.0% rent growth · sell at horizon
- IRR
- -6.2%
- Equity multiple
- 0.77×
- Total profit
- $-6,398
- Equity at exit
- $14,761
- IRR
- 3.4%
- Equity multiple
- 1.24×
- Total profit
- $6,709
- Equity at exit
- $8,560
Cash invested: $27,720 (down + closing). Projections, not guarantees.
Landlord ↔ Tenant lean methodology
- Overall (STATE)
- 90 Strongly Landlord-Friendly
- State Louisiana
- 90 Strongly Landlord-Friendly · R+12
- County
- — inherits STATE
- City
- — inherits STATE
ZIP-level market 70633
- Active inventory
- 108
- Price-to-rent
- 8.9×
Monthly cashflow live
- Estimated rent
- $927 medium interval (Pro) →
- Mortgage (P&I)
- −$519
- Tax from tax record
- −$20 /mo · $238/yr
- Insurance
- −$41
- HOA
- −$0
- Vacancy / Maint / Mgmt
- −$195
- Net cashflow
- $152
Break-even live
Sensitivity live
| Price | -10% $208 | -5% $180 | +0% $152 | +5% $124 | +10% $96 |
|---|---|---|---|---|---|
| Rent | -10% $79 | -5% $116 | +0% $152 | +5% $189 | +10% $225 |
| Rate | -1.0pp $202 | -0.5pp $177 | base $152 | +0.5pp $127 | +1.0pp $100 |
UW: 25.0% down · 7.5% · 30yr · 1.5% tax · 5.0% vac · 8.0% maint · 8.0% mgmt
Financing live
Cash to close
- Down payment
- $24,750
- Closing costs
- $2,970
- Reserves months
- —
- Total cash needed
- —
Loan-product check · same deal, 3 products live
Conventional
25% down · 7.5% · 30yr
- Down + closing
- —
- Monthly P&I
- —
- Monthly cashflow
- —
- DSCR
- —
- Eligible?
- —
Personal DTI + credit; lowest rate.
DSCR
20% down · 8.5% · 30yr
- Down + closing
- —
- Monthly P&I
- —
- Monthly cashflow
- —
- DSCR
- —
- Eligible?
- —
No personal income docs; deal must DSCR.
Hard money
10% down · 12.0% · 12mo
- Down + closing
- —
- Monthly P&I
- —
- Monthly cashflow
- —
- DSCR
- —
- Eligible?
- —
Short-term bridge; refi at stabilization.
Listing history 21 events
-
2026-06-19days on market $99,000 Active 72 DOM
-
2026-06-18days on market $99,000 Active 71 DOM
-
2026-06-17days on market $99,000 Active 70 DOM
-
2026-06-16days on market $99,000 Active 69 DOM
-
2026-06-15days on market $99,000 Active 68 DOM
-
2026-06-14days on market $99,000 Active 66 DOM
-
2026-06-13days on market $99,000 Active 65 DOM
-
2026-06-10days on market $99,000 Active 63 DOM
-
2026-06-09days on market $99,000 Active 62 DOM
-
2026-06-08days on market $99,000 Active 61 DOM
-
2026-06-07days on market $99,000 Active 60 DOM
-
2026-06-05days on market $99,000 Active 57 DOM
-
2026-06-02days on market $99,000 Active 55 DOM
-
2026-06-01days on market $99,000 Active 54 DOM
-
2026-05-31days on market $99,000 Active 53 DOM
-
2026-05-30days on market $99,000 Active 52 DOM
-
2025-10-02$99,000 Active 529-char remark
Show marketing remark (529 chars)
Welcome home to this charming cottage in DeQuincy! With 2 bedrooms and 1 bathroom, this sweet corner-lot home is full of character. You’ll love the warmth of the real hardwood floors flowing throughout, giving the whole space a cozy, inviting feel. The fenced backyard is the perfect place to unwind—complete with a covered patio for relaxing afternoons and a workshop ready for hobbies, projects, or extra storage. This cottage is a perfect blend of charm and comfort, just waiting for its new owner to make it home.
-
2022-08-09soldstatus
-
2013-12-12soldstatus $55,000
-
2013-07-22$57,000
-
2004-07-06soldstatus $36,500
ⓘ Source: listings_history table (triggers on properties + properties_extension) + one-shot
backfill from property_details.listing_events for pre-trigger history.
Tax reassessment forecast LA · Resets to sale price
- Current annual tax
- $238 · $20/mo
- Projected year-2 tax
- $544 · $45/mo
- Expected delta
- +$306/yr (+$26/mo · 128.5%)
ⓘ Screening estimate from a state-policy table — verify with the county assessor before closing.
Climate risk First Street
- Flood 1/10 Low FEMA zone X (unshaded) · 0% chance over 30 yrs
- Wildfire 5/10 Major
- Heat 9/10 Extreme 7 d/yr ≥110°F today · 24 d/yr by 30 yrs out
- Wind 9/10 Extreme 99% chance of damaging wind over 30 yrs
- Air quality 2/10 Low 1 unhealthy d/yr today · 1 by 30 yrs out
Nearby sold comps map
Loading sold comps map…
Walkable amenities ~0.75 mi
Loading nearby amenities…
Taxation est. · year 1
- Rental income
- $11,126
- − Mortgage interest
- −$5,546
- − Property taxes
- −$238
- − Insurance
- −$495
- − Repairs & maintenance
- −$890
- − Management
- −$890
- − Depreciation
- −$2,880
- Taxable income
- $187
- Est. tax owed @ 24.0%
- −$45
- After-tax cash flow
- $1,782/yr
For passive investors: Depreciation is non-cash, so a rental often shows a tax loss while cash-flowing — sheltering income. Rental losses are passive: they offset passive income freely, and up to $25,000/yr can offset ordinary (W-2) income if you actively participate and your MAGI is under $100k (phasing out to $0 by $150k); unused losses carry forward. On sale, claimed depreciation is recaptured at up to 25%, and gains may owe capital-gains tax (a 1031 exchange can defer both). Figures are a year-1 estimate at your 24.0% rate — not tax advice; consult a CPA.
Schools (NCES district)
- District
- Calcasieu Parish
- NCES district ID
- 2200330
- Math proficiency
- 30% ▼ -39.00%
- Reading proficiency
- 44% ▼ -33.00%
- Median HH income
- $44,700
- Composite
- 31.45/100
- National rank
- #5979
- State rank
- #29 of 98 in LA
Livability — DeQuincy
- Score
- 71/100
- State rank
- #51
- US rank
- #7288
Category grades
Schools grade is shown separately in the Schools card above.
Census & demographics
- Census place
- DeQuincy, LA
- Population (ZIP)
- 8,178
Population outlook (Calcasieu County) Hauer SSP2
- Today (2025)
- 212,179 people
- By 2030
- 218,199 · +2.8%
- By 2040
- 228,486 · +7.7%
- By 2050
- 236,208 · +11.3%
- By 2075
- 251,696 · +18.6%
- By 2100
- 247,848 · +16.8%
Race, ethnicity, and origin ACS 2023
- Neighborhood character
- Predominantly White (82%)
- Race & ethnicity
- White 82% Black 9% Two or more races 8% Hispanic / Latino 4%
- Common ancestry
- Lithuanian 6% Italian 2% Iranian 2%
- Foreign-born
- 1%
- Languages at home
- 98% English-only · Spanish 1% French/Haitian/Cajun 1%
Political lean MEDSL · Calcasieu
- 2024 margin
- Solid R (+39.6) · D 29.5% · R 69.0% · Other 1.5%
- 2008→2024 swing
- -15.0pp toward R · 2008: -24.6pp · 2024: -39.6pp
- All cycles
- 2024: R+39.6 2020: R+35.2 2016: R+33.3 2012: R+28.7 2008: R+24.6
Not yet ingested
- Civics
- —
Market trends
- HPI YoY
- ▼ -68.41%
- Current HPI
- 90.4407
- Rent YoY
- —
- Metro
- —
- State GDP YoY
- ▲ 3.29%
- F500 in state
- 10
Industry mix (Fortune 500 HQ in LA)
| Industry | F500 HQs | Revenue |
|---|---|---|
| Telecommunications | 2 | $23B |
|
||
| Utilities | 1 | $12B |
|
||
| Wholesale / Distribution | 1 | $5B |
|
||
| Advertising | 1 | $2B |
|
||
Price history
+171.2% since first listed5 events — show timeline
- 2025-10-02 Listed $99,000 SWLAR
- 2022-08-09 Sold (MLS) — GFPAR
- 2013-12-12 Sold (Public Records) $55,000 Public Records
- 2013-07-22 Listed $57,000 GFPAR
- 2004-07-06 Sold (Public Records) $36,500 Public Records
Property tax history
+1.2%/yrLatest (2025): $238 · +1.5% YoY. Source: county tax records.
Cash-flow waterfall
monthlySold comps — $/sqft
last 12 mo · ≤1 miLoading sold comps…