122 Hornet St · Elgin, TX
Flood risk No data
- FEMA flood zone
- —
- Chance of flooding over 30 yrs
- —
- Est. flood insurance / yr
- —
Fire risk No data
- Est. fire insurance / yr
- —
Heat risk No data
- Hot days now (above threshold)
- —
- Hot days in 30 yrs
- —
Wind risk No data
- Chance of severe wind over 30 yrs
- —
Air-quality risk No data
- Unhealthy air days now
- —
- Unhealthy air days in 30 yrs
- —
Risk factors via First Street. Map © Google.
Why this score? — see what drove the D+ grade
The composite is a weighted blend of 9 inputs, each scored 0–100. Each bar is that input's sub-score; the figure is the points it added to the 100-point composite (weight × sub-score).
- Cash flow +11.7/30.0
- Appreciation +10.0/10.0
- ARV discount +6.1/15.0
- Livability +3.7/5.0
- DSCR +3.4/10.0
- Rent growth +3.3/5.0
- 1% rule +2.6/10.0
- Condition / age +2.5/5.0
- Schools +2.0/10.0
$329,990
🖨 Deal sheet (PDF) 📄 Offer letter ✓ Due diligence
Listing remarks MLS
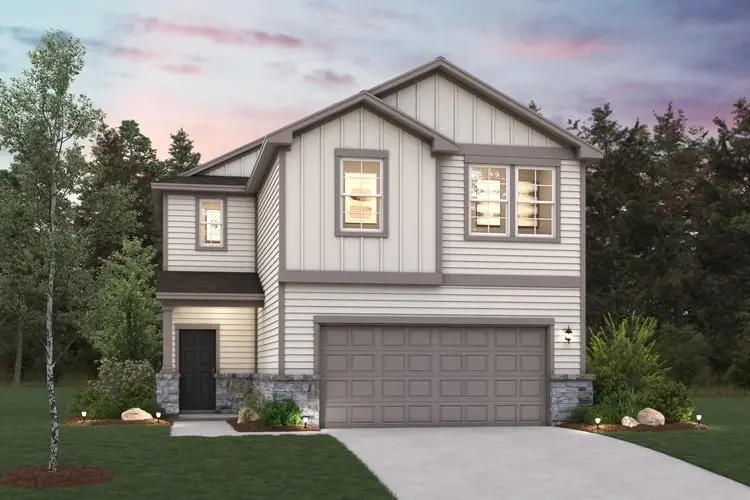
The Jade plan is a true gem! On the main floor, an open kitchen with a walk-in pantry and a center island overlooks a dining area and a spacious, sunlit great room. The primary suite is conveniently located on this level, offering a walk-in closet and a private bath. Upstairs, you'll find three roomy bedrooms-two with walk-in closets-and a versatile loft space waiting to be transformed for your needs. Options include: Covered patio off the great room Electric fireplace in the great room
Key facts
- Walk-in closet
- Dining area
- Open kitchen
Tags
Neighborhood map
What this means for you Summary
Snapshot
- This is a 4-bed/2.5-bath land listed at $330k.
Deal economics
- At list price, monthly cash flow is $-98 ($-1k/yr) — negative.
- To cash-flow at today's rent, offer at most $313k (5.2% below list).
- To meet the 1% rule (rent ≥ 1% of price), the offer needs to be $252k (23.8% below list).
- Recommended offer: $252k (23.8% below list) — sets the bar for 1% rule.
- Cap rate 5.9% vs local median 4.4% in Elgin — top-decile yield for the area; either an underpriced asset or a hidden risk that comps aren't pricing in. Stress-test before assuming the spread holds.
Location & tenants
- Location reads 74/100 on livability (#167 in TX, #4,404 nationally) — a middle-class / working-renter tenant base. Strengths: cost of living A+, housing A+, health & safety A+; Watch: amenities F, commute F.
- Elgin ISD (rural): math 17% / reading 26% proficiency, ranked #741 of 826 in TX (top 90%) — low school quality limits family demand, transient renter base, plan for 1-2y turnover; 67% free/reduced lunch — lower-income household profile, screen leases tightly.
- Zoned schools: Elgin El (math 8% / reading 17%, grade F, #4,180 of 4,322 statewide, top 97%, 847 students, 84% FRL); Elgin Middle (math 22% / reading 24%, grade F, #1,327 of 1,662 statewide, top 81%, 780 students, 82% FRL); Elgin H S (math 12% / reading 37%, grade F, #1,264 of 1,632 statewide, top 82%, 1,672 students, 74% FRL).
- Market conditions: Rents rising (+3.1%/yr); 814 active listings in the ZIP; 7 comparable units currently listed for rent nearby; rentals at typical pace (median 26d on market — plan ~3-4 weeks tenant-placement turnaround); solid renter incomes; 1,841 units permitted in Bastrop County in 2024 (150 in 5+ unit buildings).
- This rent runs 31% of the median local income ($99k/yr) — at the standard rent-burdened threshold; future hikes will face affordability resistance.
Forward outlook
- In year one you build about $35k of equity ($2k loan paydown + $33k appreciation (10.0% local appreciation)).
- Bastrop County population projected at +37% by 2050 — long-run rental-demand tailwind backs the buy-and-hold thesis.
- By year 2, paydown + projected appreciation supports a ~$57k cash-out refi (75% LTV) — recoverable capital for the next deal without selling this one.
Negotiation context
- It's been on market 127 days — a 12% lower offer ($290k) is reasonable based on typical stale-listing flexibility.
- 2 sale attempts with the ask held roughly flat each time — persistent listings suggest the price (not the market) is what's stuck; bring a comps-based counter.
Questions for the listing agent
- What do current leases actually rent for vs. the listed asking? Can we see a recent rent roll and the last 12 months of T-12 income?
- It's been on market 127 days. Have you received any prior offers? Is the seller open to a 24% concession, seller financing, or rate buy-down credit?
- What does the HOA fee cover, when was the last increase, and are there any pending special assessments or reserve-fund shortfalls?
- Why hasn't it sold? Are there any deal-killer items the seller is aware of (foundation, flood, title, zoning, code violations)?
- Is there a deadline driving the sale (1031 exchange, divorce, estate, relocation)? That informs how much negotiation room exists.
- Schools are F-rated, which usually means shorter tenancies and higher turnover. Who's the typical renter profile here, and what's been the actual vacancy rate?
- The area grade is low — what's the realistic commute time and amenity access for the typical tenant pool here? Any planned neighborhood developments (good or bad) we should know about?
- What's the average days-on-market for RENTAL listings here right now (not sales)? A rising rental-DOM trend means longer vacancies and softer asking-rent achievability than the comps imply.
- What's the recent tenant-quality profile in this submarket — average credit score on applications, eviction rate, late-payment / NSF rate, and stable-employment percentage? A property-management company in the area should have these aggregated.
- How much new for-sale + rental construction is in the pipeline within 1–3 miles? Heavy new supply typically softens prices + rents 12–24 months out; constrained supply supports both.
Investment metrics
- 1% rule
- 0.76% ✗
- Cap rate
- 5.94%
- Cash-on-cash
- -1.27%
- DSCR
- 0.94
- GRM
- 10.9
CMA / ARV
- ARV (median comp)
- $320,336
- List price
- $329,990
- Delta
- 3.01%
- Verdict
- FAIR
- Comps
- 20 within 1.0 mi
Projected returns pro-forma
10.0% appreciation · 3.12% rent growth · sell at horizon
- IRR
- 23.4%
- Equity multiple
- 2.88×
- Total profit
- $173,705
- Equity at exit
- $297,281
- IRR
- 20.9%
- Equity multiple
- 6.59×
- Total profit
- $516,894
- Equity at exit
- $641,098
Cash invested: $92,397 (down + closing). Projections, not guarantees.
Landlord ↔ Tenant lean methodology
- Overall (STATE)
- 87 Strongly Landlord-Friendly
- State Texas
- 87 Strongly Landlord-Friendly · R+5
- County
- — inherits STATE
- City
- — inherits STATE
ZIP-level market 78621
- Home prices YoY
- 7.6%
- Rents YoY
- 3.1%
- Active inventory
- 814
- Price-to-rent
- 10.9×
Monthly cashflow live
- Estimated rent
- $2,515 high interval (Pro) →
- Mortgage (P&I)
- −$1,731
- Tax from tax record
- −$165 /mo · $1,978/yr
- Insurance
- −$137
- HOA
- −$52
- Vacancy / Maint / Mgmt
- −$528
- Net cashflow
- $-98
Break-even live
Sensitivity live
| Price | -10% $89 | -5% $-5 | +0% $-98 | +5% $-191 | +10% $-285 |
|---|---|---|---|---|---|
| Rent | -10% $-297 | -5% $-197 | +0% $-98 | +5% $1 | +10% $101 |
| Rate | -1.0pp $68 | -0.5pp $-14 | base $-98 | +0.5pp $-183 | +1.0pp $-270 |
UW: 25.0% down · 7.5% · 30yr · 1.5% tax · 5.0% vac · 8.0% maint · 8.0% mgmt
Financing live
Cash to close
- Down payment
- $82,498
- Closing costs
- $9,900
- Reserves months
- —
- Total cash needed
- —
Loan-product check · same deal, 3 products live
Conventional
25% down · 7.5% · 30yr
- Down + closing
- —
- Monthly P&I
- —
- Monthly cashflow
- —
- DSCR
- —
- Eligible?
- —
Personal DTI + credit; lowest rate.
DSCR
20% down · 8.5% · 30yr
- Down + closing
- —
- Monthly P&I
- —
- Monthly cashflow
- —
- DSCR
- —
- Eligible?
- —
No personal income docs; deal must DSCR.
Hard money
10% down · 12.0% · 12mo
- Down + closing
- —
- Monthly P&I
- —
- Monthly cashflow
- —
- DSCR
- —
- Eligible?
- —
Short-term bridge; refi at stabilization.
Rent comps 7 comps
| Address | Beds | Baths | Sqft | Rent | $/sqft | DOM | Units | Dist |
|---|---|---|---|---|---|---|---|---|
| 174 Gullivers Dr Elgin, TX | 4.0 | 2.5 | 2304 | $2,850 | $1.24 | 45d | 1 | 0.24mi |
| 126 Bendecido Loop Elgin, TX | 4.0 | 2.5 | 2697 | $2,250 | $0.83 | 25d | 1 | 0.38mi |
| 813 Central Ave Elgin, TX | 4.0 | 2.0 | 2025 | $2,300 | $1.14 | 6d | 1 | 0.45mi |
| 209 Lake Placid Run Elgin, TX | 5.0 | 3.0 | 2196 | $2,200 | $1.00 | 25d | 1 | 0.73mi |
| 120 Jim Dandy Dr Elgin, TX | 4.0 | 2.0 | 1650 | $1,923 | $1.17 | 6d | 1 | 0.74mi |
| 212 Lake Placid Run Elgin, TX | 3.0 | 2.5 | 1681 | $1,895 | $1.13 | 0d | 1 | 0.76mi |
| 710 North Avenue C Unit C Elgin, TX | 4.0 | 2.5 | 3050 | $2,000 | $0.66 | 45d | 1 | 1.05mi |
HOA detail
- Monthly dues
- $52 · $624/yr
- Likely covers
- electric
Listing history 7 events
-
2026-06-02statusdays on market $329,990 Pending 127 DOM
-
2026-06-01days on market $329,990 Active 126 DOM
-
2026-05-31days on market $329,990 Active 125 DOM
-
2026-04-24price $329,300 491-char remark
Show marketing remark (579 chars)
MLS# 2781481 - Built by Century Communities - May 2026 completion! ~ The Jade plan is a true gem! On the main floor, an open kitchen with a walk-in pantry and a center island overlooks a dining area and a spacious, sunlit great room. The primary suite is conveniently located on this level, offering a walk-in closet and a private bath. Upstairs, you’ll find three roomy bedrooms—two with walk-in closets—and a versatile loft space waiting to be transformed for your needs. Options include: Covered patio off the great room Electric fireplace in the great room
-
2026-04-24price $329,300 579-char remark
Show marketing remark (579 chars)
MLS# 2781481 - Built by Century Communities - May 2026 completion! ~ The Jade plan is a true gem! On the main floor, an open kitchen with a walk-in pantry and a center island overlooks a dining area and a spacious, sunlit great room. The primary suite is conveniently located on this level, offering a walk-in closet and a private bath. Upstairs, you’ll find three roomy bedrooms—two with walk-in closets—and a versatile loft space waiting to be transformed for your needs. Options include: Covered patio off the great room Electric fireplace in the great room
-
2026-01-26$334,300 Active 579-char remark
Show marketing remark (579 chars)
MLS# 2781481 - Built by Century Communities - May 2026 completion! ~ The Jade plan is a true gem! On the main floor, an open kitchen with a walk-in pantry and a center island overlooks a dining area and a spacious, sunlit great room. The primary suite is conveniently located on this level, offering a walk-in closet and a private bath. Upstairs, you’ll find three roomy bedrooms—two with walk-in closets—and a versatile loft space waiting to be transformed for your needs. Options include: Covered patio off the great room Electric fireplace in the great room
-
2026-01-24$334,300 Active 491-char remark
Show marketing remark (491 chars)
The Jade plan is a true gem! On the main floor, an open kitchen with a walk-in pantry and a center island overlooks a dining area and a spacious, sunlit great room. The primary suite is conveniently located on this level, offering a walk-in closet and a private bath. Upstairs, you'll find three roomy bedrooms-two with walk-in closets-and a versatile loft space waiting to be transformed for your needs. Options include: Covered patio off the great room Electric fireplace in the great room
ⓘ Source: listings_history table (triggers on properties + properties_extension) + one-shot
backfill from property_details.listing_events for pre-trigger history.
Tax reassessment forecast TX · Resets to sale price
- Current annual tax
- $1,978 · $165/mo
- Projected year-2 tax
- $6,039 · $503/mo
- Expected delta
- +$4,060/yr (+$338/mo · 205.2%)
ⓘ Screening estimate from a state-policy table — verify with the county assessor before closing.
Nearby sold comps map
Loading sold comps map…
Walkable amenities ~0.75 mi
Loading nearby amenities…
Taxation est. · year 1
- Rental income
- $30,181
- − Mortgage interest
- −$18,485
- − Property taxes
- −$1,978
- − Insurance
- −$1,650
- − Repairs & maintenance
- −$2,414
- − Management
- −$2,414
- − HOA
- −$624
- − Depreciation
- −$9,600
- Taxable loss
- −$6,985
- Est. tax savings @ 24.0%
- +$1,676
- After-tax cash flow
- $501/yr
For passive investors: Depreciation is non-cash, so a rental often shows a tax loss while cash-flowing — sheltering income. Rental losses are passive: they offset passive income freely, and up to $25,000/yr can offset ordinary (W-2) income if you actively participate and your MAGI is under $100k (phasing out to $0 by $150k); unused losses carry forward. On sale, claimed depreciation is recaptured at up to 25%, and gains may owe capital-gains tax (a 1031 exchange can defer both). Figures are a year-1 estimate at your 24.0% rate — not tax advice; consult a CPA.
Schools (NCES district)
- District
- Elgin ISD
- NCES district ID
- 4818360
- Math proficiency
- 17% ▼ -9.00%
- Reading proficiency
- 26% ▼ -5.00%
- Median HH income
- $55,176
- Composite
- 19.62/100
- National rank
- #8749
- State rank
- #741 of 826 in TX
Livability — Elgin
- Score
- 74/100
- State rank
- #167
- US rank
- #4404
Category grades
Schools grade is shown separately in the Schools card above.
Census & demographics
- County
- Bastrop County · 68,601 people
- City population
- 27,860
- Metro
- Austin-Round Rock-Georgetown, TX
- Population (ZIP)
- 30,411
- Household income
- $98,534
- Rent vs Own
- Severe rent burden
- 235.0
Population outlook (Bastrop County) Hauer SSP2
- Today (2025)
- 94,260 people
- By 2030
- 101,355 · +7.5%
- By 2040
- 115,578 · +22.6%
- By 2050
- 129,464 · +37.3%
- By 2075
- 168,068 · +78.3%
- By 2100
- 194,857 · +106.7%
Race, ethnicity, and origin ACS 2023
- Neighborhood character
- Diverse neighborhood (Simpson 0.64)
- Race & ethnicity
- Hispanic / Latino 46% White 38% Two or more races 19% Black 11% Native American 1%
- Hispanic origin (detail)
- Mexican 38%
- Common ancestry
- Slovak 2% Italian 2% Romanian 1%
- Foreign-born
- 17% · Canada, Vietnam
- Languages at home
- 63% English-only · Spanish 36%
Political lean MEDSL · Bastrop
- 2024 margin
- R (+18.4) · D 40.2% · R 58.6% · Other 1.2%
- 2008→2024 swing
- -10.2pp toward R · 2008: -8.2pp · 2024: -18.4pp
- All cycles
- 2024: R+18.4 2020: R+13.8 2016: R+20.4 2012: R+17.0 2008: R+8.2
Not yet ingested
- Civics
- —
Market trends
- HPI YoY
- ▲ 29.47%
- Current HPI
- 416.87
- Rent YoY
- ▲ 3.12%
- Metro
- Austin-Round Rock-Georgetown, TX
- State GDP YoY
- ▲ 3.95%
- F500 in state
- 110
Industry mix (Fortune 500 HQ in TX)
| Industry | F500 HQs | Revenue |
|---|---|---|
| Energy | 16 | $1,198B |
|
||
| Technology | 5 | $198B |
|
||
| Engineering / Construction | 4 | $72B |
|
||
| Energy Services | 3 | $60B |
|
||
| Utilities | 3 | $41B |
|
||
| Healthcare | 2 | $330B |
|
||
Price history
-1.5% since first listed4 events — show timeline
- 2026-04-24 Price Changed $329,300 Zillow
- 2026-04-24 Price Changed $329,300 Unlock MLS
- 2026-01-26 Listed $334,300 Unlock MLS
- 2026-01-24 Listed $334,300 Zillow
Property tax history
+4.6%/yrLatest (2025): $1,978 · +4.6% YoY. Source: county tax records.
Cash-flow waterfall
monthlySold comps — $/sqft
last 12 mo · ≤1 miLoading sold comps…