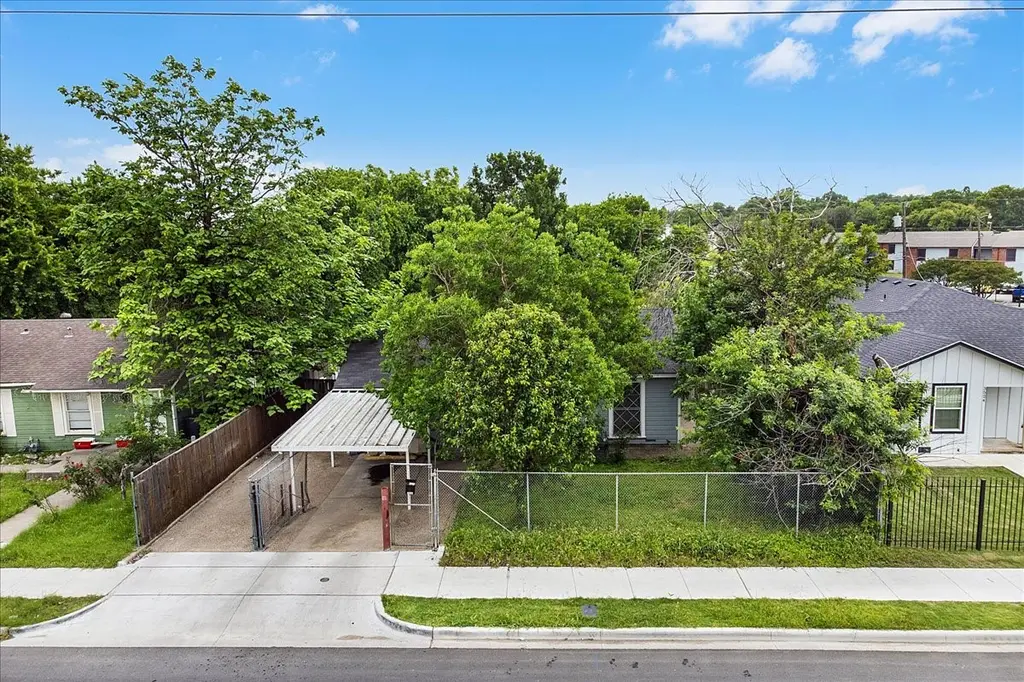
3520 Bagby Ave · Waco, TX
Flood risk 1/10 · Minimal
- FEMA flood zone
- X (unshaded)
- Chance of flooding over 30 yrs
- 0.0%
- Est. flood insurance / yr
- $507 – $1,088
Fire risk 1/10 · Minimal
- Est. fire insurance / yr
- $1,222 – $2,270
Heat risk 7/10 · Major
- Hot days now (above 108°F)
- 7 days/yr
- Hot days in 30 yrs
- 23 days/yr
Wind risk 6/10 · Moderate
- Chance of severe wind over 30 yrs
- 61.0%
Air-quality risk 1/10 · Minimal
- Unhealthy air days now
- 0 days/yr
- Unhealthy air days in 30 yrs
- 0 days/yr
Risk factors via First Street. Map © Google.
Why this score? — see what drove the D grade
The composite is a weighted blend of 9 inputs, each scored 0–100. Each bar is that input's sub-score; the figure is the points it added to the 100-point composite (weight × sub-score).
- Cash flow +9.9/30.0
- Appreciation +6.8/10.0
- ARV discount +6.0/15.0
- 1% rule +3.8/10.0
- Livability +3.7/5.0
- Rent growth +3.2/5.0
- DSCR +2.8/10.0
- Condition / age +2.5/5.0
- Schools +1.8/10.0
$149,900
🖨 Deal sheet 📄 Offer letter ✓ Due diligence
Listing remarks
Located in a convenient Waco area, this residential property at 3520 Bagby Ave offers a desirable setting with proximity to local amenities, schools, major roadways, and community services. The property provides an opportunity for a variety of residential uses, subject to buyer verification and intended plans. All property information, including measurements, condition, improvements, zoning, and restrictions, should be independently verified by the buyer and or buyer’s agent. Seller and listing broker make no representations or warranties regarding the accuracy of any information provided. This property is being marketed as-is unless otherwise stated. Buyers are encouraged to conduct
Key facts
- Proximity to schools
- 8,102 sq ft lot
- Built 1952
Tags
Property features AI
Finance
- Other: County: McLennan; Country: United States
- Financial info: Treat as clear loan type; No second mortgage
- HOA & community: No association
Exterior
- Parking: No covered or carport spaces listed; Other parking features
- Utilities: City sewer; No municipal utility district
- Home design: Single family residence; Residential property; Built in 1952; Not attached to another property
- Construction: Year built 1952
- Exterior features: Lot under 0.5 acre (about 0.186 acres); Subdivision: Valley View
Interior
- Kitchen: Kitchen (approximately 9 x 13); Appliances: Other
- Bedrooms: 2 bedrooms (both on main level); Primary bedroom approximately 12 x 12
- Bathrooms: 1 full bathroom (primary bath approximately 6 x 7)
- Interior features: One level living; 8 total rooms; 2 living areas; Dining room
- Laundry & utility: Extra storage room (approximately 10 x 14)
Neighborhood map
What this means for you Summary
Snapshot
- This is a 2-bed/1.0-bath single-family listed at $150k.
Deal economics
- At list price, monthly cash flow is $-93 ($-1k/yr) — negative.
- To cash-flow at today's rent, offer at most $133k (11.0% below list).
- To meet the 1% rule (rent ≥ 1% of price), the offer needs to be $131k (12.4% below list).
- Recommended offer: $131k (12.4% below list) — sets the bar for 1% rule.
- Cap rate 5.5% vs local median 3.9% in Waco — top-decile yield for the area; either an underpriced asset or a hidden risk that comps aren't pricing in. Stress-test before assuming the spread holds.
Location & tenants
- Location reads 74/100 on livability (#166 in TX, #4,378 nationally) — a middle-class / working-renter tenant base. Strengths: cost of living A+, housing A+, health & safety A+; Watch: crime D, commute F, employment D-.
- Waco ISD (urban): math 20% / reading 24% proficiency, ranked #773 of 826 in TX (top 94%) — low school quality limits family demand, transient renter base, plan for 1-2y turnover; 81% free/reduced lunch — lower-income household profile, screen leases tightly.
- Zoned schools: Alta Vista El (math 12% / reading 12%, grade F, #4,207 of 4,322 statewide, top 98%, 545 students, 89% FRL, charter).
- Market conditions: Rents rising (+2.6%/yr); 43 active listings in the ZIP; 19 comparable units currently listed for rent nearby; rentals leasing fast (median 14d on market — plan ~1-2 weeks tenant-placement turnaround); 1,014 units permitted in McLennan County in 2024 (200 in 5+ unit buildings).
Forward outlook
- In year one you build about $6k of equity ($1k loan paydown + $5k appreciation (3.6% local appreciation)).
- McLennan County population projected at +17% by 2050 — long-run rental-demand tailwind backs the buy-and-hold thesis.
- By year 6, paydown + projected appreciation supports a ~$34k cash-out refi (75% LTV) — recoverable capital for the next deal without selling this one.
Negotiation context
- It's been on market 17 days — a 2% lower offer ($148k) is reasonable based on typical stale-listing flexibility.
- 8 sale attempts since 6y ago with the ask held roughly flat each time — persistent listings suggest the price (not the market) is what's stuck; bring a comps-based counter.
Risks & watch-outs
- Watch-outs: built in 1952 — expect roof / HVAC / electrical / plumbing capex.
- Climate carrying-cost: major wind risk, 61% chance of damaging wind over 30y; extreme-heat days projected 7→23/yr by 2055 (HVAC capex compounding) — expect insurance premiums to compound above CPI over the hold.
Questions for the listing agent
- What do current leases actually rent for vs. the listed asking? Can we see a recent rent roll and the last 12 months of T-12 income?
- Built in 1952 — when were the roof, HVAC, electrical panel, plumbing, and water heater last replaced?
- Is there a deadline driving the sale (1031 exchange, divorce, estate, relocation)? That informs how much negotiation room exists.
- Schools are D-rated, which usually means shorter tenancies and higher turnover. Who's the typical renter profile here, and what's been the actual vacancy rate?
- Crime grade is D in this area — have there been break-ins, vandalism, or insurance claims at this property in the last 3 years? What carrier currently insures it and at what premium?
- The area grade is low — what's the realistic commute time and amenity access for the typical tenant pool here? Any planned neighborhood developments (good or bad) we should know about?
- What's the average days-on-market for RENTAL listings here right now (not sales)? A rising rental-DOM trend means longer vacancies and softer asking-rent achievability than the comps imply.
- What's the recent tenant-quality profile in this submarket — average credit score on applications, eviction rate, late-payment / NSF rate, and stable-employment percentage? A property-management company in the area should have these aggregated.
- How much new for-sale + rental construction is in the pipeline within 1–3 miles? Heavy new supply typically softens prices + rents 12–24 months out; constrained supply supports both.
Investment metrics
- 1% rule
- 0.88% ✗
- Cap rate
- 5.55%
- Cash-on-cash
- -2.66%
- DSCR
- 0.88
- GRM
- 9.5
CMA / ARV
- ARV (on-the-fly)
- $145,188
- Comps found
- 12
Show comp detail 12 sales within ~0.75 mi
| Address | Dist | Beds/Ba | Sqft | Sold | Price | $/sf | Match |
|---|---|---|---|---|---|---|---|
| 3808 James Ave | 0.21mi | 3/1.0 (+1) | 1,008 (+3%) | 1mo | $199,900 | $198 | 80 |
| 1213 S 31st St | 0.51mi | 2/1.0 | 952 (-3%) | 2mo | $125,000 | $131 | 70 |
| 3524 Daughtrey Ave | 0.10mi | 2/1.0 | 840 (-14%) | 3mo | $172,000 | $205 | 69 |
| 3816 Charlton Ave | 0.30mi | 2/1.0 | 882 (-10%) | 4mo | $185,000 | $210 | 66 |
| 1704 Lexington St | 0.56mi | 2/1.0 | 940 (-4%) | 3mo | $99,900 | $106 | 64 |
| 4013 Shelby St | 0.59mi | 2/1.0 | 941 (-4%) | 2mo | $88,000 | $94 | 64 |
| 4009 James Ave | 0.42mi | 3/1.0 (+1) | 1,056 (+8%) | 1mo | $149,900 | $142 | 62 |
| 3621 Shelby Ave | 0.46mi | 2/1.0 | 888 (-10%) | 3mo | $59,900 | $67 | 60 |
| 2209 Lee St | 0.32mi | 3/2.0 (+1) | 1,050 (+7%) | 5mo | $169,900 | $162 | 60 |
| 3904 Memorial Dr | 0.56mi | 2/1.0 | 896 (-9%) | 3mo | $149,900 | $167 | 57 |
| 4013 James Ave | 0.43mi | 3/2.0 (+1) | 1,055 (+8%) | 5mo | $120,000 | $114 | 55 |
| 3901 Hiland Dr | 0.73mi | 3/2.0 (+1) | 1,115 (+14%) | 2mo | $165,000 | $148 | 32 |
Match score weights: distance 35% · size 25% · config 20% · recency 20%. Top-matched comps best support the ARV.
Projected returns pro-forma
3.57% appreciation · 2.62% rent growth · sell at horizon
- IRR
- 6.5%
- Equity multiple
- 1.39×
- Total profit
- $16,237
- Equity at exit
- $72,227
- IRR
- 9.0%
- Equity multiple
- 2.43×
- Total profit
- $60,072
- Equity at exit
- $115,218
Cash invested: $41,972 (down + closing). Projections, not guarantees.
Landlord ↔ Tenant lean methodology
- Overall (STATE)
- 87 Strongly Landlord-Friendly
- State Texas
- 87 Strongly Landlord-Friendly · R+5
- County
- — inherits STATE
- City
- — inherits STATE
ZIP-level market 76711
- Home prices YoY
- 1.4%
- Rents YoY
- 2.6%
- Active inventory
- 43
- Price-to-rent
- 9.5×
Monthly cashflow live
- Estimated rent
- $1,313 high interval (Pro) →
- Mortgage (P&I)
- −$786
- Tax from tax record
- −$282 /mo · $3,383/yr
- Insurance
- −$62
- HOA
- −$0
- Vacancy / Maint / Mgmt
- −$276
- Net cashflow
- $-93
Break-even live
UW: 25.0% down · 7.5% · 30yr · 1.5% tax · 5.0% vac · 8.0% maint · 8.0% mgmt
Financing live
Cash to close
- Down payment
- $37,475
- Closing costs
- $4,497
- Reserves months
- —
- Total cash needed
- —
Loan-product check · same deal, 3 products live
Conventional
25% down · 7.5% · 30yr
- Down + closing
- —
- Monthly P&I
- —
- Monthly cashflow
- —
- DSCR
- —
- Eligible?
- —
Personal DTI + credit; lowest rate.
DSCR
20% down · 8.5% · 30yr
- Down + closing
- —
- Monthly P&I
- —
- Monthly cashflow
- —
- DSCR
- —
- Eligible?
- —
No personal income docs; deal must DSCR.
Hard money
10% down · 12.0% · 12mo
- Down + closing
- —
- Monthly P&I
- —
- Monthly cashflow
- —
- DSCR
- —
- Eligible?
- —
Short-term bridge; refi at stabilization.
Rent comps 19 comps
| Address | Beds | Baths | Sqft | Rent | $/sqft | DOM | Units | Dist |
|---|---|---|---|---|---|---|---|---|
| 3717 Charlton Ave Waco, TX | 2.0 | 1.0 | 870 | $1,195 | $1.37 | 44d | 1 | 0.27mi |
| 4009 James Ave Waco, TX | 3.0 | 1.0 | 1056 | $1,495 | $1.42 | 21d | 1 | 0.40mi |
| 3200 Belmont Dr Unit 3228 Waco, TX | 2.0 | 2.0 | 995 | $1,500 | $1.51 | 13d | 1 | 0.45mi |
| 3812 Hiland Dr Waco, TX | 3.0 | 1.0 | 1124 | $995 | $0.89 | 13d | 1 | 0.67mi |
| 700 S Valley Mills Dr Waco, TX | 1.0–2.0 | 1.0–1.5 | 850 | $995 | $1.17 | 13d | 2 | 0.73mi |
| 3447 Pewitt Dr Waco, TX | 2.0 | 1.0 | 907 | $1,350 | $1.49 | 13d | 1 | 0.80mi |
| 4000 Acree St Waco, TX | 3.0 | 1.5 | 984 | $1,295 | $1.32 | 21d | 1 | 0.80mi |
| 3430 Pewitt Dr Waco, TX | 2.0 | 1.0 | 916 | $1,150 | $1.26 | 44d | 1 | 0.84mi |
| 3411 Pewitt Dr #3413 Waco, TX | 2.0 | 1.0 | 1000 | $1,350 | $1.35 | 21d | 1 | 0.90mi |
| 2201 Creekview Dr Waco, TX | 1.0–3.0 | 1.0–2.0 | 990 | $1,758 | $1.78 | 13d | 20 | 1.02mi |
| 3001 S New Rd Waco, TX | 1.0–3.0 | 1.0–2.0 | 885 | $1,490 | $1.68 | 13d | 15 | 1.04mi |
| 4900 Bagby Ave Waco, TX | 3.0 | 1.0–2.0 | 1026 | $1,525 | $1.49 | 21d | 1 | 1.17mi |
| 700 S 24th St Unit 1 Waco, TX | 2.0 | 1.0 | 812 | $1,200 | $1.48 | 21d | 1 | 1.25mi |
| 5210 Bagby Ave Waco, TX | 1.0–3.0 | 1.0–2.0 | 1014 | $1,469 | $1.45 | 13d | 12 | 1.26mi |
| 3319 Wingate Dr Waco, TX | 2.0 | 1.0 | 768 | $950 | $1.24 | 21d | 1 | 1.33mi |
| 2100 S 19th St Waco, TX | 1.0 | 1.0 | 684 | $1,300 | $1.90 | 21d | 1 | 1.35mi |
| 2500 Marketplace Dr Waco, TX | 1.0–2.0 | 1.0–2.0 | 921 | $1,560 | $1.69 | 13d | 10 | 1.35mi |
| 1901 Dutton Ave Waco, TX | 2.0 | 1.0 | 864 | $1,400 | $1.62 | 13d | 1 | 1.40mi |
| 1800 Primrose Dr Waco, TX | 1.0–4.0 | 1.0–2.0 | 942 | $992 | $1.05 | 13d | 33 | 1.42mi |
Listing history 28 events
-
2026-06-18days on market $149,900 Active 17 DOM
-
2026-06-17days on market $149,900 Active 16 DOM
-
2026-06-16days on market $149,900 Active 15 DOM
-
2026-06-15days on market $149,900 Active 14 DOM
-
2026-06-14days on market $149,900 Active 12 DOM
-
2026-06-13days on market $149,900 Active 11 DOM
-
2026-06-10pricedays on market $149,900 Active 9 DOM
-
2026-06-09days on market $155,000 Active 8 DOM
-
2026-06-08days on market $155,000 Active 7 DOM
-
2026-06-07days on market $155,000 Active 6 DOM
-
2026-06-05days on market $155,000 Active 3 DOM
-
2026-06-03days on market $155,000 Active 2 DOM
-
2026-06-02days on market $155,000 Active 1 DOM
-
2026-05-11$155,000 Active 783-char remark
-
2026-04-22historical $155,000 783-char remark
-
2025-09-19historical
-
2025-09-16price $169,900
-
2025-06-17price $174,900
-
2025-05-05$180,000 Active
-
2023-09-04historical $1,200
-
2023-08-31$1,200
-
2023-08-14historical
-
2023-06-06$175,000
-
2020-09-22soldstatus
-
2020-09-17soldstatus
-
2020-02-09$109,900
-
2019-08-26soldstatus
-
2009-10-12soldstatus
ⓘ Source: listings_history table (triggers on properties + properties_extension) + one-shot
backfill from property_details.listing_events for pre-trigger history.
Tax reassessment forecast TX · Resets to sale price
- Current annual tax
- $3,383 · $282/mo
- Projected year-2 tax
- $3,383 · $282/mo
- Expected delta
- $0/yr ($0/mo · 0.0%)
ⓘ Screening estimate from a state-policy table — verify with the county assessor before closing.
Climate risk First Street
- Flood 1/10 Low FEMA zone X (unshaded) · 0% chance over 30 yrs
- Wildfire 1/10 Low
- Heat 7/10 Severe 7 d/yr ≥108°F today · 23 d/yr by 30 yrs out
- Wind 6/10 Major 61% chance of damaging wind over 30 yrs
- Air quality 1/10 Low 0 unhealthy d/yr today · 0 by 30 yrs out
Nearby sold comps map
Loading sold comps map…
Walkable amenities ~0.75 mi
Loading nearby amenities…
Taxation est. · year 1
- Rental income
- $15,756
- − Mortgage interest
- −$8,397
- − Property taxes
- −$3,383
- − Insurance
- −$750
- − Repairs & maintenance
- −$1,261
- − Management
- −$1,261
- − Depreciation
- −$4,361
- Taxable loss
- −$3,655
- Est. tax savings @ 24.0%
- +$877
- After-tax cash flow
- $-241/yr
For passive investors: Depreciation is non-cash, so a rental often shows a tax loss while cash-flowing — sheltering income. Rental losses are passive: they offset passive income freely, and up to $25,000/yr can offset ordinary (W-2) income if you actively participate and your MAGI is under $100k (phasing out to $0 by $150k); unused losses carry forward. On sale, claimed depreciation is recaptured at up to 25%, and gains may owe capital-gains tax (a 1031 exchange can defer both). Figures are a year-1 estimate at your 24.0% rate — not tax advice; consult a CPA.
Schools (NCES district)
- District
- Waco ISD
- NCES district ID
- 4844280
- Math proficiency
- 20% ▼ -14.00%
- Reading proficiency
- 24% ▼ -6.00%
- Median HH income
- $29,208
- Composite
- 17.57/100
- National rank
- #9043
- State rank
- #773 of 826 in TX
Livability — Waco
- Score
- 74/100
- State rank
- #166
- US rank
- #4378
Category grades
Schools grade is shown separately in the Schools card above.
Census & demographics
- Census place
- Waco, TX
- County
- McLennan County · 213,088 people
- City population
- 125,319
- Metro
- Waco, TX
- Population (ZIP)
- 9,676
- Household income
- $53,185
- Rent vs Own
- Severe rent burden
- 424.0
Population outlook (McLennan County) Hauer SSP2
- Today (2025)
- 264,191 people
- By 2030
- 273,578 · +3.6%
- By 2040
- 291,506 · +10.3%
- By 2050
- 308,044 · +16.6%
- By 2075
- 349,648 · +32.3%
- By 2100
- 364,779 · +38.1%
Race, ethnicity, and origin ACS 2023
- Neighborhood character
- Diverse neighborhood (Simpson 0.56)
- Race & ethnicity
- Hispanic / Latino 61% Two or more races 43% White 23% Black 12% Native American 3% Asian 2%
- Hispanic origin (detail)
- Mexican 56%
- Common ancestry
- Lithuanian 1% Italian 1% Portuguese 1%
- Foreign-born
- 27% · Canada, China
- Languages at home
- 53% English-only · Spanish 45% Tagalog/Filipino 1% Other Indo-European 1%
Political lean MEDSL · McLennan
- 2024 margin
- Solid R (+30.9) · D 34.0% · R 64.9% · Other 1.0%
- 2008→2024 swing
- -7.0pp toward R · 2008: -23.9pp · 2024: -30.9pp
- All cycles
- 2024: R+30.9 2020: R+23.4 2016: R+27.1 2012: R+29.8 2008: R+23.9
Not yet ingested
- Civics
- —
Market trends
- HPI YoY
- ▲ 3.57%
- Current HPI
- 261.7166
- Rent YoY
- ▲ 2.62%
- Metro
- Waco, TX
- State GDP YoY
- ▲ 3.95%
- F500 in state
- 110
Industry mix (Fortune 500 HQ in TX)
| Industry | F500 HQs | Revenue |
|---|---|---|
| Energy | 16 | $1,198B |
|
||
| Technology | 5 | $198B |
|
||
| Engineering / Construction | 4 | $72B |
|
||
| Energy Services | 3 | $60B |
|
||
| Utilities | 3 | $41B |
|
||
| Healthcare | 2 | $330B |
|
||
Price history
+36.4% since first listed22 events — show timeline
- 2026-06-10 Price Changed $149,900 NTREIS
- 2026-05-29 Listing Removed — NTREIS
- 2026-05-28 Listed $155,000 NTREIS
- 2026-05-26 Listing Removed — NTREIS
- 2026-05-22 Listing Removed — HARMLS
- 2026-05-22 Listed $155,000 NTREIS
- 2026-05-11 Listed $155,000 HARMLS
- 2026-04-22 Coming Soon — HARMLS
- 2025-10-12 Listed $160,000 NTREIS
- 2025-09-19 Listing Removed — NTREIS
- 2025-09-16 Price Changed $169,900 NTREIS
- 2025-06-17 Price Changed $174,900 NTREIS
- 2025-05-05 Listed $180,000 NTREIS
- 2023-09-04 Rental Removed $1,200 APPFOLIO
- 2023-08-31 Listed for Rent $1,200 APPFOLIO
- 2023-08-14 Listing Removed — NTREIS
- 2023-06-06 Listed $175,000 NTREIS
- 2020-09-22 Sold (Public Records) — Public Records
- 2020-09-17 Sold (MLS) — NTREIS
- 2020-02-09 Listed $109,900 NTREIS
- 2019-08-26 Sold (Public Records) — Public Records
- 2009-10-12 Sold (Public Records) — Public Records
Property tax history
+10.6%/yrLatest (2025): $3,383 · -0.9% YoY. Source: county tax records.
Cash-flow waterfall
monthlySold comps — $/sqft
last 12 mo · ≤1 miLoading sold comps…