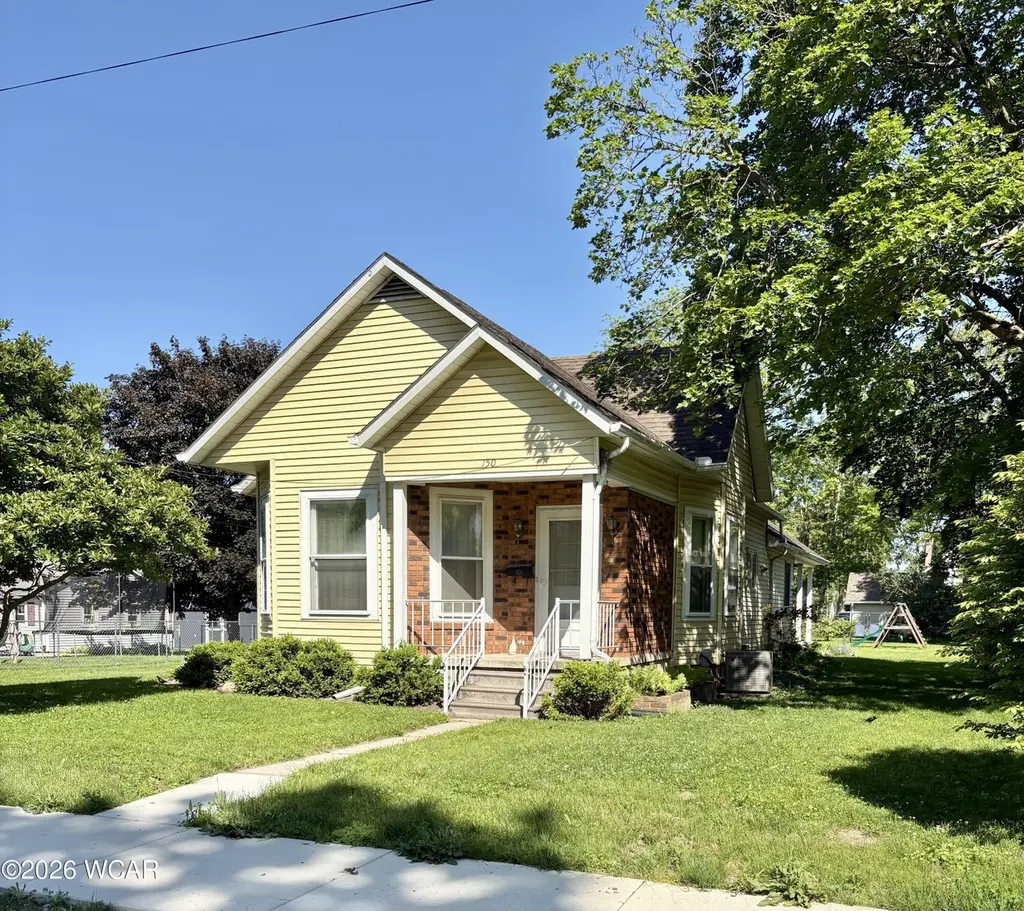
150 Geiger St · Bluffton, OH
Flood risk 1/10 · Minimal
- FEMA flood zone
- X (unshaded)
- Chance of flooding over 30 yrs
- 0.0%
- Est. flood insurance / yr
- $473 – $860
Fire risk 1/10 · Minimal
- Est. fire insurance / yr
- $713 – $1,323
Heat risk 3/10 · Minor
- Hot days now (above 99°F)
- 7 days/yr
- Hot days in 30 yrs
- 17 days/yr
Wind risk 2/10 · Minimal
- Chance of severe wind over 30 yrs
- —
Air-quality risk 2/10 · Minimal
- Unhealthy air days now
- 1 days/yr
- Unhealthy air days in 30 yrs
- 2 days/yr
Risk factors via First Street. Map © Google.
Why this score? — see what drove the B- grade
The composite is a weighted blend of 9 inputs, each scored 0–100. Each bar is that input's sub-score; the figure is the points it added to the 100-point composite (weight × sub-score).
- Cash flow +27.9/30.0
- DSCR +9.9/10.0
- ARV discount +8.1/15.0
- 1% rule +7.2/10.0
- Schools +6.7/10.0
- Livability +4.5/5.0
- Rent growth +2.5/5.0
- Condition / age +2.5/5.0
- Appreciation +0.0/10.0
$174,000
🖨 Deal sheet 📄 Offer letter ✓ Due diligence
Listing remarks MLS
A RE/MAX REALTY/FINDLAY LISTING. NICELY MAINTAINED BUNGALOW. NEW CARPET IN LIVING ROOM. EAT IN KITCHEN WITH CERAMIC BACKSPLASH AND LARGE PANTRY. UPDATED BATH. OVERSIZED UTILITY ROOM WITH SINK. COVERED BACK PORCH. UNFINISHED AREA OVER GARAGE COULD BE FINISHED FOR ADDITIONAL LIVING SPACE. CALL GREG WILLIAMS TO SET UP ALL SHOWINGS 419-348-9005
Key facts
- 9,365 sq ft lot
- Garage
- Built 1920
Neighborhood map
What this means for you Summary
Snapshot
- This is a 2-bed/1.0-bath single-family listed at $174k.
Deal economics
- At list price, monthly cash flow is $536 ($6k/yr) — positive.
- The deal already cash-flows at list — no discount required.
- Meets the 1% rule at list price ($2k rent vs $174k).
Location & tenants
- Location reads 91/100 on livability (#7 in OH, #68 nationally) — a professional / high-income tenant draw. Strengths: schools A+, amenities A+, cost of living A+; Watch: commute F.
- Bluffton Exempted Village (town): math 79% / reading 77% proficiency, ranked #63 of 656 in OH (top 10%) — strong family-tenant draw, lease renewals of 3-5y typical.
- Market conditions: 23 active listings in the ZIP; 2 comparable units currently listed for rent nearby; solid renter incomes; 88 units permitted in Allen County in 2024 (0 in 5+ unit buildings).
- This rent runs 31% of the median local income ($83k/yr) — at the standard rent-burdened threshold; future hikes will face affordability resistance.
Forward outlook
- Local home prices are declining (-3.0%/yr); year-one equity from $1k of loan paydown is wiped out by about $5k of value loss. Plan a longer hold.
- Allen County population projected at -14% by 2050 — secular population decline; favor cash flow + early exit over multi-decade hold.
- At projected returns (-3.0% appreciation + 3.0% rent growth), your $49k cash investment doubles in ~9 years — after that, you're playing with house money.
Negotiation context
- Only 0 days on market — expect competitive offers; lowballing is unlikely to land.
- 3 sale attempts since 13y ago with the ask held roughly flat each time — persistent listings suggest the price (not the market) is what's stuck; bring a comps-based counter.
- Current owner paid $84k; list at $174k implies a 107% gain — meaningful room to come down on a strong offer.
Risks & watch-outs
- Watch-outs: built in 1920 — expect roof / HVAC / electrical / plumbing capex.
Questions for the listing agent
- Built in 1920 — when were the roof, HVAC, electrical panel, plumbing, and water heater last replaced?
- Is there a deadline driving the sale (1031 exchange, divorce, estate, relocation)? That informs how much negotiation room exists.
- Schools are A-rated — typically a magnet for longer-tenancy family renters. What's the average tenant stay here, and is there a school-zone premium baked into asking?
- What's the average days-on-market for RENTAL listings here right now (not sales)? A rising rental-DOM trend means longer vacancies and softer asking-rent achievability than the comps imply.
- What's the recent tenant-quality profile in this submarket — average credit score on applications, eviction rate, late-payment / NSF rate, and stable-employment percentage? A property-management company in the area should have these aggregated.
- How much new for-sale + rental construction is in the pipeline within 1–3 miles? Heavy new supply typically softens prices + rents 12–24 months out; constrained supply supports both.
Investment metrics
- 1% rule
- 1.22% ✓
- Cap rate
- 9.99%
- Cash-on-cash
- 13.19%
- DSCR
- 1.59
- GRM
- 6.8
CMA / ARV
- ARV (on-the-fly)
- $176,352
- Comps found
- 5
Show comp detail 5 sales within ~0.75 mi
| Address | Dist | Beds/Ba | Sqft | Sold | Price | $/sf | Match |
|---|---|---|---|---|---|---|---|
| 150 Geiger St | 0.00mi | 2/1.0 | 1,002 (0%) | 1mo | $174,000 | $174 | 99 |
| 180 Huber St | 0.22mi | 2/1.0 | 1,014 (+1%) | 11mo | $110,000 | $108 | 79 |
| 307 S Main St Unit back | 0.38mi | 2/1.0 | 952 (-5%) | 1mo | $174,900 | $184 | 73 |
| 131 N Spring St | 0.65mi | 2/1.0 | 936 (-7%) | 13mo | $165,000 | $176 | 48 |
| 227 E Elm St | 0.39mi | 3/1.0 (+1) | 875 (-13%) | 21mo | $180,000 | $206 | 38 |
Match score weights: distance 35% · size 25% · config 20% · recency 20%. Top-matched comps best support the ARV.
Projected returns pro-forma
-3.0% appreciation · 3.0% rent growth · sell at horizon
- IRR
- 3.2%
- Equity multiple
- 1.12×
- Total profit
- $5,910
- Equity at exit
- $25,944
- IRR
- 12.7%
- Equity multiple
- 2.01×
- Total profit
- $49,057
- Equity at exit
- $15,044
Cash invested: $48,720 (down + closing). Projections, not guarantees.
Landlord ↔ Tenant lean methodology
- Overall (STATE)
- 73 Landlord-Friendly
- State Ohio
- 73 Landlord-Friendly · R+6
- County
- — inherits STATE
- City
- — inherits STATE
ZIP-level market 45817
- Home prices YoY
- -33.5%
- Active inventory
- 23
- Price-to-rent
- 6.8×
Monthly cashflow live
- Estimated rent
- $2,130 medium interval (Pro) →
- Mortgage (P&I)
- −$912
- Tax from tax record
- −$162 /mo · $1,944/yr
- Insurance
- −$72
- HOA
- −$0
- Vacancy / Maint / Mgmt
- −$447
- Net cashflow
- $536
Break-even live
UW: 25.0% down · 7.5% · 30yr · 1.5% tax · 5.0% vac · 8.0% maint · 8.0% mgmt
Financing live
Cash to close
- Down payment
- $43,500
- Closing costs
- $5,220
- Reserves months
- —
- Total cash needed
- —
Loan-product check · same deal, 3 products live
Conventional
25% down · 7.5% · 30yr
- Down + closing
- —
- Monthly P&I
- —
- Monthly cashflow
- —
- DSCR
- —
- Eligible?
- —
Personal DTI + credit; lowest rate.
DSCR
20% down · 8.5% · 30yr
- Down + closing
- —
- Monthly P&I
- —
- Monthly cashflow
- —
- DSCR
- —
- Eligible?
- —
No personal income docs; deal must DSCR.
Hard money
10% down · 12.0% · 12mo
- Down + closing
- —
- Monthly P&I
- —
- Monthly cashflow
- —
- DSCR
- —
- Eligible?
- —
Short-term bridge; refi at stabilization.
Rent comps 2 comps
| Address | Beds | Baths | Sqft | Rent | $/sqft | DOM | Units | Dist |
|---|---|---|---|---|---|---|---|---|
| 358 Cherry St Bluffton, OH | 3.0 | 1.0 | 1212 | $2,295 | $1.89 | 43d | 1 | 0.11mi |
| 44 Ohio 103 Unit 1 Bluffton, OH | 3.0 | 2.0 | 1200 | $1,300 | $1.08 | 43d | 1 | 0.55mi |
Listing history 9 events
-
2026-05-28historical
-
2026-05-27$174,000
-
2013-04-03soldstatus $84,000
-
2013-04-02soldstatus $84,000 342-char remark
Show marketing remark (342 chars)
A RE/MAX REALTY/FINDLAY LISTING. NICELY MAINTAINED BUNGALOW. NEW CARPET IN LIVING ROOM. EAT IN KITCHEN WITH CERAMIC BACKSPLASH AND LARGE PANTRY. UPDATED BATH. OVERSIZED UTILITY ROOM WITH SINK. COVERED BACK PORCH. UNFINISHED AREA OVER GARAGE COULD BE FINISHED FOR ADDITIONAL LIVING SPACE. CALL GREG WILLIAMS TO SET UP ALL SHOWINGS 419-348-9005
-
2013-03-09$88,900 342-char remark
Show marketing remark (342 chars)
A RE/MAX REALTY/FINDLAY LISTING. NICELY MAINTAINED BUNGALOW. NEW CARPET IN LIVING ROOM. EAT IN KITCHEN WITH CERAMIC BACKSPLASH AND LARGE PANTRY. UPDATED BATH. OVERSIZED UTILITY ROOM WITH SINK. COVERED BACK PORCH. UNFINISHED AREA OVER GARAGE COULD BE FINISHED FOR ADDITIONAL LIVING SPACE. CALL GREG WILLIAMS TO SET UP ALL SHOWINGS 419-348-9005
-
2013-03-09$84,000 342-char remark
Show marketing remark (342 chars)
A RE/MAX REALTY/FINDLAY LISTING. NICELY MAINTAINED BUNGALOW. NEW CARPET IN LIVING ROOM. EAT IN KITCHEN WITH CERAMIC BACKSPLASH AND LARGE PANTRY. UPDATED BATH. OVERSIZED UTILITY ROOM WITH SINK. COVERED BACK PORCH. UNFINISHED AREA OVER GARAGE COULD BE FINISHED FOR ADDITIONAL LIVING SPACE. CALL GREG WILLIAMS TO SET UP ALL SHOWINGS 419-348-9005
-
2010-09-01soldstatus $79,200
-
2008-08-25soldstatus $79,175
ⓘ Source: listings_history table (triggers on properties + properties_extension) + one-shot
backfill from property_details.listing_events for pre-trigger history.
Tax reassessment forecast OH · Partial reset (capped growth)
- Current annual tax
- $1,944 · $162/mo
- Projected year-2 tax
- $2,329 · $194/mo
- Expected delta
- +$385/yr (+$32/mo · 19.8%)
ⓘ Screening estimate from a state-policy table — verify with the county assessor before closing.
Climate risk First Street
- Flood 1/10 Low FEMA zone X (unshaded) · 0% chance over 30 yrs
- Wildfire 1/10 Low
- Heat 3/10 Moderate 7 d/yr ≥99°F today · 17 d/yr by 30 yrs out
- Wind 2/10 Low
- Air quality 2/10 Low 1 unhealthy d/yr today · 2 by 30 yrs out
Nearby sold comps map
Loading sold comps map…
Walkable amenities ~0.75 mi
Loading nearby amenities…
Taxation est. · year 1
- Rental income
- $25,557
- − Mortgage interest
- −$9,747
- − Property taxes
- −$1,944
- − Insurance
- −$870
- − Repairs & maintenance
- −$2,045
- − Management
- −$2,045
- − Depreciation
- −$5,062
- Taxable income
- $3,845
- Est. tax owed @ 24.0%
- −$923
- After-tax cash flow
- $5,503/yr
For passive investors: Depreciation is non-cash, so a rental often shows a tax loss while cash-flowing — sheltering income. Rental losses are passive: they offset passive income freely, and up to $25,000/yr can offset ordinary (W-2) income if you actively participate and your MAGI is under $100k (phasing out to $0 by $150k); unused losses carry forward. On sale, claimed depreciation is recaptured at up to 25%, and gains may owe capital-gains tax (a 1031 exchange can defer both). Figures are a year-1 estimate at your 24.0% rate — not tax advice; consult a CPA.
Schools (NCES district)
- District
- Bluffton Exempted Village
- NCES district ID
- 3904521
- Math proficiency
- 79% ▼ -8.00%
- Reading proficiency
- 77% ▼ -6.00%
- Median HH income
- $59,825
- Composite
- 66.95/100
- National rank
- #398
- State rank
- #63 of 656 in OH
Livability — Bluffton
- Score
- 91/100
- State rank
- #7
- US rank
- #68
Category grades
Schools grade is shown separately in the Schools card above.
Census & demographics
- Census place
- Bluffton, OH
- County
- Allen · 98,169 people
- Metro
- Lima, OH
- Population (ZIP)
- 5,820
- Household income
- $82,784
- Rent vs Own
Population outlook (Allen County) Hauer SSP2
- Today (2025)
- 100,321 people
- By 2030
- 97,693 · -2.6%
- By 2040
- 91,802 · -8.5%
- By 2050
- 86,152 · -14.1%
- By 2075
- 73,659 · -26.6%
- By 2100
- 58,716 · -41.5%
Race, ethnicity, and origin ACS 2023
- Neighborhood character
- Predominantly White (92%)
- Race & ethnicity
- White 92% Two or more races 3% Asian 2% Black 2% Hispanic / Latino 1%
- Common ancestry
- Romanian 3% Slovak 3% Lithuanian 2%
- Foreign-born
- 3% · Canada
- Languages at home
- 97% English-only · Spanish 1% Other Indo-European 1%
Political lean MEDSL · Allen
- 2024 margin
- Solid R (+44.1) · D 27.5% · R 71.6%
- 2008→2024 swing
- -23.4pp toward R · 2008: -20.7pp · 2024: -44.1pp
- All cycles
- 2024: R+44.1 2020: R+39.5 2016: R+38.2 2012: R+25.7 2008: R+20.7
Not yet ingested
- Civics
- —
Market trends
- HPI YoY
- ▼ -104.21%
- Current HPI
- 206.5891
- Rent YoY
- —
- Metro
- —
- State GDP YoY
- ▲ 1.98%
- F500 in state
- 48
Industry mix (Fortune 500 HQ in OH)
| Industry | F500 HQs | Revenue |
|---|---|---|
| Insurance | 3 | $145B |
|
||
| Industrial Machinery | 3 | $49B |
|
||
| Financial Services | 3 | $24B |
|
||
| Consumer Goods | 2 | $93B |
|
||
| Aerospace / Defense | 2 | $47B |
|
||
| Utilities | 2 | $33B |
|
||
Price history
+119.8% since first listed9 events — show timeline
- 2026-05-28 Delisted — WCARE
- 2026-05-27 Listed $174,000 WCARE
- 2013-04-03 Sold (Public Records) $84,000 Public Records
- 2013-04-02 Sold (MLS) $84,000 NORIS
- 2013-04-02 Sold (MLS) $84,000 NORIS
- 2013-03-09 Listed $84,000 NORIS
- 2013-03-09 Listed $88,900 NORIS
- 2010-09-01 Sold (Public Records) $79,200 Public Records
- 2008-08-25 Sold (Public Records) $79,175 Public Records
Property tax history
+6.7%/yrLatest (2025): $1,944 · -0.0% YoY. Source: county tax records.
Cash-flow waterfall
monthlySold comps — $/sqft
last 12 mo · ≤1 miLoading sold comps…