 Multi-family
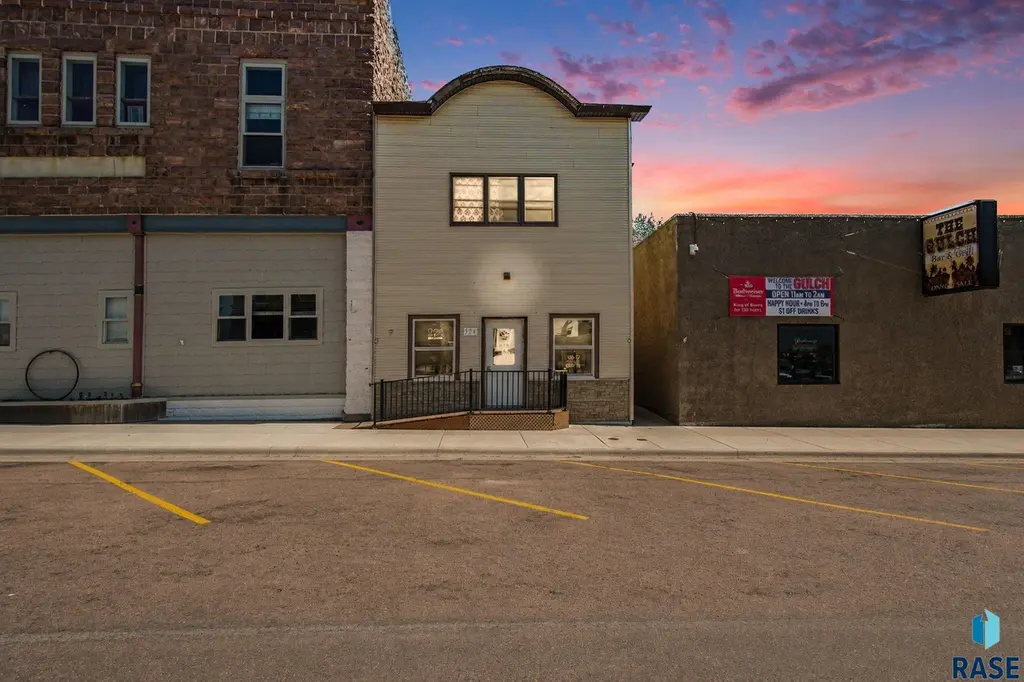
524 N Main Ave Ave · Garretson, SD
Flood risk 1/10 · Minimal
- FEMA flood zone
- X (unshaded)
- Chance of flooding over 30 yrs
- 0.0%
- Est. flood insurance / yr
- $507 – $1,088
Fire risk 3/10 · Minor
- Est. fire insurance / yr
- $1,342 – $2,492
Heat risk 2/10 · Minimal
- Hot days now (above 99°F)
- 7 days/yr
- Hot days in 30 yrs
- 15 days/yr
Wind risk 2/10 · Minimal
- Chance of severe wind over 30 yrs
- —
Air-quality risk 2/10 · Minimal
- Unhealthy air days now
- 1 days/yr
- Unhealthy air days in 30 yrs
- 1 days/yr
Risk factors via First Street. Map © Google.
Why this score? — see what drove the C+ grade
The composite is a weighted blend of 9 inputs, each scored 0–100. Each bar is that input's sub-score; the figure is the points it added to the 100-point composite (weight × sub-score).
- Cash flow +20.9/30.0
- Appreciation +10.0/10.0
- ARV discount +7.5/15.0
- DSCR +6.6/10.0
- 1% rule +5.5/10.0
- Schools +3.8/10.0
- Livability +3.8/5.0
- Rent growth +2.5/5.0
- Condition / age +2.2/5.0
$120,000
🖨 Deal sheet 📄 Offer letter ✓ Due diligence
Multi-family units
County records classify this as Multi-Family (2-4 Unit). Listing-text estimate: 1 unit. estimate disagrees with records
Key facts
- Fully remodeled
- Hair salon
- Commercial unit
Tags
Property features AI
Finance
- Other: Owner pays gas, water, and sewer
- Financial info: 2-unit multifamily property; Unit 1 rent $800 (lease through 01/2029); Unit 2 rent $600 (lease through 05/2027); Bedrooms and baths vary by unit
Exterior
- Parking: Off-street parking
- Utilities: Public water; Public sewer
- Home design: 2-story building; Private entry; Brick veneer construction; Facing/entry orientation not specified
- Construction: Brick veneer exterior; Slab foundation; Other-style roof
- Exterior features: 24 x 140 lot dimensions; No additional exterior amenities listed
Interior
- Kitchen: Refrigerator; Range; Microwave
- Bedrooms: Unit 2 has 2 bedrooms
- Flooring: Carpet; Vinyl; Laminate
- Bathrooms: Each unit has 1 bathroom
- Heating & cooling: Natural gas heating; Electric cooling
- Interior features: Private entry; Balcony/deck; Carpets in some areas
- Laundry & utility: Owner pays gas, water, and sewer
Neighborhood map
What this means for you Summary
Snapshot
- This is a 2-bed/2.0-bath multifamily listed at $120k. Condition is rated fair.
Deal economics
- At list price, monthly cash flow is $167 ($2k/yr) — positive.
- The deal already cash-flows at list — no discount required.
- Meets the 1% rule at list price ($1k rent vs $120k).
- Recommended offer: $118k (1.5% below list) — sets the bar for market timing.
Location & tenants
- Location reads 76/100 on livability (#21 in SD, #3,335 nationally) — a middle-class / working-renter tenant base. Strengths: crime A+, cost of living A+, housing A+; Watch: employment C-, amenities F, commute F.
- Garretson School District 49-4 (rural): math 34% / reading 50% proficiency, ranked #43 of 59 in SD (top 73%) — families likely to look elsewhere, expect single-tenant / working-renter base with shorter leases; only 14% free/reduced lunch — higher-income household profile.
- Zoned schools: Garretson Elementary - 02 (math 32% / reading 42%, grade F, #183 of 253 statewide, top 73%, 243 students, 22% FRL); Garretson High School - 01 (math 24% / reading 54%, grade F, #123 of 151 statewide, top 83%, 128 students, 7% FRL) — zoned schools at 15% FRL track the district average.
- Market conditions: 28 active listings in the ZIP; 2 comparable units currently listed for rent nearby; 2,425 units permitted in Minnehaha County in 2024 (1,367 in 5+ unit buildings).
Forward outlook
- In year one you build about $13k of equity ($830 loan paydown + $12k appreciation (10.0% local appreciation)).
- Minnehaha County population projected at +46% by 2050 — long-run rental-demand tailwind backs the buy-and-hold thesis.
- At projected returns (10.0% appreciation + 3.0% rent growth), your $34k cash investment doubles in ~3 years — after that, you're playing with house money.
- By year 3, paydown + projected appreciation supports a ~$32k cash-out refi (75% LTV) — recoverable capital for the next deal without selling this one.
Negotiation context
- It's been on market 21 days — a 2% lower offer ($118k) is reasonable based on typical stale-listing flexibility.
Risks & watch-outs
- Watch-outs: built in 1880 — expect roof / HVAC / electrical / plumbing capex.
Questions for the listing agent
- Have any recent inspections been done? Can we get a copy of the seller's disclosures and any deferred-maintenance estimates?
- Built in 1880 — when were the roof, HVAC, electrical panel, plumbing, and water heater last replaced?
- Is there a deadline driving the sale (1031 exchange, divorce, estate, relocation)? That informs how much negotiation room exists.
- Schools are B-rated — typically a magnet for longer-tenancy family renters. What's the average tenant stay here, and is there a school-zone premium baked into asking?
- What's the average days-on-market for RENTAL listings here right now (not sales)? A rising rental-DOM trend means longer vacancies and softer asking-rent achievability than the comps imply.
- What's the recent tenant-quality profile in this submarket — average credit score on applications, eviction rate, late-payment / NSF rate, and stable-employment percentage? A property-management company in the area should have these aggregated.
- How much new apartment / multifamily construction is in the pipeline within 1–3 miles? Heavy new supply (>2% of stock underway) typically softens rents 12–24 months out; light construction supports rent growth.
Investment metrics
- 1% rule
- 1.05% ✓
- Cap rate
- 7.96%
- Cash-on-cash
- 5.95%
- DSCR
- 1.26
- GRM
- 7.9
CMA / ARV
No comps found within radius.
Projected returns pro-forma
10.0% appreciation · 3.0% rent growth · sell at horizon
- IRR
- 28.6%
- Equity multiple
- 3.26×
- Total profit
- $75,986
- Equity at exit
- $108,106
- IRR
- 24.9%
- Equity multiple
- 7.41×
- Total profit
- $215,459
- Equity at exit
- $233,134
Cash invested: $33,600 (down + closing). Projections, not guarantees.
Landlord ↔ Tenant lean methodology
- Overall (STATE)
- 83 Strongly Landlord-Friendly
- State South Dakota
- 83 Strongly Landlord-Friendly · R+16
- County
- — inherits STATE
- City
- — inherits STATE
ZIP-level market 57030
- Home prices YoY
- 11.7%
- Active inventory
- 28
- Price-to-rent
- 7.9×
Monthly cashflow live
- Estimated rent
- $1,261 medium interval (Pro) →
- Mortgage (P&I)
- −$629
- Tax est. 1.5%
- −$150 /mo · $1,800/yr
- Insurance
- −$50
- HOA
- −$0
- Vacancy / Maint / Mgmt
- −$265
- Net cashflow
- $167
Break-even live
UW: 25.0% down · 7.5% · 30yr · 1.5% tax · 5.0% vac · 8.0% maint · 8.0% mgmt
Financing live
Cash to close
- Down payment
- $30,000
- Closing costs
- $3,600
- Reserves months
- —
- Total cash needed
- —
Loan-product check · same deal, 3 products live
Conventional
25% down · 7.5% · 30yr
- Down + closing
- —
- Monthly P&I
- —
- Monthly cashflow
- —
- DSCR
- —
- Eligible?
- —
Personal DTI + credit; lowest rate.
DSCR
20% down · 8.5% · 30yr
- Down + closing
- —
- Monthly P&I
- —
- Monthly cashflow
- —
- DSCR
- —
- Eligible?
- —
No personal income docs; deal must DSCR.
Hard money
10% down · 12.0% · 12mo
- Down + closing
- —
- Monthly P&I
- —
- Monthly cashflow
- —
- DSCR
- —
- Eligible?
- —
Short-term bridge; refi at stabilization.
Rent comps 2 comps
| Address | Beds | Baths | Sqft | Rent | $/sqft | DOM | Units | Dist |
|---|---|---|---|---|---|---|---|---|
| 805 4th St Garretson, SD | 3.0 | 2.0 | 1475 | $1,275 | $0.86 | 13d | 1 | 0.16mi |
| 305 S Frank Ave Garretson, SD | 2.0 | 1.0–2.0 | 880 | $1,174 | $1.33 | 13d | 3 | 0.61mi |
Listing history 16 events
-
2026-06-18days on market $120,000 Active 21 DOM
-
2026-06-17days on market $120,000 Active 20 DOM
-
2026-06-16days on market $120,000 Active 19 DOM
-
2026-06-15days on market $120,000 Active 18 DOM
-
2026-06-14days on market $120,000 Active 16 DOM
-
2026-06-13days on market $120,000 Active 15 DOM
-
2026-06-10days on market $120,000 Active 13 DOM
-
2026-06-09days on market $120,000 Active 12 DOM
-
2026-06-08days on market $120,000 Active 11 DOM
-
2026-06-07days on market $120,000 Active 10 DOM
-
2026-06-03days on market $120,000 Active 6 DOM
-
2026-06-02days on market $120,000 Active 5 DOM
-
2026-06-01days on market $120,000 Active 4 DOM
-
2026-05-31days on market $120,000 Active 3 DOM
-
2026-05-30days on market $120,000 Active 2 DOM
-
2026-05-27$120,000 Active
ⓘ Source: listings_history table (triggers on properties + properties_extension) + one-shot
backfill from property_details.listing_events for pre-trigger history.
Climate risk First Street
- Flood 1/10 Low FEMA zone X (unshaded) · 0% chance over 30 yrs
- Wildfire 3/10 Moderate
- Heat 2/10 Low 7 d/yr ≥99°F today · 15 d/yr by 30 yrs out
- Wind 2/10 Low
- Air quality 2/10 Low 1 unhealthy d/yr today · 1 by 30 yrs out
Nearby sold comps map
Loading sold comps map…
Walkable amenities ~0.75 mi
Loading nearby amenities…
Taxation est. · year 1
- Rental income
- $15,128
- − Mortgage interest
- −$6,722
- − Property taxes
- −$1,800
- − Insurance
- −$600
- − Repairs & maintenance
- −$1,210
- − Management
- −$1,210
- − Depreciation
- −$3,491
- Taxable income
- $94
- Est. tax owed @ 24.0%
- −$23
- After-tax cash flow
- $1,977/yr
For passive investors: Depreciation is non-cash, so a rental often shows a tax loss while cash-flowing — sheltering income. Rental losses are passive: they offset passive income freely, and up to $25,000/yr can offset ordinary (W-2) income if you actively participate and your MAGI is under $100k (phasing out to $0 by $150k); unused losses carry forward. On sale, claimed depreciation is recaptured at up to 25%, and gains may owe capital-gains tax (a 1031 exchange can defer both). Figures are a year-1 estimate at your 24.0% rate — not tax advice; consult a CPA.
Condition & rehab AI · 12 photos
The property requires moderate renovations, including exterior siding, interior walls, flooring, and kitchen and bathroom updates, to improve its condition and value.
Repairs flagged
- Major exterior siding — Significant weathering
- Major interior walls — Paint chipping
- Major flooring — Worn carpet
- Major kitchen appliances — Outdated and cluttered
- Major bathroom fixtures — Outdated and cluttered
Value-add opportunities
- Both Painting and updating kitchen appliances — Enhances curb appeal and functionality
- Both Flooring replacement — Improves aesthetics and functionality
- Both Bathroom updates — Enhances functionality and aesthetics
Renovation cost estimate screening
| Repair item | Severity | Est. cost |
|---|---|---|
| exterior siding · Significant weathering | Major | $15,000–50,000 |
| interior walls · Paint chipping | Major | $15,000–50,000 |
| flooring · Worn carpet | Major | $15,000–50,000 |
| kitchen appliances · Outdated and cluttered | Major | $15,000–50,000 |
| bathroom fixtures · Outdated and cluttered | Major | $15,000–50,000 |
| Total estimated repair cost · 5 items | $75,000–250,000 |
Value-add ROI direction
- Both Painting and updating kitchen appliances — Enhances curb appeal and functionality ↑
- Both Flooring replacement — Improves aesthetics and functionality ↑
- Both Bathroom updates — Enhances functionality and aesthetics ↑
ⓘ Cost ranges are severity-bucket heuristics (US national rule-of-thumb). Get contractor quotes + a written scope before underwriting a rehab budget.
Schools (NCES district)
- District
- Garretson School District 49-4
- NCES district ID
- 4626370
- Math proficiency
- 34% ▼ -7.00%
- Reading proficiency
- 50% ▼ -4.00%
- Median HH income
- $66,209
- Composite
- 37.64/100
- National rank
- #4375
- State rank
- #43 of 59 in SD
Livability — Garretson
- Score
- 76/100
- State rank
- #21
- US rank
- #3335
Category grades
Schools grade is shown separately in the Schools card above.
Census & demographics
- Census place
- Garretson, SD
- Population (ZIP)
- 2,617
Population outlook (Minnehaha County) Hauer SSP2
- Today (2025)
- 222,323 people
- By 2030
- 241,430 · +8.6%
- By 2040
- 281,643 · +26.7%
- By 2050
- 325,574 · +46.4%
- By 2075
- 469,313 · +111.1%
- By 2100
- 664,763 · +199.0%
Race, ethnicity, and origin ACS 2023
- Neighborhood character
- Predominantly White (92%)
- Race & ethnicity
- White 92% Native American 6% Two or more races 2%
- Common ancestry
- Portuguese 23% Iranian 9% Slovak 2%
- Foreign-born
- 0%
- Languages at home
- 98% English-only · Spanish 1% German/W. Germanic 1%
Political lean MEDSL · Minnehaha
- 2024 margin
- R (+12.7) · D 42.5% · R 55.2% · Other 2.4%
- 2008→2024 swing
- -13.4pp toward R · 2008: 0.7pp · 2024: -12.7pp
- All cycles
- 2024: R+12.7 2020: R+9.5 2016: R+14.6 2012: R+7.4 2008: D+0.7
Not yet ingested
- Civics
- —
Market trends
- HPI YoY
- ▲ 34.93%
- Current HPI
- 333.39
- Rent YoY
- —
- Metro
- —
- State GDP YoY
- ▲ 0.70%
- F500 in state
- 2
Industry mix (Fortune 500 HQ in SD)
| Industry | F500 HQs | Revenue |
|---|---|---|
| Utilities | 1 | $1B |
|
||
Price history
1 event — show timeline
- 2026-05-27 Listed $120,000 REALTOR® Association of the Sioux Empire
Cash-flow waterfall
monthlySold comps — $/sqft
last 12 mo · ≤1 miLoading sold comps…