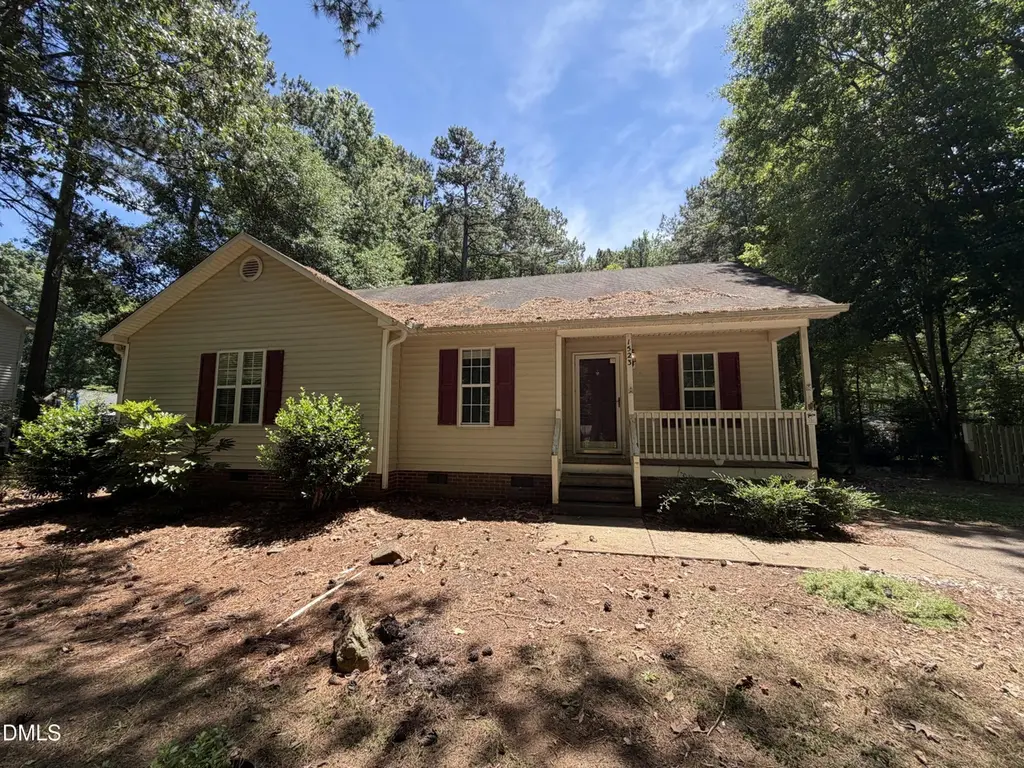
1523 Middle Ridge Dr · Fuquay-Varina, NC
Flood risk 1/10 · Minimal
- FEMA flood zone
- X (unshaded)
- Chance of flooding over 30 yrs
- 0.0%
- Est. flood insurance / yr
- $507 – $1,088
Fire risk 3/10 · Minor
- Est. fire insurance / yr
- $906 – $1,684
Heat risk 6/10 · Moderate
- Hot days now (above 105°F)
- 7 days/yr
- Hot days in 30 yrs
- 17 days/yr
Wind risk 6/10 · Moderate
- Chance of severe wind over 30 yrs
- 55.0%
Air-quality risk 2/10 · Minimal
- Unhealthy air days now
- 1 days/yr
- Unhealthy air days in 30 yrs
- 2 days/yr
Risk factors via First Street. Map © Google.
Why this score? — see what drove the D+ grade
The composite is a weighted blend of 9 inputs, each scored 0–100. Each bar is that input's sub-score; the figure is the points it added to the 100-point composite (weight × sub-score).
- ARV discount +15.0/15.0
- Cash flow +13.9/30.0
- Schools +4.9/10.0
- DSCR +4.2/10.0
- 1% rule +3.1/10.0
- Rent growth +2.5/5.0
- Livability +2.5/5.0
- Condition / age +2.5/5.0
- Appreciation +0.0/10.0
$270,000
🖨 Deal sheet (PDF) 📄 Offer letter ✓ Due diligence
Listing remarks MLS
Adorable ranch on almost an acre lot. Vaulted ceilings in family room with fireplace. Bay window in dining area. Above ground swimming pool off the oversized deck. Large fenced back yard for your children and/or pets to enjoy.
Key facts
- 0.91 acre lot
- Built 1998
- Listed 27 days
Property features AI
Finance
- Other: Lot approximately 0.91 acre (R-30 zoning)
- HOA & community: Annual association fee of $85 through Sentry Management; Association does not include additional services
Exterior
- Utilities: Public water; Septic tank sewer
- Home design: Single-story house; Vinyl siding
- Construction: Vinyl siding construction; Built as a house
- Exterior features: Shingle roof
Interior
- Bedrooms: Three bedrooms (all on the main level)
- Flooring: Laminate; Vinyl
- Bathrooms: Two full bathrooms
- Heating & cooling: Heat pump heating; Central air conditioning
- Interior features: Laminate and vinyl flooring
Neighborhood map
What this means for you Summary
Snapshot
- This is a 3-bed/2.0-bath single-family listed at $270k.
Deal economics
- At list price, monthly cash flow is $27 ($327/yr) — positive.
- The deal already cash-flows at list — no discount required.
- To meet the 1% rule (rent ≥ 1% of price), the offer needs to be $218k (19.3% below list).
- Recommended offer: $218k (19.3% below list) — sets the bar for 1% rule.
- Cap rate 6.4% vs local median 3.0% in Fuquay-Varina — top-decile yield for the area; either an underpriced asset or a hidden risk that comps aren't pricing in. Stress-test before assuming the spread holds.
Location & tenants
- Location reads: area grade D — affects rentability + tenant quality, not the cash-flow math above.
- Wake County Schools (suburban): math 52% / reading 60% proficiency, ranked #35 of 178 in NC (top 20%) — acceptable for families but not a draw, mixed tenant base, ~2y average lease.
- Zoned schools: Banks Road Elementary (math 42% / reading 52%, grade D-, #497 of 1,410 statewide, top 38%, 648 students, 43% FRL); West Lake Middle (math 47% / reading 56%, grade C, #103 of 475 statewide, top 22%, 877 students, 40% FRL); Willow Spring High (1,477 students, 30% FRL).
- Market conditions: 252 active listings in the ZIP; 3 comparable units currently listed for rent nearby; rentals at typical pace (median 26d on market — plan ~3-4 weeks tenant-placement turnaround); solid renter incomes; 15,249 units permitted in Wake County in 2024 (5,568 in 5+ unit buildings).
Forward outlook
- Local home prices are declining (-3.0%/yr); year-one equity from $2k of loan paydown is wiped out by about $8k of value loss. Plan a longer hold.
- Wake County population projected at +51% by 2050 — long-run rental-demand tailwind backs the buy-and-hold thesis.
Negotiation context
- It's been on market 27 days — a 2% lower offer ($266k) is reasonable based on typical stale-listing flexibility.
- 3 sale attempts since 17y ago with the ask held roughly flat each time — persistent listings suggest the price (not the market) is what's stuck; bring a comps-based counter.
- Current owner paid $55k; list at $270k implies a 391% gain — meaningful room to come down on a strong offer.
Risks & watch-outs
- Climate carrying-cost: major wind risk, 55% chance of damaging wind over 30y; extreme-heat days projected 7→17/yr by 2055 (HVAC capex compounding) — expect insurance premiums to compound above CPI over the hold.
Questions for the listing agent
- What does the HOA fee cover, when was the last increase, and are there any pending special assessments or reserve-fund shortfalls?
- Is there a deadline driving the sale (1031 exchange, divorce, estate, relocation)? That informs how much negotiation room exists.
- The area grade is low — what's the realistic commute time and amenity access for the typical tenant pool here? Any planned neighborhood developments (good or bad) we should know about?
- What's the average days-on-market for RENTAL listings here right now (not sales)? A rising rental-DOM trend means longer vacancies and softer asking-rent achievability than the comps imply.
- What's the recent tenant-quality profile in this submarket — average credit score on applications, eviction rate, late-payment / NSF rate, and stable-employment percentage? A property-management company in the area should have these aggregated.
- How much new for-sale + rental construction is in the pipeline within 1–3 miles? Heavy new supply typically softens prices + rents 12–24 months out; constrained supply supports both.
Investment metrics
- 1% rule
- 0.81% ✗
- Cap rate
- 6.41%
- Cash-on-cash
- 0.43%
- DSCR
- 1.02
- GRM
- 10.3
CMA / ARV
- ARV (on-the-fly)
- $335,340
- Comps found
- 3
Show comp detail 3 sales within ~0.75 mi
| Address | Dist | Beds/Ba | Sqft | Sold | Price | $/sf | Match |
|---|---|---|---|---|---|---|---|
| 1716 Middle Ridge Dr | 0.51mi | 3/2.0 | 1,564 (+13%) | 4mo | $375,000 | $240 | 51 |
| 6300 Silver Spring Ct | 0.61mi | 3/2.0 | 1,333 (-3%) | 21mo | $349,000 | $262 | 49 |
| 6204 Silver Spring Ct | 0.74mi | 3/2.0 | 1,584 (+15%) | 13mo | $385,000 | $243 | 30 |
Match score weights: distance 35% · size 25% · config 20% · recency 20%. Top-matched comps best support the ARV.
Projected returns pro-forma
-3.0% appreciation · 3.0% rent growth · sell at horizon
- IRR
- -15.6%
- Equity multiple
- 0.44×
- Total profit
- $-42,087
- Equity at exit
- $40,258
- IRR
- -7.2%
- Equity multiple
- 0.54×
- Total profit
- $-34,709
- Equity at exit
- $23,345
Cash invested: $75,600 (down + closing). Projections, not guarantees.
Landlord ↔ Tenant lean methodology
- Overall (STATE)
- 85 Strongly Landlord-Friendly
- State North Carolina
- 85 Strongly Landlord-Friendly · R+3
- County
- — inherits STATE
- City
- — inherits STATE
ZIP-level market 27592
- Home prices YoY
- -17.9%
- Active inventory
- 252
- Price-to-rent
- 10.3×
Monthly cashflow live
- Estimated rent
- $2,178 medium interval (Pro) →
- Mortgage (P&I)
- −$1,416
- Tax from tax record
- −$158 /mo · $1,897/yr
- Insurance
- −$112
- HOA
- −$7
- Vacancy / Maint / Mgmt
- −$457
- Net cashflow
- $27
Break-even live
Sensitivity live
| Price | -10% $180 | -5% $104 | +0% $27 | +5% $-49 | +10% $-126 |
|---|---|---|---|---|---|
| Rent | -10% $-145 | -5% $-59 | +0% $27 | +5% $113 | +10% $199 |
| Rate | -1.0pp $163 | -0.5pp $96 | base $27 | +0.5pp $-43 | +1.0pp $-114 |
UW: 25.0% down · 7.5% · 30yr · 1.5% tax · 5.0% vac · 8.0% maint · 8.0% mgmt
Financing live
Cash to close
- Down payment
- $67,500
- Closing costs
- $8,100
- Reserves months
- —
- Total cash needed
- —
Loan-product check · same deal, 3 products live
Conventional
25% down · 7.5% · 30yr
- Down + closing
- —
- Monthly P&I
- —
- Monthly cashflow
- —
- DSCR
- —
- Eligible?
- —
Personal DTI + credit; lowest rate.
DSCR
20% down · 8.5% · 30yr
- Down + closing
- —
- Monthly P&I
- —
- Monthly cashflow
- —
- DSCR
- —
- Eligible?
- —
No personal income docs; deal must DSCR.
Hard money
10% down · 12.0% · 12mo
- Down + closing
- —
- Monthly P&I
- —
- Monthly cashflow
- —
- DSCR
- —
- Eligible?
- —
Short-term bridge; refi at stabilization.
Rent comps 3 comps
| Address | Beds | Baths | Sqft | Rent | $/sqft | DOM | Units | Dist |
|---|---|---|---|---|---|---|---|---|
| 1421 Tawny View Ln Raleigh, NC | 3.0 | 2.0 | 1565 | $1,995 | $1.27 | 25d | 1 | 0.50mi |
| 10917 Fanny Brown Rd Raleigh, NC | 3.0 | 2.0 | 1315 | $1,995 | $1.52 | 19d | 1 | 0.67mi |
| 2724 Quail Point Dr Raleigh, NC | 3.0 | 2.0 | 1234 | $2,200 | $1.78 | 25d | 1 | 1.46mi |
HOA detail
- Monthly dues
- $7 · $84/yr
- Likely covers
- pool
Listing history 17 events
-
2026-06-13statusdays on market $270,000 Pending 27 DOM
-
2026-06-09days on market $270,000 Active 25 DOM
-
2026-06-08days on market $270,000 Active 24 DOM
-
2026-06-07days on market $270,000 Active 23 DOM
-
2026-06-05days on market $270,000 Active 20 DOM
-
2026-06-03days on market $270,000 Active 19 DOM
-
2026-06-02days on market $270,000 Active 18 DOM
-
2026-06-01days on market $270,000 Active 17 DOM
-
2026-05-31days on market $270,000 Active 16 DOM
-
2026-05-15$275,000 Active
-
2025-11-26soldstatus $55,000
-
2010-01-15soldstatus $131,250 226-char remark
Show marketing remark (226 chars)
Adorable ranch on almost an acre lot. Vaulted ceilings in family room with fireplace. Bay window in dining area. Above ground swimming pool off the oversized deck. Large fenced back yard for your children and/or pets to enjoy.
-
2010-01-15soldstatus $131,500
Show marketing remark (226 chars)
Adorable ranch on almost an acre lot. Vaulted ceilings in family room with fireplace. Bay window in dining area. Above ground swimming pool off the oversized deck. Large fenced back yard for your children and/or pets to enjoy.
-
2009-11-23historical 226-char remark
Show marketing remark (226 chars)
Adorable ranch on almost an acre lot. Vaulted ceilings in family room with fireplace. Bay window in dining area. Above ground swimming pool off the oversized deck. Large fenced back yard for your children and/or pets to enjoy.
-
2009-10-02$139,900 226-char remark
Show marketing remark (226 chars)
Adorable ranch on almost an acre lot. Vaulted ceilings in family room with fireplace. Bay window in dining area. Above ground swimming pool off the oversized deck. Large fenced back yard for your children and/or pets to enjoy.
-
2009-10-02$139,900 226-char remark
Show marketing remark (226 chars)
Adorable ranch on almost an acre lot. Vaulted ceilings in family room with fireplace. Bay window in dining area. Above ground swimming pool off the oversized deck. Large fenced back yard for your children and/or pets to enjoy.
ⓘ Source: listings_history table (triggers on properties + properties_extension) + one-shot
backfill from property_details.listing_events for pre-trigger history.
Tax reassessment forecast NC · Resets to sale price
- Current annual tax
- $1,897 · $158/mo
- Projected year-2 tax
- $2,214 · $184/mo
- Expected delta
- +$317/yr (+$26/mo · 16.7%)
ⓘ Screening estimate from a state-policy table — verify with the county assessor before closing.
Climate risk First Street
- Flood 1/10 Low FEMA zone X (unshaded) · 0% chance over 30 yrs
- Wildfire 3/10 Moderate
- Heat 6/10 Major 7 d/yr ≥105°F today · 17 d/yr by 30 yrs out
- Wind 6/10 Major 55% chance of damaging wind over 30 yrs
- Air quality 2/10 Low 1 unhealthy d/yr today · 2 by 30 yrs out
Nearby sold comps map
Loading sold comps map…
Walkable amenities ~0.75 mi
Loading nearby amenities…
Taxation est. · year 1
- Rental income
- $26,138
- − Mortgage interest
- −$15,124
- − Property taxes
- −$1,897
- − Insurance
- −$1,350
- − Repairs & maintenance
- −$2,091
- − Management
- −$2,091
- − HOA
- −$84
- − Depreciation
- −$7,855
- Taxable loss
- −$4,354
- Est. tax savings @ 24.0%
- +$1,045
- After-tax cash flow
- $1,372/yr
For passive investors: Depreciation is non-cash, so a rental often shows a tax loss while cash-flowing — sheltering income. Rental losses are passive: they offset passive income freely, and up to $25,000/yr can offset ordinary (W-2) income if you actively participate and your MAGI is under $100k (phasing out to $0 by $150k); unused losses carry forward. On sale, claimed depreciation is recaptured at up to 25%, and gains may owe capital-gains tax (a 1031 exchange can defer both). Figures are a year-1 estimate at your 24.0% rate — not tax advice; consult a CPA.
Schools (NCES district)
- District
- Wake County Schools
- NCES district ID
- 3704720
- Math proficiency
- 52% ▲ 2.00%
- Reading proficiency
- 60% ▲ 4.00%
- Median HH income
- $67,509
- Composite
- 49.41/100
- National rank
- #2010
- State rank
- #35 of 178 in NC
Livability — Fuquay-Varina
No livability data for this city. (Only ~50 U.S. cities are tracked.)
Census & demographics
- County
- Johnston County · 175,441 people
- Metro
- Raleigh-Cary, NC
- Population (ZIP)
- 21,114
- Household income
- $104,252
- Rent vs Own
- Severe rent burden
- 84.0
Population outlook (Wake County) Hauer SSP2
- Today (2025)
- 1,293,152 people
- By 2030
- 1,428,223 · +10.4%
- By 2040
- 1,698,188 · +31.3%
- By 2050
- 1,955,807 · +51.2%
- By 2075
- 2,520,273 · +94.9%
- By 2100
- 2,893,335 · +123.7%
Race, ethnicity, and origin ACS 2023
- Neighborhood character
- Predominantly White (75%)
- Race & ethnicity
- White 75% Hispanic / Latino 15% Two or more races 8% Black 6%
- Hispanic origin (detail)
- Mexican 10% Puerto Rican 1%
- Common ancestry
- Italian 5% Serbian 2% Slovak 2%
- Foreign-born
- 9% · Canada
- Languages at home
- 86% English-only · Spanish 11% German/W. Germanic 2%
Political lean MEDSL · Wake
- 2024 margin
- Strong D (+25.5) · D 61.9% · R 36.4% · Other 1.7%
- 2008→2024 swing
- +11.1pp toward D · 2008: 14.4pp · 2024: 25.5pp
- All cycles
- 2024: D+25.5 2020: D+26.4 2016: D+20.5 2012: D+10.2 2008: D+14.4
Not yet ingested
- Civics
- —
Market trends
- HPI YoY
- ▼ -55.54%
- Current HPI
- 254.0078
- Rent YoY
- —
- Metro
- Raleigh-Cary, NC
- State GDP YoY
- ▲ 3.28%
- F500 in state
- 26
Industry mix (Fortune 500 HQ in NC)
| Industry | F500 HQs | Revenue |
|---|---|---|
| Financial Services | 2 | $213B |
|
||
| Retail | 2 | $95B |
|
||
| Industrial Conglomerate | 1 | $38B |
|
||
| Metals / Steel | 1 | $35B |
|
||
| Utilities | 1 | $30B |
|
||
| Industrial Machinery | 1 | $19B |
|
||
Price history
+96.6% since first listed8 events — show timeline
- 2026-05-15 Listed $275,000 TMLS
- 2025-11-26 Sold (Public Records) $55,000 Public Records
- 2010-01-15 Sold (Public Records) $131,500 Public Records
- 2010-01-15 Sold (MLS) $131,250 AMLSNC
- 2010-01-15 Sold (MLS) $131,250 TMLS
- 2009-11-23 Listing Removed — TMLS
- 2009-10-02 Listed $139,900 AMLSNC
- 2009-10-02 Listed $139,900 TMLS
Property tax history
+6.0%/yrLatest (2025): $1,897 · +3.0% YoY. Source: county tax records.
Cash-flow waterfall
monthlySold comps — $/sqft
last 12 mo · ≤1 miLoading sold comps…