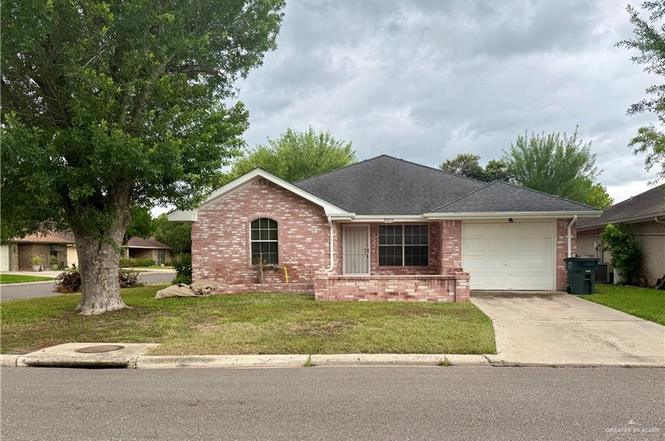
2312 Umbel St · Mission, TX
Flood risk 9/10 · Severe
- FEMA flood zone
- X
- Chance of flooding over 30 yrs
- 0.99%
- Est. flood insurance / yr
- $507 – $1,088
Fire risk 1/10 · Minimal
- Est. fire insurance / yr
- $1,222 – $2,270
Heat risk 9/10 · Severe
- Hot days now (above 111°F)
- 7 days/yr
- Hot days in 30 yrs
- 21 days/yr
Wind risk 8/10 · Major
- Chance of severe wind over 30 yrs
- 99.0%
Air-quality risk 2/10 · Minimal
- Unhealthy air days now
- 1 days/yr
- Unhealthy air days in 30 yrs
- 2 days/yr
Risk factors via First Street. Map © Google.
Why this score? — see what drove the D+ grade
The composite is a weighted blend of 9 inputs, each scored 0–100. Each bar is that input's sub-score; the figure is the points it added to the 100-point composite (weight × sub-score).
- Cash flow +13.9/30.0
- ARV discount +11.2/15.0
- 1% rule +4.8/10.0
- DSCR +4.2/10.0
- Livability +3.8/5.0
- Schools +3.4/10.0
- Rent growth +2.5/5.0
- Condition / age +2.5/5.0
- Appreciation +0.0/10.0
$175,000
🖨 Deal sheet (PDF) 📄 Offer letter ✓ Due diligence
Listing remarks MLS
Established, reputable 55+ community. Sitting on a nice corner lot, this great 2/2/1 home features a kitchen full of cabinets, beautiful wood laminate floors, large bedrooms and for extra living space, a relaxing enclosed patio. The cute and private backyard is the perfect retreat and also includes a storage shed.
Key facts
- Front patio deck
- Open concept living
- Plantation shutters
Tags
Property features AI
Finance
- Other: Listing provided by Grt Realty
- HOA & community: La Hacienda HOA (mandatory) with annual fee of $332; POA transfer fee applies; Community pool; Curbs in community; Senior community
Exterior
- Parking: Attached garage (1 car); 1 total covered parking space; Garage faces front
- Security: Smoke detectors
- Utilities: Public water; City sewer; Cable available; Electric service
- Home design: Brick construction; Composition shingle roof; Slab foundation
- Construction: Brick exterior; Slab foundation; Composition shingle roof
- Exterior features: Covered patio; Gutters / spouting; Mature trees; Sprinkler system; Corner lot; Curb and gutters; Paved road access; Wood fencing
Interior
- Kitchen: Dishwasher; Refrigerator; Electric smooth-top stove / range
- Flooring: Tile flooring
- Bathrooms: 2 full bathrooms
- Heating & cooling: Central heating (electric); Central air conditioning (electric)
- Interior features: Granite countertops; Ceiling fans; Decorative / high ceilings; Double-pane windows; Solar screens; Plantation shutters
- Laundry & utility: Washer / dryer connections; Washer / dryer connection located in the garage; Electric water heater in garage
Neighborhood map
What this means for you Summary
Snapshot
- This is a 3-bed/2.0-bath single-family listed at $175k.
Deal economics
- At list price, monthly cash flow is $-47 ($-569/yr) — negative.
- To cash-flow at today's rent, offer at most $167k (4.8% below list).
- To meet the 1% rule (rent ≥ 1% of price), the offer needs to be $171k (2.0% below list).
- Recommended offer: $167k (4.8% below list) — sets the bar for cash-flow.
- Cap rate 6.4% vs local median 3.5% in Mission — top-decile yield for the area; either an underpriced asset or a hidden risk that comps aren't pricing in. Stress-test before assuming the spread holds.
Location & tenants
- Location reads 75/100 on livability (#148 in TX, #4,155 nationally) — a middle-class / working-renter tenant base. Strengths: cost of living A+, housing A+, health & safety A+; Watch: amenities F, commute F, employment D-.
- Sharyland ISD (urban): math 34% / reading 44% proficiency, ranked #406 of 826 in TX (top 49%) — families likely to look elsewhere, expect single-tenant / working-renter base with shorter leases.
- Zoned schools: John H Shary El (math 27% / reading 36%, grade F, #2,396 of 4,322 statewide, top 56%, 649 students, 64% FRL); Sharyland North J H (math 46% / reading 42%, grade D, #512 of 1,662 statewide, top 32%, 806 students, 74% FRL); Sharyland H S (math 36% / reading 58%, grade D-, #591 of 1,632 statewide, top 38%, 1,546 students, 57% FRL).
- Market conditions: 477 active listings in the ZIP; 33 comparable units currently listed for rent nearby; rentals lingering (median 46d on market — plan ~5-8 weeks vacancy on turnover, expect pricing pressure); 52% of comp listings sitting > 30 days — soft ceiling on asking rent; 7,378 units permitted in Hidalgo County in 2024 (641 in 5+ unit buildings).
- This rent runs 39% of the median local income ($52k/yr) — at the standard rent-burdened threshold; future hikes will face affordability resistance.
Forward outlook
- Local home prices are declining (-3.0%/yr); year-one equity from $1k of loan paydown is wiped out by about $5k of value loss. Plan a longer hold.
- Hidalgo County population projected at +28% by 2050 — long-run rental-demand tailwind backs the buy-and-hold thesis.
Negotiation context
- Only 4 days on market — expect competitive offers; lowballing is unlikely to land.
- 2 sale attempts since 13y ago with the ask held roughly flat each time — persistent listings suggest the price (not the market) is what's stuck; bring a comps-based counter.
Risks & watch-outs
- Watch-outs: flood insurance adds $66/mo.
- Climate carrying-cost: severe flood risk; severe wind risk, 99% chance of damaging wind over 30y; extreme-heat days projected 7→21/yr by 2055 (HVAC capex compounding) — expect insurance premiums to compound above CPI over the hold.
Questions for the listing agent
- What do current leases actually rent for vs. the listed asking? Can we see a recent rent roll and the last 12 months of T-12 income?
- What's the actual annual flood-insurance premium (NFIP or private), and is the property in a SFHA with mandatory coverage?
- What does the HOA fee cover, when was the last increase, and are there any pending special assessments or reserve-fund shortfalls?
- Is there a deadline driving the sale (1031 exchange, divorce, estate, relocation)? That informs how much negotiation room exists.
- The area grade is low — what's the realistic commute time and amenity access for the typical tenant pool here? Any planned neighborhood developments (good or bad) we should know about?
- What's the average days-on-market for RENTAL listings here right now (not sales)? A rising rental-DOM trend means longer vacancies and softer asking-rent achievability than the comps imply.
- What's the recent tenant-quality profile in this submarket — average credit score on applications, eviction rate, late-payment / NSF rate, and stable-employment percentage? A property-management company in the area should have these aggregated.
- How much new for-sale + rental construction is in the pipeline within 1–3 miles? Heavy new supply typically softens prices + rents 12–24 months out; constrained supply supports both.
Investment metrics
- 1% rule
- 0.98% ✗
- Cap rate
- 6.42%
- Cash-on-cash
- 0.47%
- DSCR
- 1.02
- GRM
- 8.5
CMA / ARV
- ARV (on-the-fly)
- $190,530
- Comps found
- 12
Show comp detail 12 sales within ~0.75 mi
| Address | Dist | Beds/Ba | Sqft | Sold | Price | $/sf | Match |
|---|---|---|---|---|---|---|---|
| 2312 Yarrow St | 0.15mi | 2/2.0 (-1) | 1,303 (-1%) | 1mo | $195,000 | $150 | 86 |
| 2301 Wisteria Ave | 0.07mi | 2/2.0 (-1) | 1,300 (-1%) | 10mo | $180,000 | $138 | 82 |
| 1908 E 23rd St | 0.13mi | 2/2.0 (-1) | 1,264 (-4%) | 6mo | $169,000 | $134 | 78 |
| 2304 Garden View Dr | 0.16mi | 3/2.0 | 1,360 (+4%) | 11mo | $215,000 | $158 | 77 |
| 2303 Viola St | 0.05mi | 2/2.0 (-1) | 1,172 (-11%) | 5mo | $170,000 | $145 | 71 |
| 1905 E 23rd Pl | 0.10mi | 2/2.0 (-1) | 1,166 (-11%) | 2mo | $185,000 | $159 | 70 |
| 2405 Sundrop Ave | 0.16mi | 3/2.0 | 1,147 (-13%) | 11mo | $197,350 | $172 | 62 |
| 2215 Lilly Cv | 0.41mi | 3/2.0 | 1,440 (+10%) | 5mo | $229,500 | $159 | 61 |
| 1709 Jonquil Ave | 0.45mi | 3/2.0 | 1,485 (+13%) | 1mo | $195,000 | $131 | 57 |
| 1811 Crown Pointe Blvd | 0.55mi | 3/2.0 | 1,437 (+9%) | 10mo | $199,000 | $138 | 51 |
| 2207 E 21st St E | 0.62mi | 3/2.0 | 1,459 (+11%) | 3mo | $170,000 | $117 | 50 |
| 1810 Lauren Ln | 0.52mi | 3/2.0 | 1,504 (+14%) | 3mo | $203,500 | $135 | 49 |
Match score weights: distance 35% · size 25% · config 20% · recency 20%. Top-matched comps best support the ARV.
Projected returns pro-forma
-3.0% appreciation · 3.0% rent growth · sell at horizon
- IRR
- -18.1%
- Equity multiple
- 0.36×
- Total profit
- $-31,235
- Equity at exit
- $26,093
- IRR
- -10.2%
- Equity multiple
- 0.38×
- Total profit
- $-30,504
- Equity at exit
- $15,131
Cash invested: $49,000 (down + closing). Projections, not guarantees.
Landlord ↔ Tenant lean methodology
- Overall (STATE)
- 87 Strongly Landlord-Friendly
- State Texas
- 87 Strongly Landlord-Friendly · R+5
- County
- — inherits STATE
- City
- — inherits STATE
ZIP-level market 78574
- Home prices YoY
- -16.1%
- Active inventory
- 477
- Price-to-rent
- 8.5×
Monthly cashflow live
- Estimated rent
- $1,714 high interval (Pro) →
- Mortgage (P&I)
- −$918
- Tax from tax record
- −$317 /mo · $3,800/yr
- Insurance
- −$73
- Flood insurance flood zone
- −$66 /mo · $798/yr
- HOA
- −$28
- Vacancy / Maint / Mgmt
- −$360
- Net cashflow
- $-47
Break-even live
Sensitivity live
| Price | -10% $52 | -5% $2 | +0% $-47 | +5% $-97 | +10% $-147 |
|---|---|---|---|---|---|
| Rent | -10% $-183 | -5% $-115 | +0% $-47 | +5% $20 | +10% $88 |
| Rate | -1.0pp $41 | -0.5pp $-3 | base $-47 | +0.5pp $-93 | +1.0pp $-139 |
UW: 25.0% down · 7.5% · 30yr · 1.5% tax · 5.0% vac · 8.0% maint · 8.0% mgmt
Financing live
Cash to close
- Down payment
- $43,750
- Closing costs
- $5,250
- Reserves months
- —
- Total cash needed
- —
Loan-product check · same deal, 3 products live
Conventional
25% down · 7.5% · 30yr
- Down + closing
- —
- Monthly P&I
- —
- Monthly cashflow
- —
- DSCR
- —
- Eligible?
- —
Personal DTI + credit; lowest rate.
DSCR
20% down · 8.5% · 30yr
- Down + closing
- —
- Monthly P&I
- —
- Monthly cashflow
- —
- DSCR
- —
- Eligible?
- —
No personal income docs; deal must DSCR.
Hard money
10% down · 12.0% · 12mo
- Down + closing
- —
- Monthly P&I
- —
- Monthly cashflow
- —
- DSCR
- —
- Eligible?
- —
Short-term bridge; refi at stabilization.
Rent comps 33 comps
| Address | Beds | Baths | Sqft | Rent | $/sqft | DOM | Units | Dist |
|---|---|---|---|---|---|---|---|---|
| 2514 Yarrow St Mission, TX | 3.0 | 2.0 | 1682 | $2,700 | $1.61 | 25d | 1 | 0.29mi |
| 1901 N Glasscock Rd Lot 61 Mission, TX | 3.0 | 2.0 | 960 | $526 | $0.55 | 21d | 1 | 0.29mi |
| 1901 N Glasscock Rd Unit 17-A Mission, TX | 3.0 | 2.0 | 924 | $950 | $1.03 | 45d | 1 | 0.29mi |
| 2311 Dora Jeanne Dr Unit A Mission, TX | 2.0 | 2.0 | 975 | $950 | $0.97 | 45d | 1 | 0.32mi |
| 1500 E 24th St Unit B-6 Mission, TX | 2.0 | 2.0 | 1010 | $975 | $0.97 | 45d | 1 | 0.39mi |
| 1801 Crown Pointe Blvd Mission, TX | 3.0 | 2.0 | 1609 | $1,650 | $1.03 | 16d | 1 | 0.54mi |
| 2609 May Ave Mission, TX | 3.0 | 2.0 | 1670 | $1,800 | $1.08 | 45d | 1 | 0.61mi |
| 2201 E 21st St Mission, TX | 4.0 | 2.0 | 1529 | $1,850 | $1.21 | 16d | 1 | 0.61mi |
| 2203 E 19th St Mission, TX | 3.0 | 2.0 | 1856 | $2,300 | $1.24 | 25d | 1 | 0.69mi |
| 2200 E 19th St Mission, TX | 3.0 | 2.0 | 1829 | $1,950 | $1.07 | 45d | 1 | 0.70mi |
| 2614 E Solar Dr Mission, TX | 3.0 | 2.5 | 1492 | $3,000 | $2.01 | 25d | 1 | 0.76mi |
| 2505 E Solar Dr Mission, TX | 3.0 | 3.5 | 1550 | $2,300 | $1.48 | 45d | 1 | 0.81mi |
| 2401 E 27th St Mission, TX | 3.0 | 2.0 | 1727 | $1,850 | $1.07 | 25d | 1 | 0.95mi |
| 1827 Highland Park Ave Unit 1 Mission, TX | 2.0 | 2.0 | 1300 | $1,200 | $0.92 | 45d | 1 | 1.13mi |
| 1006 Fairway Dr Mission, TX | 2.0 | 2.0 | 1072 | $1,100 | $1.03 | 45d | 1 | 1.13mi |
| 2705 Mimosa St #8 Mission, TX | 2.0 | 2.0 | 1245 | $1,480 | $1.19 | 45d | 1 | 1.13mi |
| 1801 Highland Park Ave Mission, TX | 2.0 | 2.0 | 1173 | $1,500 | $1.28 | 21d | 1 | 1.15mi |
| 2715 Mimosa St #12 Mission, TX | 3.0 | 2.0 | 1408 | $1,350 | $0.96 | 16d | 1 | 1.16mi |
| 800 Ragland Rd Unit 9 Mission, TX | 2.0 | 2.0 | 913 | $1,150 | $1.26 | 45d | 1 | 1.20mi |
| 800 Ragland Rd Unit 10 Mission, TX | 3.0 | 2.0 | 1053 | $1,325 | $1.26 | 45d | 1 | 1.20mi |
| 1707 Highland Park Ave Unit 4-B Mission, TX | 2.0 | 2.0 | 1336 | $1,200 | $0.90 | 16d | 1 | 1.21mi |
| 2815 Mimosa St Mission, TX | 2.0 | 2.0 | 1154 | $1,088 | $0.94 | 16d | 1 | 1.21mi |
| 2004 Angus St Mission, TX | 3.0 | 2.0 | 1150 | $975 | $0.85 | 45d | 1 | 1.23mi |
| 3108 Highland Park Ave Mission, TX | 4.0 | 2.0 | 1400 | $1,800 | $1.29 | 21d | 1 | 1.24mi |
| 720 Ragland Rd #8 Mission, TX | 3.0 | 2.0 | 1053 | $1,300 | $1.23 | 25d | 1 | 1.25mi |
| 606 San Antonio Ave Unit 1 Mission, TX | 2.0 | 2.0 | 900 | $850 | $0.94 | 25d | 1 | 1.29mi |
| 606 San Antonio Ave Unit 606-4 Mission, TX | 2.0 | 1.0 | 900 | $850 | $0.94 | 45d | 1 | 1.30mi |
| 606 San Antonio Ave Unit 4 Mission, TX | 2.0 | 2.0 | 900 | $895 | $0.99 | 23d | 1 | 1.30mi |
| 600 San Antonio Ave Unit 7 Mission, TX | 2.0 | 2.0 | 900 | $880 | $0.98 | 45d | 1 | 1.32mi |
| 1511 Evergreen Ave Mission, TX | 3.0 | 2.0 | 1286 | $1,300 | $1.01 | 45d | 1 | 1.43mi |
| 607 Alameda Dr Mission, TX | 3.0 | 2.5 | 1731 | $2,200 | $1.27 | 46d | 1 | 1.45mi |
| 2225 Dorado Dr Mission, TX | 3.0 | 2.5 | 1839 | $2,100 | $1.14 | 23d | 1 | 1.46mi |
| 2313 Dorado Dr Mission, TX | 3.0 | 2.5 | 1800 | $2,100 | $1.17 | 45d | 1 | 1.49mi |
HOA detail
- Monthly dues
- $28 · $336/yr
Listing history 3 events
-
2026-06-22days on market $175,000 Active 4 DOM
-
2026-06-18remarks 699-char remark
-
2026-06-18$175,000 Active 1 DOM
ⓘ Source: listings_history table (triggers on properties + properties_extension) + one-shot
backfill from property_details.listing_events for pre-trigger history.
Tax reassessment forecast TX · Resets to sale price
- Current annual tax
- $3,800 · $317/mo
- Projected year-2 tax
- $3,800 · $317/mo
- Expected delta
- $0/yr ($0/mo · 0.0%)
ⓘ Screening estimate from a state-policy table — verify with the county assessor before closing.
Climate risk First Street
- Flood 9/10 Extreme FEMA zone X · 99% chance over 30 yrs
- Wildfire 1/10 Low
- Heat 9/10 Extreme 7 d/yr ≥111°F today · 21 d/yr by 30 yrs out
- Wind 8/10 Severe 99% chance of damaging wind over 30 yrs
- Air quality 2/10 Low 1 unhealthy d/yr today · 2 by 30 yrs out
Nearby sold comps map
Loading sold comps map…
Walkable amenities ~0.75 mi
Loading nearby amenities…
Taxation est. · year 1
- Rental income
- $20,572
- − Mortgage interest
- −$9,803
- − Property taxes
- −$3,800
- − Insurance
- −$1,672
- − Repairs & maintenance
- −$1,646
- − Management
- −$1,646
- − HOA
- −$336
- − Depreciation
- −$5,091
- Taxable loss
- −$3,422
- Est. tax savings @ 24.0%
- +$821
- After-tax cash flow
- $252/yr
For passive investors: Depreciation is non-cash, so a rental often shows a tax loss while cash-flowing — sheltering income. Rental losses are passive: they offset passive income freely, and up to $25,000/yr can offset ordinary (W-2) income if you actively participate and your MAGI is under $100k (phasing out to $0 by $150k); unused losses carry forward. On sale, claimed depreciation is recaptured at up to 25%, and gains may owe capital-gains tax (a 1031 exchange can defer both). Figures are a year-1 estimate at your 24.0% rate — not tax advice; consult a CPA.
Schools (NCES district)
- District
- Sharyland ISD
- NCES district ID
- 4839930
- Math proficiency
- 34% ▼ -35.00%
- Reading proficiency
- 44% ▼ -15.00%
- Median HH income
- $57,792
- Composite
- 34.38/100
- National rank
- #5214
- State rank
- #406 of 826 in TX
Livability — Mission
- Score
- 75/100
- State rank
- #148
- US rank
- #4155
Category grades
Schools grade is shown separately in the Schools card above.
Census & demographics
- Census place
- Mission, TX
- County
- Hidalgo County · 623,128 people
- City population
- 78,024
- Metro
- McAllen-Edinburg-Mission, TX
- Population (ZIP)
- 62,456
- Household income
- $52,393
- Rent vs Own
- Severe rent burden
- 803.0
Population outlook (Hidalgo County) Hauer SSP2
- Today (2025)
- 955,232 people
- By 2030
- 1,009,774 · +5.7%
- By 2040
- 1,120,332 · +17.3%
- By 2050
- 1,225,036 · +28.2%
- By 2075
- 1,439,189 · +50.7%
- By 2100
- 1,533,429 · +60.5%
Race, ethnicity, and origin ACS 2023
- Neighborhood character
- Predominantly Hispanic (97%)
- Race & ethnicity
- Hispanic / Latino 97% Two or more races 62% White 2%
- Hispanic origin (detail)
- Mexican 93%
- Foreign-born
- 33% · Canada
- Languages at home
- 12% English-only · Spanish 87%
Political lean MEDSL · Hidalgo
- 2024 margin
- Toss-up / Even · D 48.1% · R 51.0%
- 2008→2024 swing
- -41.6pp toward R · 2008: 38.7pp · 2024: -2.9pp
- All cycles
- 2024: R+2.9 2020: D+17.1 2016: D+40.5 2012: D+41.8 2008: D+38.7
Not yet ingested
- Civics
- —
Market trends
- HPI YoY
- ▼ -44.13%
- Current HPI
- 230.3323
- Rent YoY
- —
- Metro
- McAllen-Edinburg-Mission, TX
- State GDP YoY
- ▲ 3.95%
- F500 in state
- 110
Industry mix (Fortune 500 HQ in TX)
| Industry | F500 HQs | Revenue |
|---|---|---|
| Energy | 16 | $1,198B |
|
||
| Technology | 5 | $198B |
|
||
| Engineering / Construction | 4 | $72B |
|
||
| Energy Services | 3 | $60B |
|
||
| Utilities | 3 | $41B |
|
||
| Healthcare | 2 | $330B |
|
||
Price history
+96.6% since first listed10 events — show timeline
- 2026-06-17 Listed $175,000 MCALLENMLS
- 2018-06-05 Price Changed $82,000 MCALLENMLS
- 2014-08-04 Sold (Public Records) — Public Records
- 2014-07-29 Sold (MLS) — MCALLENMLS
- 2014-05-30 Delisted — MCALLENMLS
- 2014-05-30 Price Changed $89,000 MCALLENMLS
- 2013-11-20 Sold (Public Records) — Public Records
- 2013-03-26 Listed $89,000 MCALLENMLS
- 2003-04-22 Sold (Public Records) — Public Records
- 2001-03-20 Sold (Public Records) — Public Records
Property tax history
+4.5%/yrLatest (2025): $3,800 · +20.0% YoY. Source: county tax records.
Cash-flow waterfall
monthlySold comps — $/sqft
last 12 mo · ≤1 miLoading sold comps…