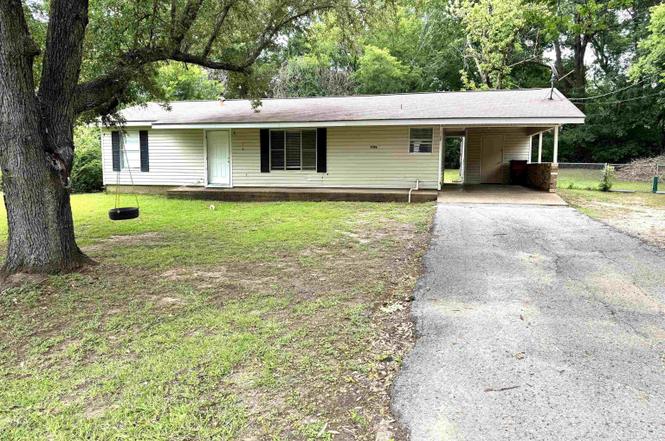
1138 Clay · Canton, TX
Flood risk 1/10 · Minimal
- FEMA flood zone
- X (unshaded)
- Chance of flooding over 30 yrs
- 0.0%
- Est. flood insurance / yr
- $507 – $1,088
Fire risk 3/10 · Minor
- Est. fire insurance / yr
- $1,222 – $2,270
Heat risk 6/10 · Moderate
- Hot days now (above 110°F)
- 7 days/yr
- Hot days in 30 yrs
- 24 days/yr
Wind risk 6/10 · Moderate
- Chance of severe wind over 30 yrs
- 50.0%
Air-quality risk 2/10 · Minimal
- Unhealthy air days now
- 0 days/yr
- Unhealthy air days in 30 yrs
- 1 days/yr
Risk factors via First Street. Map © Google.
Why this score? — see what drove the C+ grade
The composite is a weighted blend of 9 inputs, each scored 0–100. Each bar is that input's sub-score; the figure is the points it added to the 100-point composite (weight × sub-score).
- Cash flow +21.4/30.0
- ARV discount +14.3/15.0
- DSCR +6.8/10.0
- 1% rule +5.5/10.0
- Schools +4.4/10.0
- Livability +3.6/5.0
- Rent growth +2.5/5.0
- Condition / age +2.5/5.0
- Appreciation +0.0/10.0
$149,700
🖨 Deal sheet 📄 Offer letter ✓ Due diligence
Listing remarks MLS
Affordable home in established neighborhood. Convenient to schools and shopping.
Key facts
- 0.41 acre lot
- Parking
- Built 1972
Property features AI
Finance
- Financial info: Treat as clear loan type; No second mortgage
- HOA & community: No association
Exterior
- Parking: Attached carport (1 covered space); Driveway parking; 1 carport space
- Utilities: Municipal utility district: No; All-weather road utility noted
- Home design: Single-family residence; One story; Entry at main level
- Construction: Built in 1972; Pillar/post/pier foundation
- Exterior features: Less than half-acre lot (approximately 0.41 acre); All-weather road access; Directions: Turn on Big Rock from 243, left on Little Rock, right on Clay
Interior
- Kitchen: Dishwasher; Gas range; Refrigerator; Gas water heater
- Bedrooms: 3 bedrooms (primary bedroom on main level)
- Bathrooms: 1 full bathroom
- Heating & cooling: Central heating; Central air conditioning
- Interior features: Open floorplan; High-speed internet available; Two total rooms (living and dining areas)
- Laundry & utility: Washer hookup; Electric dryer hookup
Neighborhood map
What this means for you Summary
Snapshot
- This is a 3-bed/1.0-bath single-family listed at $150k.
Deal economics
- At list price, monthly cash flow is $221 ($3k/yr) — positive.
- The deal already cash-flows at list — no discount required.
- Meets the 1% rule at list price ($2k rent vs $150k).
- Cap rate 8.1% vs local median 3.0% in Canton — top-decile yield for the area; either an underpriced asset or a hidden risk that comps aren't pricing in. Stress-test before assuming the spread holds.
Location & tenants
- Location reads 72/100 on livability (#239 in TX) — a middle-class / working-renter tenant base. Strengths: cost of living A+, housing A+, health & safety A+; Watch: employment C-, amenities F, commute F.
- Canton ISD (town): math 49% / reading 55% proficiency, ranked #151 of 826 in TX (top 18%) — acceptable for families but not a draw, mixed tenant base, ~2y average lease.
- Zoned schools: Canton El (571 students, 57% FRL) — zoned schools average 57% FRL vs 40% district-wide (17 pts higher); higher-poverty schools than district average — tighter screening recommended.
- Market conditions: 259 active listings in the ZIP; 10 comparable units currently listed for rent nearby; rentals leasing fast (median 7d on market — plan ~1-2 weeks tenant-placement turnaround); 54 units permitted in Van Zandt County in 2024 (0 in 5+ unit buildings).
Forward outlook
- Local home prices are declining (-3.0%/yr); year-one equity from $1k of loan paydown is wiped out by about $4k of value loss. Plan a longer hold.
- Van Zandt County population projected at +4% by 2050 — modest demand growth; plan on rents tracking national, not racing it.
Negotiation context
- Only 8 days on market — expect competitive offers; lowballing is unlikely to land.
- 7 sale attempts since 5y ago with the ask held roughly flat each time — persistent listings suggest the price (not the market) is what's stuck; bring a comps-based counter.
Risks & watch-outs
- Climate carrying-cost: major wind risk, 50% chance of damaging wind over 30y; extreme-heat days projected 7→24/yr by 2055 (HVAC capex compounding) — expect insurance premiums to compound above CPI over the hold.
Questions for the listing agent
- Built in 1972 — when were the roof, HVAC, electrical panel, plumbing, and water heater last replaced?
- Is there a deadline driving the sale (1031 exchange, divorce, estate, relocation)? That informs how much negotiation room exists.
- Schools are D-rated, which usually means shorter tenancies and higher turnover. Who's the typical renter profile here, and what's been the actual vacancy rate?
- What's the average days-on-market for RENTAL listings here right now (not sales)? A rising rental-DOM trend means longer vacancies and softer asking-rent achievability than the comps imply.
- What's the recent tenant-quality profile in this submarket — average credit score on applications, eviction rate, late-payment / NSF rate, and stable-employment percentage? A property-management company in the area should have these aggregated.
- How much new for-sale + rental construction is in the pipeline within 1–3 miles? Heavy new supply typically softens prices + rents 12–24 months out; constrained supply supports both.
Investment metrics
- 1% rule
- 1.05% ✓
- Cap rate
- 8.06%
- Cash-on-cash
- 6.33%
- DSCR
- 1.28
- GRM
- 7.9
CMA / ARV
- ARV (on-the-fly)
- $176,352
- Comps found
- 10
Show comp detail 10 sales within ~0.75 mi
| Address | Dist | Beds/Ba | Sqft | Sold | Price | $/sf | Match |
|---|---|---|---|---|---|---|---|
| 1180 Clay St | 0.09mi | 2/1.0 (-1) | 1,000 (-5%) | 2mo | $150,000 | $150 | 80 |
| 1200/1190 Big Rock St | 0.20mi | 4/2.5 (+1) | 1,036 (-2%) | 0mo | $199,900 | $193 | 76 |
| 1135 Big Rock St | 0.10mi | 2/1.0 (-1) | 944 (-11%) | 6mo | $159,000 | $168 | 68 |
| 520 W Elm St | 0.17mi | 2/1.0 (-1) | 912 (-14%) | 6mo | $89,900 | $99 | 60 |
| 908 W State Highway 243 | 0.64mi | 3/2.0 | 1,148 (+9%) | 3mo | $189,900 | $165 | 49 |
| 558 E Elm St | 0.57mi | 2/1.0 (-1) | 1,034 (-2%) | 21mo | $139,000 | $134 | 47 |
| 512 W College St | 0.48mi | 3/2.0 | 1,120 (+6%) | 22mo | $170,000 | $152 | 45 |
| 711 Water Crest Cir | 0.56mi | 2/1.0 (-1) | 1,184 (+12%) | 9mo | $219,900 | $186 | 41 |
| 1470 Forrest Dr | 0.70mi | 2/1.5 (-1) | 1,130 (+7%) | 18mo | $195,000 | $173 | 33 |
| 856 Avenue A | 0.68mi | 3/2.0 | 1,197 (+13%) | 16mo | $199,900 | $167 | 28 |
Match score weights: distance 35% · size 25% · config 20% · recency 20%. Top-matched comps best support the ARV.
Projected returns pro-forma
-3.0% appreciation · 3.0% rent growth · sell at horizon
- IRR
- -6.5%
- Equity multiple
- 0.76×
- Total profit
- $-10,164
- Equity at exit
- $22,321
- IRR
- 3.1%
- Equity multiple
- 1.22×
- Total profit
- $9,349
- Equity at exit
- $12,943
Cash invested: $41,916 (down + closing). Projections, not guarantees.
Landlord ↔ Tenant lean methodology
- Overall (STATE)
- 87 Strongly Landlord-Friendly
- State Texas
- 87 Strongly Landlord-Friendly · R+5
- County
- — inherits STATE
- City
- — inherits STATE
ZIP-level market 75103
- Home prices YoY
- -14.3%
- Active inventory
- 259
- Price-to-rent
- 7.9×
Monthly cashflow live
- Estimated rent
- $1,579 high interval (Pro) →
- Mortgage (P&I)
- −$785
- Tax from tax record
- −$179 /mo · $2,146/yr
- Insurance
- −$62
- HOA
- −$0
- Vacancy / Maint / Mgmt
- −$332
- Net cashflow
- $221
Break-even live
UW: 25.0% down · 7.5% · 30yr · 1.5% tax · 5.0% vac · 8.0% maint · 8.0% mgmt
Financing live
Cash to close
- Down payment
- $37,425
- Closing costs
- $4,491
- Reserves months
- —
- Total cash needed
- —
Loan-product check · same deal, 3 products live
Conventional
25% down · 7.5% · 30yr
- Down + closing
- —
- Monthly P&I
- —
- Monthly cashflow
- —
- DSCR
- —
- Eligible?
- —
Personal DTI + credit; lowest rate.
DSCR
20% down · 8.5% · 30yr
- Down + closing
- —
- Monthly P&I
- —
- Monthly cashflow
- —
- DSCR
- —
- Eligible?
- —
No personal income docs; deal must DSCR.
Hard money
10% down · 12.0% · 12mo
- Down + closing
- —
- Monthly P&I
- —
- Monthly cashflow
- —
- DSCR
- —
- Eligible?
- —
Short-term bridge; refi at stabilization.
Rent comps 10 comps
| Address | Beds | Baths | Sqft | Rent | $/sqft | DOM | Units | Dist |
|---|---|---|---|---|---|---|---|---|
| 1107 Tower St Canton, TX | 3.0 | 1.5 | 1210 | $1,525 | $1.26 | 18d | 1 | 0.07mi |
| 1361 Shady Ln Canton, TX | 3.0 | 2.0 | 1262 | $1,600 | $1.27 | 1d | 1 | 0.19mi |
| 405 Beard St Canton, TX | 3.0 | 2.0 | 1147 | $1,675 | $1.46 | 7d | 1 | 0.28mi |
| 900 W State Highway 243 Canton, TX | 3.0 | 2.0 | 1087 | $1,750 | $1.61 | 1d | 1 | 0.61mi |
| 908 Texas 243 Canton, TX | 3.0 | 2.0 | 1148 | $1,750 | $1.52 | 1d | 1 | 0.63mi |
| 351 Mill Creek Rd Canton, TX | 2.0 | 1.0 | 875 | $1,200 | $1.37 | 43d | 1 | 0.63mi |
| 351 Mill Creek Rd Canton, TX | 2.0 | 1.0 | 875 | $1,200 | $1.37 | 1d | 1 | 0.63mi |
| 680 Cherry Creek Ln Canton, TX | 3.0 | 2.0 | 1244 | $1,700 | $1.37 | 1d | 1 | 0.82mi |
| 341 Dry Creek Ln Canton, TX | 3.0 | 2.0 | 1412 | $1,900 | $1.35 | 24d | 1 | 1.24mi |
| 519 Burnett Trl Canton, TX | 3.0 | 2.0 | 1294 | $1,900 | $1.47 | 22d | 1 | 1.25mi |
Listing history 7 events
-
2026-06-18days on market $149,700 Active 8 DOM
-
2026-06-17days on market $149,700 Active 7 DOM
-
2026-06-16days on market $149,700 Active 6 DOM
-
2026-06-15days on market $149,700 Active 5 DOM
-
2026-06-13days on market $149,700 Active 3 DOM
-
2026-06-13remarks 80-char remark
-
2026-06-13$149,700 Active 2 DOM
ⓘ Source: listings_history table (triggers on properties + properties_extension) + one-shot
backfill from property_details.listing_events for pre-trigger history.
Tax reassessment forecast TX · Resets to sale price
- Current annual tax
- $2,146 · $179/mo
- Projected year-2 tax
- $2,740 · $228/mo
- Expected delta
- +$594/yr (+$49/mo · 27.7%)
ⓘ Screening estimate from a state-policy table — verify with the county assessor before closing.
Climate risk First Street
- Flood 1/10 Low FEMA zone X (unshaded) · 0% chance over 30 yrs
- Wildfire 3/10 Moderate
- Heat 6/10 Major 7 d/yr ≥110°F today · 24 d/yr by 30 yrs out
- Wind 6/10 Major 50% chance of damaging wind over 30 yrs
- Air quality 2/10 Low 0 unhealthy d/yr today · 1 by 30 yrs out
Nearby sold comps map
Loading sold comps map…
Walkable amenities ~0.75 mi
Loading nearby amenities…
Taxation est. · year 1
- Rental income
- $18,945
- − Mortgage interest
- −$8,386
- − Property taxes
- −$2,146
- − Insurance
- −$748
- − Repairs & maintenance
- −$1,516
- − Management
- −$1,516
- − Depreciation
- −$4,355
- Taxable income
- $279
- Est. tax owed @ 24.0%
- −$67
- After-tax cash flow
- $2,585/yr
For passive investors: Depreciation is non-cash, so a rental often shows a tax loss while cash-flowing — sheltering income. Rental losses are passive: they offset passive income freely, and up to $25,000/yr can offset ordinary (W-2) income if you actively participate and your MAGI is under $100k (phasing out to $0 by $150k); unused losses carry forward. On sale, claimed depreciation is recaptured at up to 25%, and gains may owe capital-gains tax (a 1031 exchange can defer both). Figures are a year-1 estimate at your 24.0% rate — not tax advice; consult a CPA.
Schools (NCES district)
- District
- Canton ISD
- NCES district ID
- 4812750
- Math proficiency
- 49% ▼ -12.00%
- Reading proficiency
- 55% ▼ -1.00%
- Median HH income
- $46,385
- Composite
- 44.08/100
- National rank
- #2877
- State rank
- #151 of 826 in TX
Livability — Canton
- Score
- 72/100
- State rank
- #239
- US rank
- #5787
Category grades
Schools grade is shown separately in the Schools card above.
Census & demographics
- Census place
- Canton, TX
- Population (ZIP)
- 16,222
Population outlook (Van Zandt County) Hauer SSP2
- Today (2025)
- 55,634 people
- By 2030
- 56,479 · +1.5%
- By 2040
- 57,672 · +3.7%
- By 2050
- 57,913 · +4.1%
- By 2075
- 57,544 · +3.4%
- By 2100
- 52,659 · -5.3%
Race, ethnicity, and origin ACS 2023
- Neighborhood character
- Predominantly White (86%)
- Race & ethnicity
- White 86% Hispanic / Latino 7% Two or more races 5% Black 1%
- Hispanic origin (detail)
- Mexican 7%
- Common ancestry
- Lithuanian 2% Italian 1% Slovak 1%
- Foreign-born
- 2% · Canada
- Languages at home
- 95% English-only · Spanish 4%
Political lean MEDSL · Van Zandt
- 2024 margin
- Solid R (+74.8) · D 12.3% · R 87.2%
- 2008→2024 swing
- -19.8pp toward R · 2008: -55.1pp · 2024: -74.8pp
- All cycles
- 2024: R+74.8 2020: R+72.1 2016: R+72.1 2012: R+66.6 2008: R+55.1
Not yet ingested
- Civics
- —
Market trends
- HPI YoY
- ▼ -38.07%
- Current HPI
- 227.6156
- Rent YoY
- —
- Metro
- —
- State GDP YoY
- ▲ 3.95%
- F500 in state
- 110
Industry mix (Fortune 500 HQ in TX)
| Industry | F500 HQs | Revenue |
|---|---|---|
| Energy | 16 | $1,198B |
|
||
| Technology | 5 | $198B |
|
||
| Engineering / Construction | 4 | $72B |
|
||
| Energy Services | 3 | $60B |
|
||
| Utilities | 3 | $41B |
|
||
| Healthcare | 2 | $330B |
|
||
Price history
+52.8% since first listed36 events — show timeline
- 2026-06-11 Listed $149,700 GTAR
- 2026-06-09 Listed $149,700 NTREIS
- 2025-02-12 Listing Removed — NTREIS
- 2025-01-06 Price Changed $145,500 NTREIS
- 2025-01-06 Price Changed $145,500 GTAR
- 2024-12-18 Price Changed $146,500 NTREIS
- 2024-12-18 Price Changed $146,500 GTAR
- 2024-12-05 Price Changed $147,000 GTAR
- 2024-12-03 Price Changed $147,000 NTREIS
- 2024-11-12 Relisted — GTAR
- 2024-11-12 Relisted — NTREIS
- 2024-11-11 Pending — NTREIS
- 2024-11-01 Delisted — GTAR
- 2024-11-01 Contingent — NTREIS
- 2024-09-26 Price Changed $147,500 NTREIS
- 2024-09-26 Price Changed $147,500 GTAR
- 2024-09-03 Price Changed $148,500 NTREIS
- 2024-09-03 Price Changed $148,500 GTAR
- 2024-08-13 Price Changed $149,000 NTREIS
- 2024-08-13 Price Changed $149,000 GTAR
- 2024-07-23 Price Changed $149,500 NTREIS
- 2024-07-23 Price Changed $149,500 GTAR
- 2024-07-12 Price Changed $153,500 NTREIS
- 2024-07-12 Price Changed $153,500 GTAR
- 2024-07-01 Price Changed $154,500 GTAR
- 2024-06-29 Price Changed $154,500 NTREIS
- 2024-06-24 Price Changed $156,500 GTAR
- 2024-06-24 Price Changed $156,500 NTREIS
- 2024-06-19 Listed $159,000 GTAR
- 2024-05-31 Listed $159,000 NTREIS
- 2021-11-18 Sold (Public Records) — Public Records
- 2021-09-20 Sold (Public Records) — Public Records
- 2021-02-08 Listing Removed — NTREIS
- 2021-01-16 Listed $98,000 NTREIS
- 2009-10-22 Sold (Public Records) — Public Records
- 2002-01-24 Sold (Public Records) — Public Records
Property tax history
+5.4%/yrLatest (2025): $2,146 · +15.3% YoY. Source: county tax records.
Cash-flow waterfall
monthlySold comps — $/sqft
last 12 mo · ≤1 miLoading sold comps…