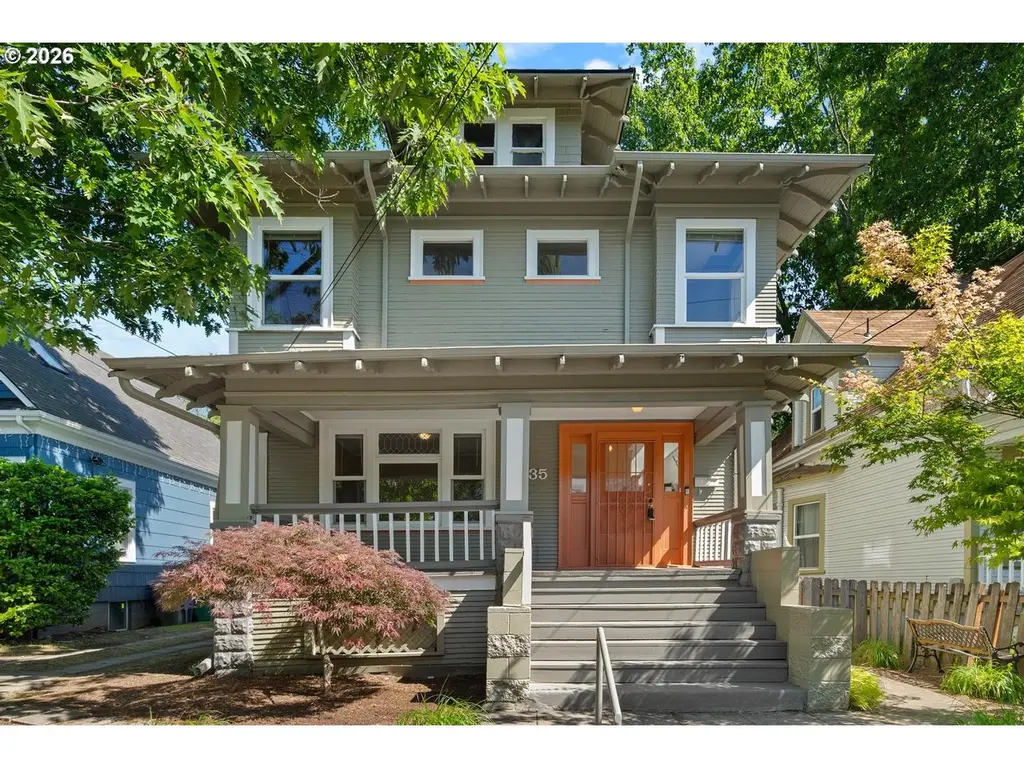
535 NE Knott St · Portland, OR
Flood risk 1/10 · Minimal
- FEMA flood zone
- X (unshaded)
- Chance of flooding over 30 yrs
- 0.0%
- Est. flood insurance / yr
- $473 – $860
Fire risk 1/10 · Minimal
- Est. fire insurance / yr
- $498 – $926
Heat risk 3/10 · Minor
- Hot days now (above 92°F)
- 7 days/yr
- Hot days in 30 yrs
- 14 days/yr
Wind risk 1/10 · Minimal
- Chance of severe wind over 30 yrs
- —
Air-quality risk 10/10 · Severe
- Unhealthy air days now
- 19 days/yr
- Unhealthy air days in 30 yrs
- 20 days/yr
Risk factors via First Street. Map © Google.
Why this score? — see what drove the C+ grade
The composite is a weighted blend of 9 inputs, each scored 0–100. Each bar is that input's sub-score; the figure is the points it added to the 100-point composite (weight × sub-score).
- Cash flow +21.9/30.0
- ARV discount +15.0/15.0
- DSCR +7.0/10.0
- 1% rule +4.7/10.0
- Schools +4.7/10.0
- Livability +3.9/5.0
- Rent growth +3.4/5.0
- Condition / age +2.5/5.0
- Appreciation +0.0/10.0
$589,000
🖨 Deal sheet 📄 Offer letter ✓ Due diligence
Listing remarks MLS
Opportunity awaits in this classic 1910 Craftsman in Portland's historic Albina neighborhood. Offering over 3,100 square feet, this property is full of original character and ready for its next chapter. Recent improvements include a brand new roof, new sewer line, siding repairs, and fresh exterior paint, providing a strong foundation for future renovations. Previously configured as three separate living spaces, the home features three electric meters and three hot water tanks, creating potential for a variety of living arrangements, including single family use or possible multi unit opportunities. Buyer to verify all intended uses. Inside, bring your imagination as the home is in need of updating and remodeling. Hardwood floors, generous room sizes, and classic architectural details offer plenty of inspiration. Conveniently located with easy access to downtown Portland, PDX Airport, major commuting routes, and an abundance of nearby restaurants, bars, shops, and neighborhood amenities. Home is being sold as is.
Key facts
- Classic craftsman
- Siding repairs
- Fresh exterior paint
Tags
Property features AI
Finance
- Other: Zoning: RM1
Exterior
- Parking: Off-street and on-street parking; Detached 1-car garage
- Utilities: Public water; Public sewer; Gas fuel; Green certified
- Home design: Single-family residence (residential); Fixer condition; Approximately 3,111 total building area (various level breakdowns); No notable view
- Construction: Built in 1910; Composition roof; Concrete perimeter foundation
- Exterior features: Porch; Storm doors; Tool shed; Yard; Wood siding; Paved road access; Level lot
Interior
- Kitchen: Dishwasher; Free-standing range; Free-standing refrigerator; Kitchen with vinyl flooring (main level); Second kitchen on upper level with vaulted ceiling
- Bedrooms: Primary bedroom on upper level; Second bedroom on upper level; Third bedroom on upper level; Fourth bedroom on main level; Fifth bedroom on lower level
- Flooring: Hardwood floors in multiple rooms (living, dining, family, some bedrooms); Vinyl flooring in kitchen; Wall-to-wall carpet in several bedrooms
- Bathrooms: Total 4 bathrooms (3 full, 1 partial); One full bath on upper level; One full bath on main level; One full and one partial bath on lower level
- Heating & cooling: Wall heater; Window cooling units
- Interior features: Ceiling fans; Hardwood floors; Vinyl flooring; Wall-to-wall carpet; Laundry area; Washer and dryer included; Separate living quarters / auxiliary apartment; Accessibility: main-floor bedroom with bath; Full, partially finished basement with storage space
- Laundry & utility: Washer and dryer included; Laundry area; Electric hot water
Neighborhood map
What this means for you Summary
Snapshot
- This is a 3-bed/3.0-bath single-family listed at $589k.
Deal economics
- At list price, monthly cash flow is $927 ($11k/yr) — positive.
- The deal already cash-flows at list — no discount required.
- To meet the 1% rule (rent ≥ 1% of price), the offer needs to be $569k (3.4% below list).
- Recommended offer: $569k (3.4% below list) — sets the bar for 1% rule.
- Cap rate 8.2% vs local median 2.2% in Portland — top-decile yield for the area; either an underpriced asset or a hidden risk that comps aren't pricing in. Stress-test before assuming the spread holds.
Location & tenants
- Location reads 77/100 on livability (#72 in OR, #3,256 nationally) — a middle-class / working-renter tenant base. Strengths: amenities A+, commute A+, health & safety A+; Watch: crime F, cost of living F.
- Portland SD 1J (urban): math 46% / reading 58% proficiency, ranked #23 of 183 in OR (top 13%) — acceptable for families but not a draw, mixed tenant base, ~2y average lease.
- Zoned schools: Irvington Elementary School (228 students, 21% FRL); Harriet Tubman Middle School (360 students, 65% FRL); Grant High School (2,156 students, 14% FRL) — zoned schools at 33% FRL track the district average.
- Market conditions: Rents rising (+3.5%/yr); 128 active listings in the ZIP; 13 comparable units currently listed for rent nearby; rentals at typical pace (median 24d on market — plan ~3-4 weeks tenant-placement turnaround); high-income renter base; 2,041 units permitted in Multnomah County in 2024 (905 in 5+ unit buildings).
- At $5,692/mo this rent would consume 52% of the median local household income ($132k/yr) (locally 1001% of renters already pay >50% of income on rent) — very limited rent-growth headroom before tenants either downsize or default.
Forward outlook
- Local home prices are declining (-3.0%/yr); year-one equity from $4k of loan paydown is wiped out by about $18k of value loss. Plan a longer hold.
- Multnomah County population projected at +33% by 2050 — long-run rental-demand tailwind backs the buy-and-hold thesis.
Negotiation context
- It's been on market 17 days — a 2% lower offer ($580k) is reasonable based on typical stale-listing flexibility.
- 2 sale attempts with the ask held roughly flat each time — persistent listings suggest the price (not the market) is what's stuck; bring a comps-based counter.
Risks & watch-outs
- Watch-outs: built in 1910 — expect roof / HVAC / electrical / plumbing capex.
Questions for the listing agent
- Built in 1910 — when were the roof, HVAC, electrical panel, plumbing, and water heater last replaced?
- Is there a deadline driving the sale (1031 exchange, divorce, estate, relocation)? That informs how much negotiation room exists.
- Crime grade is F in this area — have there been break-ins, vandalism, or insurance claims at this property in the last 3 years? What carrier currently insures it and at what premium?
- What's the average days-on-market for RENTAL listings here right now (not sales)? A rising rental-DOM trend means longer vacancies and softer asking-rent achievability than the comps imply.
- What's the recent tenant-quality profile in this submarket — average credit score on applications, eviction rate, late-payment / NSF rate, and stable-employment percentage? A property-management company in the area should have these aggregated.
- How much new for-sale + rental construction is in the pipeline within 1–3 miles? Heavy new supply typically softens prices + rents 12–24 months out; constrained supply supports both.
Investment metrics
- 1% rule
- 0.97% ✗
- Cap rate
- 8.18%
- Cash-on-cash
- 6.74%
- DSCR
- 1.30
- GRM
- 8.6
CMA / ARV
- ARV (on-the-fly)
- $826,119
- Comps found
- 12
Show comp detail 12 sales within ~0.75 mi
| Address | Dist | Beds/Ba | Sqft | Sold | Price | $/sf | Match |
|---|---|---|---|---|---|---|---|
| 623 NE Sacramento St | 0.18mi | 3/2.0 | 2,659 (+6%) | 3mo | $675,000 | $254 | 76 |
| 3444 NE 16th Ave | 0.66mi | 4/3.0 (+1) | 2,501 (-0%) | 2mo | $826,000 | $330 | 62 |
| 2002 NE 13th Ave | 0.52mi | 3/2.0 | 2,376 (-5%) | 2mo | $824,378 | $347 | 61 |
| 1136 NE Siskiyou St | 0.35mi | 3/2.0 | 2,231 (-11%) | 2mo | $710,000 | $318 | 59 |
| 318 N Fremont St | 0.61mi | 4/2.0 (+1) | 2,580 (+3%) | 4mo | $650,000 | $252 | 54 |
| 3343 NE 11th Ave | 0.43mi | 4/3.0 (+1) | 2,220 (-12%) | 5mo | $915,000 | $412 | 52 |
| 832 NE Failing St | 0.59mi | 4/3.0 (+1) | 2,247 (-10%) | 0mo | $740,000 | $329 | 50 |
| 3623 NE 17th Ave | 0.72mi | 4/1.0 (+1) | 2,430 (-3%) | 2mo | $550,000 | $226 | 46 |
| 3025 NE 17th Ave | 0.57mi | 4/5.0 (+1) | 2,743 (+9%) | 0mo | $905,000 | $330 | 45 |
| 1809 NE Klickitat St | 0.70mi | 4/3.0 (+1) | 2,739 (+9%) | 3mo | $1,210,000 | $442 | 45 |
| 3820 N Haight Ave | 0.74mi | 4/3.0 (+1) | 2,856 (+14%) | 2mo | $752,500 | $263 | 36 |
| 1845 NE Tillamook St | 0.72mi | 3/4.0 | 2,887 (+15%) | 3mo | $900,000 | $312 | 35 |
Match score weights: distance 35% · size 25% · config 20% · recency 20%. Top-matched comps best support the ARV.
Projected returns pro-forma
-3.0% appreciation · 3.49% rent growth · sell at horizon
- IRR
- -5.5%
- Equity multiple
- 0.79×
- Total profit
- $-33,824
- Equity at exit
- $87,822
- IRR
- 4.7%
- Equity multiple
- 1.35×
- Total profit
- $57,331
- Equity at exit
- $50,926
Cash invested: $164,920 (down + closing). Projections, not guarantees.
Landlord ↔ Tenant lean methodology
- Overall (CITY)
- 0 Strongly Tenant-Friendly
- State Oregon
- 28 Tenant-Leaning · D+6
- County
- — inherits STATE
- City Portland
- 0 Strongly Tenant-Friendly · D+39
ZIP-level market 97212
- Rents YoY
- 3.5%
- Active inventory
- 128
- Price-to-rent
- 8.6×
Monthly cashflow live
- Estimated rent
- $5,692 high interval (Pro) →
- Mortgage (P&I)
- −$3,089
- Tax from tax record
- −$236 /mo · $2,829/yr
- Insurance
- −$245
- HOA
- −$0
- Vacancy / Maint / Mgmt
- −$1,195
- Net cashflow
- $927
Break-even live
UW: 25.0% down · 7.5% · 30yr · 1.5% tax · 5.0% vac · 8.0% maint · 8.0% mgmt
Financing live
Cash to close
- Down payment
- $147,250
- Closing costs
- $17,670
- Reserves months
- —
- Total cash needed
- —
Loan-product check · same deal, 3 products live
Conventional
25% down · 7.5% · 30yr
- Down + closing
- —
- Monthly P&I
- —
- Monthly cashflow
- —
- DSCR
- —
- Eligible?
- —
Personal DTI + credit; lowest rate.
DSCR
20% down · 8.5% · 30yr
- Down + closing
- —
- Monthly P&I
- —
- Monthly cashflow
- —
- DSCR
- —
- Eligible?
- —
No personal income docs; deal must DSCR.
Hard money
10% down · 12.0% · 12mo
- Down + closing
- —
- Monthly P&I
- —
- Monthly cashflow
- —
- DSCR
- —
- Eligible?
- —
Short-term bridge; refi at stabilization.
Rent comps 13 comps
| Address | Beds | Baths | Sqft | Rent | $/sqft | DOM | Units | Dist |
|---|---|---|---|---|---|---|---|---|
| 2605 NE 9th Ave Portland, OR | 3.0 | 2.0 | 2537 | $3,435 | $1.35 | 24d | 1 | 0.16mi |
| 140 NE Sacramento St Portland, OR | 3.0–5.0 | 3.5–5.0 | 2223 | $3,650 | $1.64 | 20d | 2 | 0.23mi |
| 1828 NE 1st Ave Portland, OR | 2.0 | 3.0 | 2400 | $1,362 | $0.57 | 17d | 1 | 0.45mi |
| 4622 NE Garfield Ave Unit 1309897P Portland, OR | 4.0 | 3.0 | 2497 | $13,231 | $5.30 | 43d | 1 | 1.03mi |
| 2823 NE Tillamook St Portland, OR | 4.0 | 2.0 | 3014 | $4,250 | $1.41 | 24d | 1 | 1.20mi |
| 1150 NW Quimby St #1912 Portland, OR | 3.0 | 2.5 | 2715 | $15,000 | $5.52 | 43d | 1 | 1.27mi |
| 26 NE 11th Ave Unit 1309845P Portland, OR | 3.0 | 2.0 | 2411 | $6,787 | $2.82 | 7d | 1 | 1.31mi |
| 5177 NE 14th Pl Unit 1271934P Portland, OR | 2.0–4.0 | 1.0–2.5 | 1764 | $7,904 | $4.48 | 10d | 2 | 1.33mi |
| 1235 N Prescott St Unit 1309834P Portland, OR | 4.0 | 2.0 | 1991 | $9,061 | $4.55 | 21d | 1 | 1.34mi |
| 348 NE 20th Ave Portland, OR | 3.0 | 2.0 | 1800 | $6,000 | $3.33 | 43d | 1 | 1.34mi |
| 875 NE 27th Ave Portland, OR | 3.0 | 1.0–2.0 | 1462 | $4,900 | $3.35 | 1d | 13 | 1.35mi |
| 5403 NE 11th Ave Portland, OR | 4.0 | 3.0 | 3725 | $4,200 | $1.13 | 43d | 1 | 1.43mi |
| 1902 E Burnside St Portland, OR | 3.0 | 2.0 | 2000 | $3,300 | $1.65 | 43d | 1 | 1.49mi |
Listing history 10 events
-
2026-06-15status $589,000 Pending 17 DOM
-
2026-06-15days on market $589,000 Active 17 DOM
-
2026-06-13days on market $589,000 Active 15 DOM
-
2026-06-09days on market $589,000 Active 11 DOM
-
2026-06-08days on market $589,000 Active 10 DOM
-
2026-06-07days on market $589,000 Active 9 DOM
-
2026-06-03days on market $589,000 Active 5 DOM
-
2026-06-02days on market $589,000 Active 4 DOM
-
2026-06-01days on market $589,000 Active 3 DOM
-
2026-05-31days on market $589,000 Active 2 DOM
ⓘ Source: listings_history table (triggers on properties + properties_extension) + one-shot
backfill from property_details.listing_events for pre-trigger history.
Tax reassessment forecast OR · Resets to sale price
- Current annual tax
- $2,829 · $236/mo
- Projected year-2 tax
- $5,713 · $476/mo
- Expected delta
- +$2,885/yr (+$240/mo · 102.0%)
ⓘ Screening estimate from a state-policy table — verify with the county assessor before closing.
Climate risk First Street
- Flood 1/10 Low FEMA zone X (unshaded) · 0% chance over 30 yrs
- Wildfire 1/10 Low
- Heat 3/10 Moderate 7 d/yr ≥92°F today · 14 d/yr by 30 yrs out
- Wind 1/10 Low
- Air quality 10/10 Extreme 19 unhealthy d/yr today · 20 by 30 yrs out
Nearby sold comps map
Loading sold comps map…
Walkable amenities ~0.75 mi
Loading nearby amenities…
Taxation est. · year 1
- Rental income
- $68,303
- − Mortgage interest
- −$32,993
- − Property taxes
- −$2,829
- − Insurance
- −$2,945
- − Repairs & maintenance
- −$5,464
- − Management
- −$5,464
- − Depreciation
- −$17,135
- Taxable income
- $1,473
- Est. tax owed @ 24.0%
- −$354
- After-tax cash flow
- $10,767/yr
For passive investors: Depreciation is non-cash, so a rental often shows a tax loss while cash-flowing — sheltering income. Rental losses are passive: they offset passive income freely, and up to $25,000/yr can offset ordinary (W-2) income if you actively participate and your MAGI is under $100k (phasing out to $0 by $150k); unused losses carry forward. On sale, claimed depreciation is recaptured at up to 25%, and gains may owe capital-gains tax (a 1031 exchange can defer both). Figures are a year-1 estimate at your 24.0% rate — not tax advice; consult a CPA.
Schools (NCES district)
- District
- Portland SD 1J
- NCES district ID
- 4110040
- Math proficiency
- 46% ▼ -2.00%
- Reading proficiency
- 58% ▼ -3.00%
- Median HH income
- $57,851
- Composite
- 47.1/100
- National rank
- #5112
- State rank
- #23 of 183 in OR
Livability — Portland
- Score
- 77/100
- State rank
- #72
- US rank
- #3256
Category grades
Schools grade is shown separately in the Schools card above.
Census & demographics
- Census place
- Portland, OR
- County
- Multnomah County · 786,692 people
- City population
- 774,334
- Metro
- Portland-Vancouver-Hillsboro, OR-WA
- Population (ZIP)
- 28,042
- Household income
- $131,932
- Rent vs Own
- Severe rent burden
- 1001.0
Population outlook (Multnomah County) Hauer SSP2
- Today (2025)
- 930,825 people
- By 2030
- 996,904 · +7.1%
- By 2040
- 1,121,379 · +20.5%
- By 2050
- 1,242,124 · +33.4%
- By 2075
- 1,464,431 · +57.3%
- By 2100
- 1,576,181 · +69.3%
Race, ethnicity, and origin ACS 2023
- Neighborhood character
- Predominantly White (76%)
- Race & ethnicity
- White 76% Two or more races 11% Hispanic / Latino 9% Black 6% Asian 3%
- Hispanic origin (detail)
- Mexican 5%
- Common ancestry
- Italian 4% Slovak 4% Lithuanian 3%
- Foreign-born
- 7% · Canada, China
- Languages at home
- 88% English-only · Spanish 5% Other Indo-European 2% French/Haitian/Cajun 1%
Political lean MEDSL · Multnomah
- 2024 margin
- Solid D (+62.1) · D 79.3% · R 17.2% · Other 3.5%
- 2008→2024 swing
- +6.0pp toward D · 2008: 56.1pp · 2024: 62.1pp
- All cycles
- 2024: D+62.1 2020: D+61.3 2016: D+58.3 2012: D+54.9 2008: D+56.1
Not yet ingested
- Civics
- —
Market trends
- HPI YoY
- ▼ -1048.78%
- Current HPI
- 312.3989
- Rent YoY
- ▲ 3.49%
- Metro
- Portland-Vancouver-Hillsboro, OR-WA
- State GDP YoY
- ▲ 2.05%
- F500 in state
- 2
Industry mix (Fortune 500 HQ in OR)
| Industry | F500 HQs | Revenue |
|---|---|---|
| Consumer Goods | 1 | $51B |
|
||
Price history
+0.0% since first listed2 events — show timeline
- 2026-05-29 Listed $589,000 RMLS
- 2026-05-29 Listed $589,000 RMLS
Property tax history
+4.4%/yrLatest (2025): $2,829 · +3.7% YoY. Source: county tax records.
Cash-flow waterfall
monthlySold comps — $/sqft
last 12 mo · ≤1 miLoading sold comps…