5300 NE 24 Ter #512 · Fort Lauderdale, FL
Flood risk 5/10 · Moderate
- FEMA flood zone
- X (shaded)
- Chance of flooding over 30 yrs
- 0.23%
- Est. flood insurance / yr
- $507 – $1,088
Fire risk 1/10 · Minimal
- Est. fire insurance / yr
- $947 – $1,759
Heat risk 10/10 · Severe
- Hot days now (above 106°F)
- 7 days/yr
- Hot days in 30 yrs
- 27 days/yr
Wind risk 10/10 · Severe
- Chance of severe wind over 30 yrs
- 99.0%
Air-quality risk 2/10 · Minimal
- Unhealthy air days now
- 1 days/yr
- Unhealthy air days in 30 yrs
- 2 days/yr
Risk factors via First Street. Map © Google.
Why this score? — see what drove the B- grade
The composite is a weighted blend of 9 inputs, each scored 0–100. Each bar is that input's sub-score; the figure is the points it added to the 100-point composite (weight × sub-score).
- Cash flow +25.4/30.0
- 1% rule +9.8/10.0
- DSCR +8.4/10.0
- ARV discount +7.5/15.0
- Schools +4.1/10.0
- Livability +4.1/5.0
- Rent growth +3.4/5.0
- Condition / age +2.5/5.0
- Appreciation +0.0/10.0
$245,000
🖨 Deal sheet (PDF) 📄 Offer letter ✓ Due diligence
Listing remarks
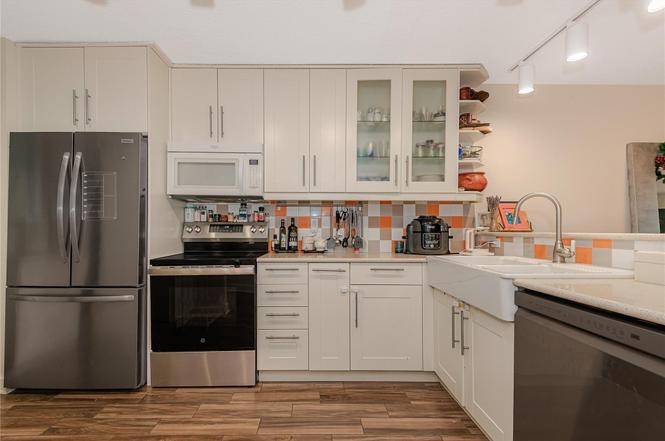
This sun-drenched top floor was just updated with new impact windows and door for safety and energy efficiency. All utilities are included in the maintenance fee, except electricity bill. Elevate your lifestyle with a stunning open kitchen with tons of counter space for prepping and hosting. Enjoy the peace of having no upstairs neighbors and a screened in balcony overlooking the tropical garden area. Laundry room is located immediately adjacent to the unit for maximum convenience. The meticulously maintained courtyard delivers an immediate tropical feel, complete with lush landscaping, colorful blooms, tranquil water features, pool, hot tub and waterfall. The condo is only a few minutes
Key facts
- Laundry room
- Screened in balcony
- New impact windows
Tags
Neighborhood map
What this means for you Summary
Snapshot
- This is a 2-bed/2.0-bath condo listed at $245k.
Deal economics
- At list price, monthly cash flow is $567 ($7k/yr) — positive.
- The deal already cash-flows at list — no discount required.
- Meets the 1% rule at list price ($4k rent vs $245k).
- Cap rate 9.1% vs local median 2.2% in Fort Lauderdale — top-decile yield for the area; either an underpriced asset or a hidden risk that comps aren't pricing in. Stress-test before assuming the spread holds.
Location & tenants
- Location reads 82/100 on livability (#78 in FL, #1,293 nationally) — a professional / high-income tenant draw. Strengths: crime A+, amenities A+, health & safety A+; Watch: cost of living D-.
- Broward (suburban): math 42% / reading 53% proficiency, ranked #46 of 73 in FL (top 63%) — families likely to look elsewhere, expect single-tenant / working-renter base with shorter leases.
- Market conditions: Rents rising (+3.6%/yr); 739 active listings in the ZIP; 40 comparable units currently listed for rent nearby; rentals at typical pace (median 25d on market — plan ~3-4 weeks tenant-placement turnaround); solid renter incomes; 2,111 units permitted in Broward County in 2024 (1,265 in 5+ unit buildings).
- At $3,616/mo this rent would consume 46% of the median local household income ($94k/yr) (locally 912% of renters already pay >50% of income on rent) — very limited rent-growth headroom before tenants either downsize or default.
Forward outlook
- Local home prices are declining (-3.0%/yr); year-one equity from $2k of loan paydown is wiped out by about $7k of value loss. Plan a longer hold.
- Broward County population projected at +34% by 2050 — long-run rental-demand tailwind backs the buy-and-hold thesis.
- At projected returns (-3.0% appreciation + 3.6% rent growth), your $69k cash investment doubles in ~10 years — after that, you're playing with house money.
Negotiation context
- Only 9 days on market — expect competitive offers; lowballing is unlikely to land.
Risks & watch-outs
- Climate carrying-cost: moderate flood risk; severe wind risk, 99% chance of damaging wind over 30y; extreme-heat days projected 7→27/yr by 2055 (HVAC capex compounding) — expect insurance premiums to compound above CPI over the hold.
Questions for the listing agent
- Built in 1976 — when were the roof, HVAC, electrical panel, plumbing, and water heater last replaced?
- What does the HOA fee cover, when was the last increase, and are there any pending special assessments or reserve-fund shortfalls?
- Any open or pending special assessments — roof, HVAC, plumbing, elevator, façade? What's the per-unit balance and payoff schedule, and is the seller paying it off at close or rolling it to the buyer?
- Is there a deadline driving the sale (1031 exchange, divorce, estate, relocation)? That informs how much negotiation room exists.
- Schools are B-rated — typically a magnet for longer-tenancy family renters. What's the average tenant stay here, and is there a school-zone premium baked into asking?
- What's the average days-on-market for RENTAL listings here right now (not sales)? A rising rental-DOM trend means longer vacancies and softer asking-rent achievability than the comps imply.
- What's the recent tenant-quality profile in this submarket — average credit score on applications, eviction rate, late-payment / NSF rate, and stable-employment percentage? A property-management company in the area should have these aggregated.
- How much new apartment / multifamily construction is in the pipeline within 1–3 miles? Heavy new supply (>2% of stock underway) typically softens rents 12–24 months out; light construction supports rent growth.
Investment metrics
- 1% rule
- 1.48% ✓
- Cap rate
- 9.07%
- Cash-on-cash
- 9.92%
- DSCR
- 1.44
- GRM
- 5.6
CMA / ARV
No comps found within radius.
Projected returns pro-forma
-3.0% appreciation · 3.63% rent growth · sell at horizon
- IRR
- -0.3%
- Equity multiple
- 0.99×
- Total profit
- $-851
- Equity at exit
- $36,530
- IRR
- 10.3%
- Equity multiple
- 1.83×
- Total profit
- $57,068
- Equity at exit
- $21,183
Cash invested: $68,600 (down + closing). Projections, not guarantees.
Landlord ↔ Tenant lean methodology
- Overall (STATE)
- 87 Strongly Landlord-Friendly
- State Florida
- 87 Strongly Landlord-Friendly · R+3
- County
- — inherits STATE
- City
- — inherits STATE
ZIP-level market 33308
- Rents YoY
- 3.6%
- Active inventory
- 739
- Price-to-rent
- 5.6×
Monthly cashflow live
- Estimated rent
- $3,616 high interval (Pro) →
- Mortgage (P&I)
- −$1,285
- Tax est. 1.5%
- −$306 /mo · $3,675/yr
- Insurance
- −$102
- HOA
- −$596
- Vacancy / Maint / Mgmt
- −$759
- Net cashflow
- $567
Break-even live
Sensitivity live
| Price | -10% $736 | -5% $652 | +0% $567 | +5% $483 | +10% $398 |
|---|---|---|---|---|---|
| Rent | -10% $282 | -5% $424 | +0% $567 | +5% $710 | +10% $853 |
| Rate | -1.0pp $691 | -0.5pp $629 | base $567 | +0.5pp $504 | +1.0pp $439 |
UW: 25.0% down · 7.5% · 30yr · 1.5% tax · 5.0% vac · 8.0% maint · 8.0% mgmt
Financing live
Cash to close
- Down payment
- $61,250
- Closing costs
- $7,350
- Reserves months
- —
- Total cash needed
- —
Loan-product check · same deal, 3 products live
Conventional
25% down · 7.5% · 30yr
- Down + closing
- —
- Monthly P&I
- —
- Monthly cashflow
- —
- DSCR
- —
- Eligible?
- —
Personal DTI + credit; lowest rate.
DSCR
20% down · 8.5% · 30yr
- Down + closing
- —
- Monthly P&I
- —
- Monthly cashflow
- —
- DSCR
- —
- Eligible?
- —
No personal income docs; deal must DSCR.
Hard money
10% down · 12.0% · 12mo
- Down + closing
- —
- Monthly P&I
- —
- Monthly cashflow
- —
- DSCR
- —
- Eligible?
- —
Short-term bridge; refi at stabilization.
Rent comps 40 comps
| Address | Beds | Baths | Sqft | Rent | $/sqft | DOM | Units | Dist |
|---|---|---|---|---|---|---|---|---|
| 2155 NE 56th Ct Fort Lauderdale, FL | 3.0 | 2.0 | 1500 | $3,500 | $2.33 | 25d | 1 | 0.40mi |
| 3111 NE 51st St Unit 301 Fort Lauderdale, FL | 2.0 | 2.0 | 1300 | $3,800 | $2.92 | 25d | 1 | 0.46mi |
| 4800 Bayview Dr #303 Fort Lauderdale, FL | 2.0 | 2.0 | 1032 | $3,500 | $3.39 | 25d | 1 | 0.46mi |
| 4804 NE 21st Ave #4804 Fort Lauderdale, FL | 2.0 | 2.0 | 1400 | $4,500 | $3.21 | 25d | 1 | 0.51mi |
| 3100 NE 48th St #908 Fort Lauderdale, FL | 2.0 | 2.0 | 1181 | $3,100 | $2.62 | 19d | 1 | 0.58mi |
| 3100 NE 48th St #908 Fort Lauderdale, FL | 2.0 | 2.0 | 1181 | $3,100 | $2.62 | 22d | 1 | 0.58mi |
| 2169 Imperial Point Dr Fort Lauderdale, FL | 2.0 | 2.0 | 1300 | $4,200 | $3.23 | 25d | 1 | 0.69mi |
| 2100 NE 45th St #1 Fort Lauderdale, FL | 3.0 | 3.5 | 1340 | $9,500 | $7.09 | 25d | 1 | 0.72mi |
| 233 Commercial Blvd Unit 1541802P Lauderdale-By-The-Sea, FL | 2.0 | 2.0 | 1291 | $3,876 | $3.00 | 3d | 1 | 0.81mi |
| 4511 Seagrape Dr Lauderdale by the Sea, FL | 2.0 | 2.0 | 1218 | $3,500 | $2.87 | 25d | 1 | 0.81mi |
| 4512 Sea Grape Dr Unit 1 Lauderdale-By-The-Sea, FL | 1.0 | 1.0 | 853 | $3,500 | $4.10 | 25d | 1 | 0.84mi |
| 4619 Poinciana St Unit 2A Lauderdale by the Sea, FL | 3.0 | 2.5 | 1452 | $3,900 | $2.69 | 16d | 1 | 0.87mi |
| 4764 NE 15th Way Oakland Park, FL | 3.0 | 2.0 | 1218 | $3,500 | $2.87 | 25d | 1 | 0.98mi |
| 1575 NE 47th St Oakland Park, FL | 3.0 | 2.0 | 1358 | $3,700 | $2.72 | 25d | 1 | 1.00mi |
| 4540 N Ocean Dr #210 Lauderdale by the Sea, FL | 2.0 | 2.0 | 1450 | $5,500 | $3.79 | 25d | 1 | 1.00mi |
| 4444 El Mar Dr #3404 Lauderdale by the Sea, FL | 2.0 | 2.0 | 1256 | $6,200 | $4.94 | 25d | 1 | 1.05mi |
| 6299 Bay Club Dr #4 Fort Lauderdale, FL | 2.0 | 2.0 | 1200 | $4,900 | $4.08 | 25d | 1 | 1.06mi |
| 2400 NE 65th St Fort Lauderdale, FL | 1.0–3.0 | 1.0–2.0 | 1103 | $2,814 | $2.55 | 2d | 16 | 1.07mi |
| 4900 N Ocean Blvd #1601 Lauderdale by the Sea, FL | 1.0 | 1.5 | 1000 | $4,000 | $4.00 | 25d | 1 | 1.10mi |
| 4900 N Ocean Blvd #1209 Lauderdale by the Sea, FL | 1.0 | 2.0 | 960 | $4,100 | $4.27 | 15d | 1 | 1.10mi |
| 4900 N Ocean Blvd #1003 Lauderdale by the Sea, FL | 2.0 | 2.0 | 1450 | $4,200 | $2.90 | 25d | 1 | 1.10mi |
| 4900 N Ocean Blvd #1405 Lauderdale by the Sea, FL | 2.0 | 2.0 | 1400 | $4,250 | $3.04 | 25d | 1 | 1.10mi |
| 4900 N Ocean Blvd #705 Lauderdale by the Sea, FL | 2.0 | 2.0 | 1400 | $4,750 | $3.39 | 25d | 1 | 1.10mi |
| 4013 N Ocean Dr #102 Fort Lauderdale, FL | 1.0 | 1.5 | 790 | $3,500 | $4.43 | 25d | 1 | 1.12mi |
| 4144 El Mar Dr Unit 1 Lauderdale-By-The-Sea, FL | 2.0 | 2.0 | 1116 | $3,250 | $2.91 | 25d | 1 | 1.13mi |
| 5000 N Ocean Blvd #1405 Lauderdale by the Sea, FL | 2.0 | 2.0 | 1433 | $5,250 | $3.66 | 8d | 1 | 1.15mi |
| 5000 N Ocean Blvd #703 Lauderdale by the Sea, FL | 2.0 | 2.0 | 1433 | $5,200 | $3.63 | 25d | 1 | 1.15mi |
| 5000 N Ocean Blvd #506 Lauderdale by the Sea, FL | 1.0 | 1.5 | 1080 | $3,900 | $3.61 | 25d | 1 | 1.15mi |
| 5000 N Ocean Blvd #208 Lauderdale by the Sea, FL | 2.0 | 2.0 | 1433 | $3,400 | $2.37 | 25d | 1 | 1.15mi |
| 5000 N Ocean Blvd #908 Lauderdale by the Sea, FL | 2.0 | 2.0 | 1433 | $3,940 | $2.75 | 18d | 1 | 1.15mi |
| 5000 N Ocean Blvd #908 Lauderdale by the Sea, FL | 2.0 | 2.0 | 1433 | $3,700 | $2.58 | 3d | 1 | 1.15mi |
| 5100 N Ocean Blvd #502 Lauderdale by the Sea, FL | 1.0 | 1.5 | 1080 | $3,400 | $3.15 | 25d | 1 | 1.17mi |
| 5100 N Ocean Blvd #1504 Lauderdale by the Sea, FL | 2.0 | 2.0 | 1400 | $4,000 | $2.86 | 3d | 1 | 1.17mi |
| 5100 N Ocean Blvd #804 Lauderdale by the Sea, FL | 2.0 | 2.0 | 1400 | $3,800 | $2.71 | 25d | 1 | 1.17mi |
| 5100 N Ocean Blvd #1205 Lauderdale by the Sea, FL | 2.0 | 2.0 | 1400 | $3,900 | $2.79 | 25d | 1 | 1.17mi |
| 1631 S Federal Hwy Pompano Beach, FL | 1.0–3.0 | 1.0–2.0 | 1092 | $2,694 | $2.47 | 2d | 17 | 1.19mi |
| 5200 N Ocean Blvd Unit 203B Lauderdale by the Sea, FL | 2.0 | 2.0 | 1330 | $3,200 | $2.41 | 25d | 1 | 1.21mi |
| 5200 N Ocean Blvd Unit 914A Lauderdale by the Sea, FL | 2.0 | 2.0 | 1450 | $5,000 | $3.45 | 25d | 1 | 1.21mi |
| 5200 N Ocean Blvd #506 Fort Lauderdale, FL | 2.0 | 2.0 | 1330 | $3,300 | $2.48 | 14d | 1 | 1.21mi |
| 1740 NE 64th St Fort Lauderdale, FL | 3.0 | 2.0 | 1364 | $4,800 | $3.52 | 4d | 1 | 1.22mi |
HOA detail condo
- Monthly dues
- $596 · $7,152/yr
- Likely covers
- waterelectriclandscapingpool
- Assessments
- None detected in remarks — confirm with the listing agent.
Listing history 2 events
-
2026-03-20status Pending
-
2025-11-26$245,000 Active
ⓘ Source: listings_history table (triggers on properties + properties_extension) + one-shot
backfill from property_details.listing_events for pre-trigger history.
Climate risk First Street
- Flood 5/10 Major FEMA zone X (shaded) · 23% chance over 30 yrs
- Wildfire 1/10 Low
- Heat 10/10 Extreme 7 d/yr ≥106°F today · 27 d/yr by 30 yrs out
- Wind 10/10 Extreme 99% chance of damaging wind over 30 yrs
- Air quality 2/10 Low 1 unhealthy d/yr today · 2 by 30 yrs out
Nearby sold comps map
Loading sold comps map…
Walkable amenities ~0.75 mi
Loading nearby amenities…
Taxation est. · year 1
- Rental income
- $43,387
- − Mortgage interest
- −$13,724
- − Property taxes
- −$3,675
- − Insurance
- −$1,225
- − Repairs & maintenance
- −$3,471
- − Management
- −$3,471
- − HOA
- −$7,152
- − Depreciation
- −$7,127
- Taxable income
- $3,542
- Est. tax owed @ 24.0%
- −$850
- After-tax cash flow
- $5,956/yr
For passive investors: Depreciation is non-cash, so a rental often shows a tax loss while cash-flowing — sheltering income. Rental losses are passive: they offset passive income freely, and up to $25,000/yr can offset ordinary (W-2) income if you actively participate and your MAGI is under $100k (phasing out to $0 by $150k); unused losses carry forward. On sale, claimed depreciation is recaptured at up to 25%, and gains may owe capital-gains tax (a 1031 exchange can defer both). Figures are a year-1 estimate at your 24.0% rate — not tax advice; consult a CPA.
Schools (NCES district)
- District
- Broward
- NCES district ID
- 1200180
- Math proficiency
- 42% ▼ -18.00%
- Reading proficiency
- 53% ▼ -5.00%
- Median HH income
- $52,139
- Composite
- 40.88/100
- National rank
- #3621
- State rank
- #46 of 73 in FL
Livability — Fort Lauderdale
- Score
- 82/100
- State rank
- #78
- US rank
- #1293
Category grades
Schools grade is shown separately in the Schools card above.
Census & demographics
- Census place
- Fort Lauderdale, FL
- County
- Broward County · 1,963,430 people
- City population
- 235,769
- Metro
- Miami-Fort Lauderdale-Pompano Beach, FL
- Population (ZIP)
- 27,935
- Household income
- $93,879
- Rent vs Own
- Severe rent burden
- 912.0
Population outlook (Broward County) Hauer SSP2
- Today (2025)
- 2,207,033 people
- By 2030
- 2,360,704 · +7.0%
- By 2040
- 2,661,208 · +20.6%
- By 2050
- 2,946,698 · +33.5%
- By 2075
- 3,602,273 · +63.2%
- By 2100
- 3,970,984 · +79.9%
Race, ethnicity, and origin ACS 2023
- Neighborhood character
- Predominantly White (75%)
- Race & ethnicity
- White 75% Hispanic / Latino 16% Two or more races 14% Asian 3% Black 2%
- Hispanic origin (detail)
- Puerto Rican 2% Cuban 3%
- Common ancestry
- Romanian 4% Lithuanian 3% Scotch-Irish 3%
- Foreign-born
- 24% · Canada, Jamaica, Dominican Republic
- Languages at home
- 75% English-only · Spanish 14% Other Indo-European 5% Russian/Polish/Slavic 2%
Political lean MEDSL · Broward
- 2024 margin
- D (+17.0) · D 58.0% · R 41.0%
- 2008→2024 swing
- -17.8pp toward R · 2008: 34.7pp · 2024: 17.0pp
- All cycles
- 2024: D+17.0 2020: D+29.8 2016: D+35.0 2012: D+34.9 2008: D+34.7
Not yet ingested
- Civics
- —
Market trends
- HPI YoY
- ▼ -417.95%
- Current HPI
- 325.3902
- Rent YoY
- ▲ 3.63%
- Metro
- Miami-Fort Lauderdale-Pompano Beach, FL
- State GDP YoY
- ▲ 3.28%
- F500 in state
- 36
Industry mix (Fortune 500 HQ in FL)
| Industry | F500 HQs | Revenue |
|---|---|---|
| Industrial Technology | 2 | $29B |
|
||
| Insurance | 2 | $17B |
|
||
| Retail | 1 | $60B |
|
||
| Technology Distribution | 1 | $58B |
|
||
| Homebuilding | 1 | $35B |
|
||
| Technology Manufacturing | 1 | $35B |
|
||
Price history
2 events — show timeline
- 2026-03-20 Pending — Beaches MLS
- 2025-11-26 Listed $245,000 Beaches MLS
Cash-flow waterfall
monthlySold comps — $/sqft
last 12 mo · ≤1 miLoading sold comps…