 🏷️ Likely Rental
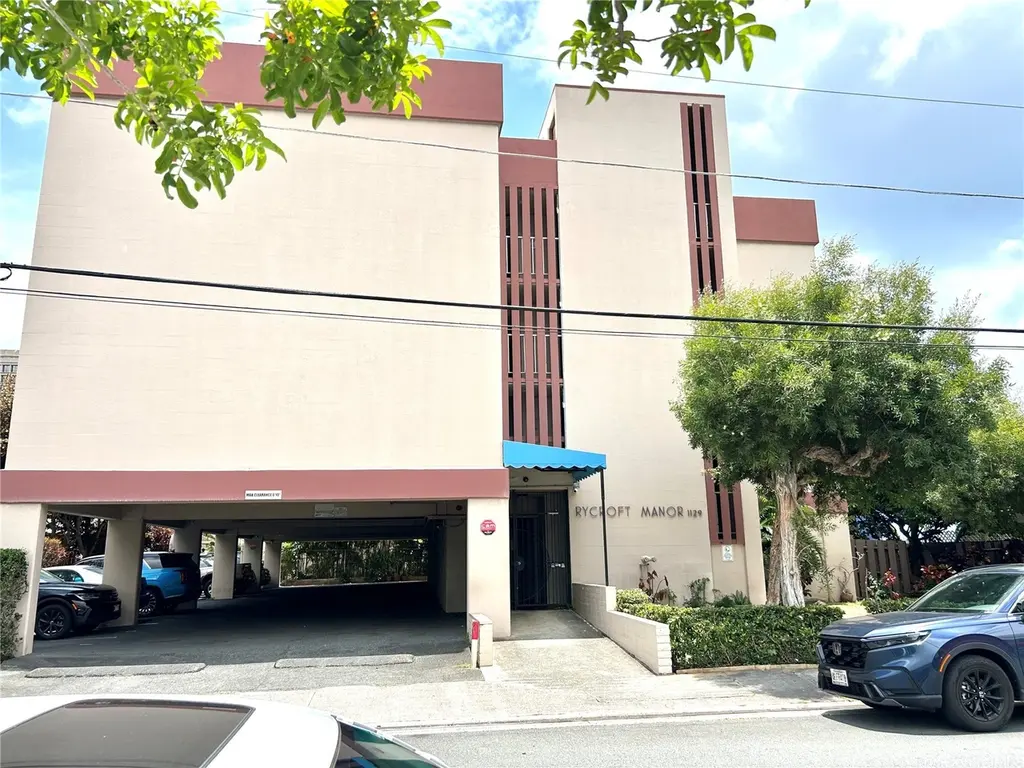
1129 Rycroft St #406 · Urban Honolulu, HI
Flood risk 6/10 · Moderate
- FEMA flood zone
- X (unshaded)
- Chance of flooding over 30 yrs
- 0.73%
- Est. flood insurance / yr
- $507 – $1,088
Fire risk No data
- Est. fire insurance / yr
- —
Heat risk No data
- Hot days now (above threshold)
- —
- Hot days in 30 yrs
- —
Wind risk No data
- Chance of severe wind over 30 yrs
- —
Air-quality risk 1/10 · Minimal
- Unhealthy air days now
- —
- Unhealthy air days in 30 yrs
- —
Risk factors via First Street. Map © Google.
Why this score? — see what drove the B- grade
The composite is a weighted blend of 9 inputs, each scored 0–100. Each bar is that input's sub-score; the figure is the points it added to the 100-point composite (weight × sub-score).
- Cash flow +24.5/30.0
- DSCR +7.9/10.0
- 1% rule +7.5/10.0
- ARV discount +7.5/15.0
- Appreciation +6.0/10.0
- Schools +3.7/10.0
- Rent growth +3.3/5.0
- Livability +2.5/5.0
- Condition / age +2.5/5.0
$270,000
🖨 Deal sheet 📄 Offer letter ✓ Due diligence
Listing remarks
RYCROFT MANOR #406 - is an affordable opportunity that adds comfort and style to a first time home buyer or investor. This 4-story walk up is conveniently located in the heart of Honolulu. It has 1 Bedroom (partitioned), 1 full bathroom and a lanai with sweeping views of the City. The community laundry room is on the first floor, it is a pet friendly (small pet-verify), with low maintenance fees. It is centrally located near Ala Moana Center and has countless dining and shopping options. It is tenant occupied on a month-to month currently rented for $1,300.00.
Key facts
- Low maintenance fees
- Sweeping views
- Centrally located
Tags
Property features AI
Finance
- Other: Pet policy: contact management
- HOA & community: Monthly maintenance fee: $510.90; Association fee covers water and sewer; Community amenities include deck/porch, patio, and laundry facilities
Exterior
- Security: Key card entry
- Utilities: Water included in association fee; Sewer included in association fee
- Home design: Located on entry level 4; Good condition; Condominium in Rycroft Manor
- Construction: Concrete construction
- Exterior features: Deck/porch; Patio; Has a view; Fee simple ownership
Interior
- Flooring: Laminate
- Bathrooms: 1 full bathroom
- Interior features: Partially furnished unit; Laminate flooring
- Laundry & utility: On-site laundry facilities (community)
Neighborhood map
What this means for you Summary
Snapshot
- This is a 1-bed/1.0-bath condo listed at $270k.
Deal economics
- At list price, monthly cash flow is $552 ($7k/yr) — positive.
- The deal already cash-flows at list — no discount required.
- Meets the 1% rule at list price ($3k rent vs $270k).
- Recommended offer: $262k (3.0% below list) — sets the bar for market timing.
- Cap rate 8.7% vs local median 1.5% in Urban Honolulu — top-decile yield for the area; either an underpriced asset or a hidden risk that comps aren't pricing in. Stress-test before assuming the spread holds.
Location & tenants
- Location reads: area grade B — affects rentability + tenant quality, not the cash-flow math above.
- Hawaii Department Of Education (suburban): math 32% / reading 50% proficiency, ranked #1 of 1 in HI (top 100%) — families likely to look elsewhere, expect single-tenant / working-renter base with shorter leases.
- Market conditions: Rents rising (+3.1%/yr); 549 active listings in the ZIP; 7 comparable units currently listed for rent nearby; rentals at typical pace (median 16d on market — plan ~3-4 weeks tenant-placement turnaround); solid renter incomes; 1,638 units permitted in Honolulu County in 2024 (793 in 5+ unit buildings).
- At $3,366/mo this rent would consume 52% of the median local household income ($78k/yr) (locally 1641% of renters already pay >50% of income on rent) — very limited rent-growth headroom before tenants either downsize or default.
Forward outlook
- In year one you build about $7k of equity ($2k loan paydown + $5k appreciation (2.0% local appreciation)).
- Honolulu County population projected at +17% by 2050 — long-run rental-demand tailwind backs the buy-and-hold thesis.
- At projected returns (2.0% appreciation + 3.1% rent growth), your $76k cash investment doubles in ~5 years — after that, you're playing with house money.
- By year 5, paydown + projected appreciation supports a ~$32k cash-out refi (75% LTV) — recoverable capital for the next deal without selling this one.
Negotiation context
- It's been on market 35 days — a 3% lower offer ($262k) is reasonable based on typical stale-listing flexibility.
- 5 sale attempts since 22y ago with the ask held roughly flat each time — persistent listings suggest the price (not the market) is what's stuck; bring a comps-based counter.
- Current owner paid $148k; list at $270k implies a 82% gain — meaningful room to come down on a strong offer.
Risks & watch-outs
- Climate carrying-cost: major flood risk — expect insurance premiums to compound above CPI over the hold.
Questions for the listing agent
- It's been on market 35 days. Have you received any prior offers? Is the seller open to a 3% concession, seller financing, or rate buy-down credit?
- Built in 1974 — when were the roof, HVAC, electrical panel, plumbing, and water heater last replaced?
- What does the HOA fee cover, when was the last increase, and are there any pending special assessments or reserve-fund shortfalls?
- Any open or pending special assessments — roof, HVAC, plumbing, elevator, façade? What's the per-unit balance and payoff schedule, and is the seller paying it off at close or rolling it to the buyer?
- Is there a deadline driving the sale (1031 exchange, divorce, estate, relocation)? That informs how much negotiation room exists.
- What's the average days-on-market for RENTAL listings here right now (not sales)? A rising rental-DOM trend means longer vacancies and softer asking-rent achievability than the comps imply.
- What's the recent tenant-quality profile in this submarket — average credit score on applications, eviction rate, late-payment / NSF rate, and stable-employment percentage? A property-management company in the area should have these aggregated.
- How much new apartment / multifamily construction is in the pipeline within 1–3 miles? Heavy new supply (>2% of stock underway) typically softens rents 12–24 months out; light construction supports rent growth.
Investment metrics
- 1% rule
- 1.25% ✓
- Cap rate
- 8.75%
- Cash-on-cash
- 8.76%
- DSCR
- 1.39
- GRM
- 6.7
CMA / ARV
- ARV (median comp)
- $573,948
- List price
- $270,000
- Delta
- -52.96%
- Verdict
- UNDERPRICED
- Comps
- 20 within 1.0 mi
Projected returns pro-forma
1.98% appreciation · 3.1% rent growth · sell at horizon
- IRR
- 13.2%
- Equity multiple
- 1.71×
- Total profit
- $53,879
- Equity at exit
- $106,151
- IRR
- 16.0%
- Equity multiple
- 3.14×
- Total profit
- $161,944
- Equity at exit
- $152,595
Cash invested: $75,600 (down + closing). Projections, not guarantees.
Landlord ↔ Tenant lean methodology
- Overall (STATE)
- 37 Tenant-Leaning
- State Hawaii
- 37 Tenant-Leaning · D+13
- County
- — inherits STATE
- City
- — inherits STATE
ZIP-level market 96814
- Home prices YoY
- 0.5%
- Rents YoY
- 3.1%
- Active inventory
- 549
- Price-to-rent
- 6.7×
Monthly cashflow live
- Estimated rent
- $3,366 high interval (Pro) →
- Mortgage (P&I)
- −$1,416
- Tax from tax record
- −$69 /mo · $822/yr
- Insurance
- −$112
- HOA
- −$510
- Vacancy / Maint / Mgmt
- −$707
- Net cashflow
- $552
Break-even live
UW: 25.0% down · 7.5% · 30yr · 1.5% tax · 5.0% vac · 8.0% maint · 8.0% mgmt
Financing live
Cash to close
- Down payment
- $67,500
- Closing costs
- $8,100
- Reserves months
- —
- Total cash needed
- —
Loan-product check · same deal, 3 products live
Conventional
25% down · 7.5% · 30yr
- Down + closing
- —
- Monthly P&I
- —
- Monthly cashflow
- —
- DSCR
- —
- Eligible?
- —
Personal DTI + credit; lowest rate.
DSCR
20% down · 8.5% · 30yr
- Down + closing
- —
- Monthly P&I
- —
- Monthly cashflow
- —
- DSCR
- —
- Eligible?
- —
No personal income docs; deal must DSCR.
Hard money
10% down · 12.0% · 12mo
- Down + closing
- —
- Monthly P&I
- —
- Monthly cashflow
- —
- DSCR
- —
- Eligible?
- —
Short-term bridge; refi at stabilization.
Rent comps 7 comps
| Address | Beds | Baths | Sqft | Rent | $/sqft | DOM | Units | Dist |
|---|---|---|---|---|---|---|---|---|
| 987 Queen St Honolulu, HI | 2.0 | 1.0–2.0 | 554 | $3,925 | $7.08 | 16d | 9 | 0.49mi |
| 987 Queen St Honolulu, HI | 2.0 | 1.0–2.0 | 554 | $4,000 | $7.22 | 15d | 8 | 0.49mi |
| 987 Queen St Honolulu, HI | 1.0 | 1.0 | 453 | $3,800 | $8.39 | 10d | 9 | 0.49mi |
| 1000 Auahi St Honolulu, HI | 2.0 | 1.0–2.0 | 629 | $4,425 | $7.03 | 23d | 2 | 0.60mi |
| 1568 Pensacola St Honolulu, HI | 1.0–2.0 | 1.0 | 523 | $2,280 | $4.36 | 23d | 1 | 0.68mi |
| 440 Olohana St Unit 1327703P Honolulu, HI | 1.0 | 1.0 | 355 | $4,055 | $11.42 | 11d | 1 | 1.38mi |
| 440 Olohana St Unit 1327711P Honolulu, HI | 1.0 | 1.0 | 355 | $3,741 | $10.54 | 1d | 1 | 1.38mi |
HOA detail condo
- Monthly dues
- $510 · $6,120/yr
- Assessments
- None detected in remarks — confirm with the listing agent.
Listing history 30 events
-
2026-06-18days on market $270,000 Active 35 DOM
-
2026-06-17days on market $270,000 Active 34 DOM
-
2026-06-16days on market $270,000 Active 33 DOM
-
2026-06-15days on market $270,000 Active 32 DOM
-
2026-06-13days on market $270,000 Active 30 DOM
-
2026-06-13days on market $270,000 Active 29 DOM
-
2026-06-10days on market $270,000 Active 27 DOM
-
2026-06-09days on market $270,000 Active 26 DOM
-
2026-06-08days on market $270,000 Active 25 DOM
-
2026-06-07days on market $270,000 Active 24 DOM
-
2026-06-05days on market $270,000 Active 21 DOM
-
2026-06-03days on market $270,000 Active 20 DOM
-
2026-06-02days on market $270,000 Active 19 DOM
-
2026-06-01days on market $270,000 Active 18 DOM
-
2026-05-31days on market $270,000 Active 17 DOM
-
2026-05-14$270,000 Active 566-char remark
-
2024-06-28historical $1,300
-
2024-06-13$1,300
-
2024-05-01historical $1,300
-
2024-04-12$1,300
-
2023-12-01historical $1,300
-
2023-11-06$1,300
-
2022-12-01historical
-
2005-03-24soldstatus $148,000
-
2004-11-21historical
-
2004-05-21$155,000
-
2003-09-16soldstatus $27,343
-
1989-10-16soldstatus $80,000
-
1989-10-10soldstatus $80,000
-
1979-11-01soldstatus $46,000
ⓘ Source: listings_history table (triggers on properties + properties_extension) + one-shot
backfill from property_details.listing_events for pre-trigger history.
Tax reassessment forecast HI · Partial reset (capped growth)
- Current annual tax
- $822 · $69/mo
- Projected year-2 tax
- $822 · $69/mo
- Expected delta
- $0/yr ($0/mo · 0.0%)
ⓘ Screening estimate from a state-policy table — verify with the county assessor before closing.
Climate risk First Street
- Flood 6/10 Major FEMA zone X (unshaded) · 73% chance over 30 yrs
- Air quality 1/10 Low
Nearby sold comps map
Loading sold comps map…
Walkable amenities ~0.75 mi
Loading nearby amenities…
Taxation est. · year 1
- Rental income
- $40,388
- − Mortgage interest
- −$15,124
- − Property taxes
- −$822
- − Insurance
- −$1,350
- − Repairs & maintenance
- −$3,231
- − Management
- −$3,231
- − HOA
- −$6,120
- − Depreciation
- −$7,855
- Taxable income
- $2,655
- Est. tax owed @ 24.0%
- −$637
- After-tax cash flow
- $5,986/yr
For passive investors: Depreciation is non-cash, so a rental often shows a tax loss while cash-flowing — sheltering income. Rental losses are passive: they offset passive income freely, and up to $25,000/yr can offset ordinary (W-2) income if you actively participate and your MAGI is under $100k (phasing out to $0 by $150k); unused losses carry forward. On sale, claimed depreciation is recaptured at up to 25%, and gains may owe capital-gains tax (a 1031 exchange can defer both). Figures are a year-1 estimate at your 24.0% rate — not tax advice; consult a CPA.
Schools (NCES district)
- District
- Hawaii Department Of Education
- NCES district ID
- 1500030
- Math proficiency
- 32% ▼ -10.00%
- Reading proficiency
- 50% ▼ -3.00%
- Median HH income
- $69,005
- Composite
- 37.07/100
- National rank
- #4504
- State rank
- #1 of 1 in HI
Livability — Urban Honolulu
No livability data for this city. (Only ~50 U.S. cities are tracked.)
Census & demographics
- Census place
- Urban Honolulu, HI
- County
- Honolulu County · 963,448 people
- City population
- 309,956
- Metro
- Urban Honolulu, HI
- Population (ZIP)
- 24,689
- Household income
- $77,768
- Rent vs Own
- Severe rent burden
- 1641.0
Population outlook (Honolulu County) Hauer SSP2
- Today (2025)
- 1,072,641 people
- By 2030
- 1,110,460 · +3.5%
- By 2040
- 1,181,593 · +10.2%
- By 2050
- 1,257,584 · +17.2%
- By 2075
- 1,501,120 · +39.9%
- By 2100
- 1,764,430 · +64.5%
Race, ethnicity, and origin ACS 2023
- Neighborhood character
- Diverse neighborhood (Simpson 0.58)
- Race & ethnicity
- Asian 64% Two or more races 14% White 13% Pacific Islander 6% Hispanic / Latino 5% Black 1%
- Hispanic origin (detail)
- Mexican 2% Puerto Rican 2%
- Common ancestry
- Russian 1% Lithuanian 1% Italian 1%
- Foreign-born
- 35% · China, South Korea, Vietnam
- Languages at home
- 58% English-only · Other Asian/Pacific 15% Chinese 10% Korean 9%
Political lean MEDSL · Honolulu
- 2024 margin
- Strong D (+21.6) · D 59.9% · R 38.3% · Other 1.8%
- 2008→2024 swing
- -19.4pp toward R · 2008: 41.1pp · 2024: 21.6pp
- All cycles
- 2024: D+21.6 2020: D+26.9 2016: D+29.9 2012: D+39.1 2008: D+41.1
Not yet ingested
- Civics
- —
Market trends
- HPI YoY
- ▲ 1.98%
- Current HPI
- 376.4197
- Rent YoY
- ▲ 3.10%
- Metro
- Urban Honolulu, HI
- State GDP YoY
- —
- F500 in state
- 0
Price history
+487.0% since first listed15 events — show timeline
- 2026-05-14 Listed $270,000 HiCentral MLS
- 2024-06-28 Rental Removed $1,300 APPFOLIO
- 2024-06-13 Listed for Rent $1,300 APPFOLIO
- 2024-05-01 Rental Removed $1,300 APPFOLIO
- 2024-04-12 Listed for Rent $1,300 APPFOLIO
- 2023-12-01 Rental Removed $1,300 APPFOLIO
- 2023-11-06 Listed for Rent $1,300 APPFOLIO
- 2022-12-01 Rental Removed — APPFOLIO
- 2005-03-24 Sold (Public Records) $148,000 Public Records
- 2004-11-21 Listing Removed — HiCentral MLS
- 2004-05-21 Listed $155,000 HiCentral MLS
- 2003-09-16 Sold (Public Records) $27,343 Public Records
- 1989-10-16 Sold (Public Records) $80,000 Public Records
- 1989-10-10 Sold (Public Records) $80,000 Public Records
- 1979-11-01 Sold (Public Records) $46,000 Public Records
Property tax history
+1.0%/yrLatest (2022): $822 · -1.3% YoY. Source: county tax records.
Cash-flow waterfall
monthlySold comps — $/sqft
last 12 mo · ≤1 miLoading sold comps…