 🏗️ New Construction
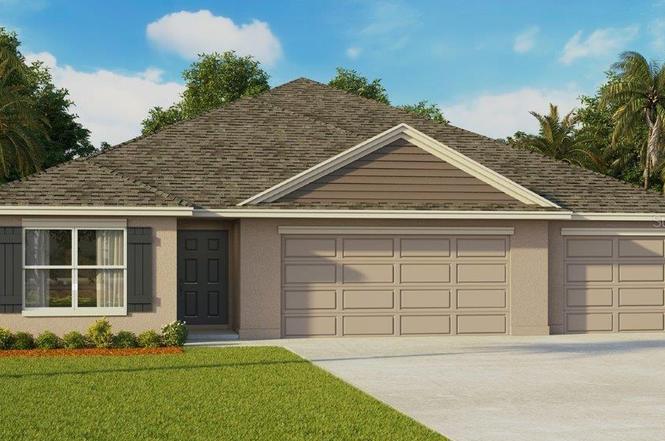
1370 16th Ave SE · Ruskin, FL
Flood risk No data
- FEMA flood zone
- —
- Chance of flooding over 30 yrs
- —
- Est. flood insurance / yr
- —
Fire risk No data
- Est. fire insurance / yr
- —
Heat risk No data
- Hot days now (above threshold)
- —
- Hot days in 30 yrs
- —
Wind risk No data
- Chance of severe wind over 30 yrs
- —
Air-quality risk No data
- Unhealthy air days now
- —
- Unhealthy air days in 30 yrs
- —
Risk factors via First Street. Map © Google.
Why this score? — see what drove the F grade
The composite is a weighted blend of 9 inputs, each scored 0–100. Each bar is that input's sub-score; the figure is the points it added to the 100-point composite (weight × sub-score).
- Cash flow +9.2/30.0
- ARV discount +7.5/15.0
- Schools +4.2/10.0
- Livability +3.6/5.0
- Rent growth +2.7/5.0
- DSCR +2.6/10.0
- Condition / age +2.5/5.0
- 1% rule +2.4/10.0
- Appreciation +0.0/10.0
$359,990
🖨 Deal sheet (PDF) 📄 Offer letter ✓ Due diligence
Listing remarks
Under Construction. Nicely tucked away in the quaint town of Ruskin, you will find Brookside. Ruskin is home to the Tomato festival and is also known for its rich agriculture. This location will give you the small-town feel, while being centrally located between Tampa and Sarasota and minutes to I-75, allows you easy access to many local attractions and gulf coast beaches. The community, consisting of 243 homesites, includes one and two-story, single-family, all concrete-constructed homes. Each home comes equipped with Home is Connected, America’s Smart home package, an energy-efficient appliances, quartz countertops in the kitchen, and a blinds package. Residents will enjoy amenities
Key facts
- Easy access
- Tot lot
- Clubhouse
Tags
Neighborhood map
What this means for you Summary
Snapshot
- This is a 4-bed/3.0-bath land listed at $360k.
Deal economics
- At list price, monthly cash flow is $-269 ($-3k/yr) — negative.
- To cash-flow at today's rent, offer at most $313k (13.2% below list).
- To meet the 1% rule (rent ≥ 1% of price), the offer needs to be $266k (26.0% below list).
- Recommended offer: $266k (26.0% below list) — sets the bar for 1% rule.
Location & tenants
- Location reads 71/100 on livability (#392 in FL) — a middle-class / working-renter tenant base. Strengths: cost of living A+, housing A+, commute B+; Watch: amenities F, health & safety F.
- Hillsborough (suburban): math 47% / reading 50% proficiency, ranked #41 of 73 in FL (top 56%) — families likely to look elsewhere, expect single-tenant / working-renter base with shorter leases.
- Zoned schools: Ruskin Elementary School (math 30% / reading 23%, grade F, #2,009 of 2,144 statewide, top 94%, 781 students, 77% FRL); Shields Middle School (math 29% / reading 27%, grade F, #486 of 571 statewide, top 86%, 1,867 students, 68% FRL); Lennard High School (math 30% / reading 46%, grade F, #328 of 667 statewide, top 50%, 2,404 students, 47% FRL).
- Zoned-school proficiency averages 31% at this address vs 48% district-wide (-18 pts) — the specific schools serving this property underperform the Hillsborough average; the district grade overstates school quality for this exact location.
- Market conditions: Rents flat; 497 active listings in the ZIP; 14 comparable units currently listed for rent nearby; rentals at typical pace (median 20d on market — plan ~3-4 weeks tenant-placement turnaround); 9,053 units permitted in Hillsborough County in 2024 (4,555 in 5+ unit buildings).
- This rent runs 44% of the median local income ($72k/yr) — at the standard rent-burdened threshold; future hikes will face affordability resistance.
Forward outlook
- Local home prices are declining (-3.0%/yr); year-one equity from $2k of loan paydown is wiped out by about $11k of value loss. Plan a longer hold.
- Hillsborough County population projected at +37% by 2050 — long-run rental-demand tailwind backs the buy-and-hold thesis.
Negotiation context
- It's been on market 114 days — a 9% lower offer ($328k) is reasonable based on typical stale-listing flexibility.
Questions for the listing agent
- What do current leases actually rent for vs. the listed asking? Can we see a recent rent roll and the last 12 months of T-12 income?
- It's been on market 114 days. Have you received any prior offers? Is the seller open to a 26% concession, seller financing, or rate buy-down credit?
- What does the HOA fee cover, when was the last increase, and are there any pending special assessments or reserve-fund shortfalls?
- Why hasn't it sold? Are there any deal-killer items the seller is aware of (foundation, flood, title, zoning, code violations)?
- Is there a deadline driving the sale (1031 exchange, divorce, estate, relocation)? That informs how much negotiation room exists.
- Schools are F-rated, which usually means shorter tenancies and higher turnover. Who's the typical renter profile here, and what's been the actual vacancy rate?
- The area grade is low — what's the realistic commute time and amenity access for the typical tenant pool here? Any planned neighborhood developments (good or bad) we should know about?
- What's the average days-on-market for RENTAL listings here right now (not sales)? A rising rental-DOM trend means longer vacancies and softer asking-rent achievability than the comps imply.
- What's the recent tenant-quality profile in this submarket — average credit score on applications, eviction rate, late-payment / NSF rate, and stable-employment percentage? A property-management company in the area should have these aggregated.
- How much new for-sale + rental construction is in the pipeline within 1–3 miles? Heavy new supply typically softens prices + rents 12–24 months out; constrained supply supports both.
Investment metrics
- 1% rule
- 0.74% ✗
- Cap rate
- 5.40%
- Cash-on-cash
- -3.20%
- DSCR
- 0.86
- GRM
- 11.3
CMA / ARV
No comps found within radius.
Projected returns pro-forma
-3.0% appreciation · 0.9% rent growth · sell at horizon
- IRR
- -23.9%
- Equity multiple
- 0.20×
- Total profit
- $-80,984
- Equity at exit
- $53,676
- IRR
- -25.7%
- Equity multiple
- -0.13×
- Total profit
- $-114,363
- Equity at exit
- $31,125
Cash invested: $100,797 (down + closing). Projections, not guarantees.
Landlord ↔ Tenant lean methodology
- Overall (STATE)
- 87 Strongly Landlord-Friendly
- State Florida
- 87 Strongly Landlord-Friendly · R+3
- County
- — inherits STATE
- City
- — inherits STATE
ZIP-level market 33570
- Home prices YoY
- -28.8%
- Rents YoY
- 0.9%
- Active inventory
- 497
- Price-to-rent
- 11.3×
Monthly cashflow live
- Estimated rent
- $2,665 high interval (Pro) →
- Mortgage (P&I)
- −$1,888
- Tax from tax record
- −$328 /mo · $3,936/yr
- Insurance
- −$150
- HOA
- −$8
- Vacancy / Maint / Mgmt
- −$560
- Net cashflow
- $-269
Break-even live
Sensitivity live
| Price | -10% $-65 | -5% $-167 | +0% $-269 | +5% $-370 | +10% $-472 |
|---|---|---|---|---|---|
| Rent | -10% $-479 | -5% $-374 | +0% $-269 | +5% $-163 | +10% $-58 |
| Rate | -1.0pp $-87 | -0.5pp $-177 | base $-269 | +0.5pp $-362 | +1.0pp $-457 |
UW: 25.0% down · 7.5% · 30yr · 1.5% tax · 5.0% vac · 8.0% maint · 8.0% mgmt
Financing live
Cash to close
- Down payment
- $89,998
- Closing costs
- $10,800
- Reserves months
- —
- Total cash needed
- —
Loan-product check · same deal, 3 products live
Conventional
25% down · 7.5% · 30yr
- Down + closing
- —
- Monthly P&I
- —
- Monthly cashflow
- —
- DSCR
- —
- Eligible?
- —
Personal DTI + credit; lowest rate.
DSCR
20% down · 8.5% · 30yr
- Down + closing
- —
- Monthly P&I
- —
- Monthly cashflow
- —
- DSCR
- —
- Eligible?
- —
No personal income docs; deal must DSCR.
Hard money
10% down · 12.0% · 12mo
- Down + closing
- —
- Monthly P&I
- —
- Monthly cashflow
- —
- DSCR
- —
- Eligible?
- —
Short-term bridge; refi at stabilization.
Rent comps 14 comps
| Address | Beds | Baths | Sqft | Rent | $/sqft | DOM | Units | Dist |
|---|---|---|---|---|---|---|---|---|
| 1863 Moon Cactus Ct Ruskin, FL | 5.0 | 2.5 | 2635 | $2,600 | $0.99 | 19d | 1 | 0.43mi |
| 1251 9th St SE Ruskin, FL | 3.0–4.0 | 2.0–2.5 | 1650 | $3,500 | $2.12 | 6d | 1 | 0.55mi |
| 1119 Windton Oak Dr Ruskin, FL | 4.0 | 2.5 | 2041 | $2,325 | $1.14 | 4d | 1 | 0.59mi |
| 1501 21st St SE Ruskin, FL | 4.0 | 2.0 | 1618 | $2,155 | $1.33 | 5d | 1 | 0.59mi |
| 1105 Windton Oak Dr Ruskin, FL | 4.0 | 2.5 | 2073 | $2,399 | $1.16 | 26d | 1 | 0.60mi |
| 2025 Peaceful Palm St Ruskin, FL | 4.0 | 2.0 | 1606 | $2,600 | $1.62 | 16d | 1 | 0.74mi |
| 2011 Sea Salt Ct Ruskin, FL | 5.0 | 2.5 | 2415 | $2,600 | $1.08 | 26d | 1 | 0.76mi |
| 2306 Lawrence Hall St Ruskin, FL | 4.0 | 2.0 | 1731 | $2,100 | $1.21 | 12d | 1 | 0.98mi |
| 2205 Roanoke Springs Dr Ruskin, FL | 4.0 | 3.0 | 1790 | $2,000 | $1.12 | 26d | 1 | 1.11mi |
| 2235 Colville Chase Dr Ruskin, FL | 4.0 | 3.0 | 1936 | $2,400 | $1.24 | 26d | 1 | 1.13mi |
| 2222 Roanoke Springs Dr Ruskin, FL | 4.0 | 3.0 | 1790 | $2,250 | $1.26 | 26d | 1 | 1.15mi |
| 2345 Roanoke Springs Dr Ruskin, FL | 4.0 | 3.0 | 1801 | $2,250 | $1.25 | 6d | 1 | 1.38mi |
| 2502 Cumberland Cliff Dr Ruskin, FL | 4.0 | 3.0 | 2283 | $2,695 | $1.18 | 19d | 1 | 1.43mi |
| 2502 Cumberland Cliff Dr Ruskin, FL | 4.0 | 3.0 | 2283 | $2,695 | $1.18 | 26d | 1 | 1.43mi |
HOA detail
- Monthly dues
- $8 · $96/yr
Listing history 4 events
-
2026-04-15status Pending
-
2026-04-08price $359,990
-
2025-12-31price $384,990
-
2025-12-22$389,990 Active
ⓘ Source: listings_history table (triggers on properties + properties_extension) + one-shot
backfill from property_details.listing_events for pre-trigger history.
Tax reassessment forecast FL · Resets to sale price
- Current annual tax
- $3,936 · $328/mo
- Projected year-2 tax
- $3,936 · $328/mo
- Expected delta
- $0/yr ($0/mo · 0.0%)
ⓘ Screening estimate from a state-policy table — verify with the county assessor before closing.
Nearby sold comps map
Loading sold comps map…
Walkable amenities ~0.75 mi
Loading nearby amenities…
Taxation est. · year 1
- Rental income
- $31,979
- − Mortgage interest
- −$20,165
- − Property taxes
- −$3,936
- − Insurance
- −$1,800
- − Repairs & maintenance
- −$2,558
- − Management
- −$2,558
- − HOA
- −$96
- − Depreciation
- −$10,472
- Taxable loss
- −$9,607
- Est. tax savings @ 24.0%
- +$2,306
- After-tax cash flow
- $-917/yr
For passive investors: Depreciation is non-cash, so a rental often shows a tax loss while cash-flowing — sheltering income. Rental losses are passive: they offset passive income freely, and up to $25,000/yr can offset ordinary (W-2) income if you actively participate and your MAGI is under $100k (phasing out to $0 by $150k); unused losses carry forward. On sale, claimed depreciation is recaptured at up to 25%, and gains may owe capital-gains tax (a 1031 exchange can defer both). Figures are a year-1 estimate at your 24.0% rate — not tax advice; consult a CPA.
Schools (NCES district)
- District
- Hillsborough
- NCES district ID
- 1200870
- Math proficiency
- 47% ▼ -8.00%
- Reading proficiency
- 50% ▼ -4.00%
- Median HH income
- $50,622
- Composite
- 41.6/100
- National rank
- #3435
- State rank
- #41 of 73 in FL
Livability — Ruskin
- Score
- 71/100
- State rank
- #392
- US rank
- #6879
Category grades
Schools grade is shown separately in the Schools card above.
Census & demographics
- Census place
- Ruskin, FL
- County
- Hillsborough County · 1,540,968 people
- City population
- 33,319
- Metro
- Tampa-St. Petersburg-Clearwater, FL
- Population (ZIP)
- 33,319
- Household income
- $72,172
- Rent vs Own
- Severe rent burden
- 611.0
Population outlook (Hillsborough County) Hauer SSP2
- Today (2025)
- 1,607,022 people
- By 2030
- 1,733,968 · +7.9%
- By 2040
- 1,979,565 · +23.2%
- By 2050
- 2,203,427 · +37.1%
- By 2075
- 2,667,893 · +66.0%
- By 2100
- 2,891,558 · +79.9%
Race, ethnicity, and origin ACS 2023
- Neighborhood character
- Diverse neighborhood (Simpson 0.69)
- Race & ethnicity
- White 40% Hispanic / Latino 32% Black 23% Two or more races 13% Asian 2%
- Hispanic origin (detail)
- Mexican 16% Puerto Rican 6% Cuban 1% Dominican 4%
- Common ancestry
- Italian 2% Romanian 2% Hispanic 2%
- Foreign-born
- 13% · Canada, Jamaica
- Languages at home
- 72% English-only · Spanish 23% French/Haitian/Cajun 2%
Political lean MEDSL · Hillsborough
- 2024 margin
- Toss-up / Even · D 47.8% · R 50.9% · Other 1.3%
- 2008→2024 swing
- -10.2pp toward R · 2008: 7.1pp · 2024: -3.1pp
- All cycles
- 2024: R+3.1 2020: D+6.9 2016: D+6.8 2012: D+6.7 2008: D+7.1
Not yet ingested
- Civics
- —
Market trends
- HPI YoY
- ▼ -112.10%
- Current HPI
- 277.8257
- Rent YoY
- ▲ 0.90%
- Metro
- Tampa-St. Petersburg-Clearwater, FL
- State GDP YoY
- ▲ 3.28%
- F500 in state
- 36
Industry mix (Fortune 500 HQ in FL)
| Industry | F500 HQs | Revenue |
|---|---|---|
| Industrial Technology | 2 | $29B |
|
||
| Insurance | 2 | $17B |
|
||
| Retail | 1 | $60B |
|
||
| Technology Distribution | 1 | $58B |
|
||
| Homebuilding | 1 | $35B |
|
||
| Technology Manufacturing | 1 | $35B |
|
||
Price history
-7.7% since first listed4 events — show timeline
- 2026-04-15 Pending — Stellar MLS as Distributed by MLS Grid
- 2026-04-08 Price Changed $359,990 Stellar MLS as Distributed by MLS Grid
- 2025-12-31 Price Changed $384,990 Stellar MLS as Distributed by MLS Grid
- 2025-12-22 Listed $389,990 Stellar MLS as Distributed by MLS Grid
Cash-flow waterfall
monthlySold comps — $/sqft
last 12 mo · ≤1 miLoading sold comps…