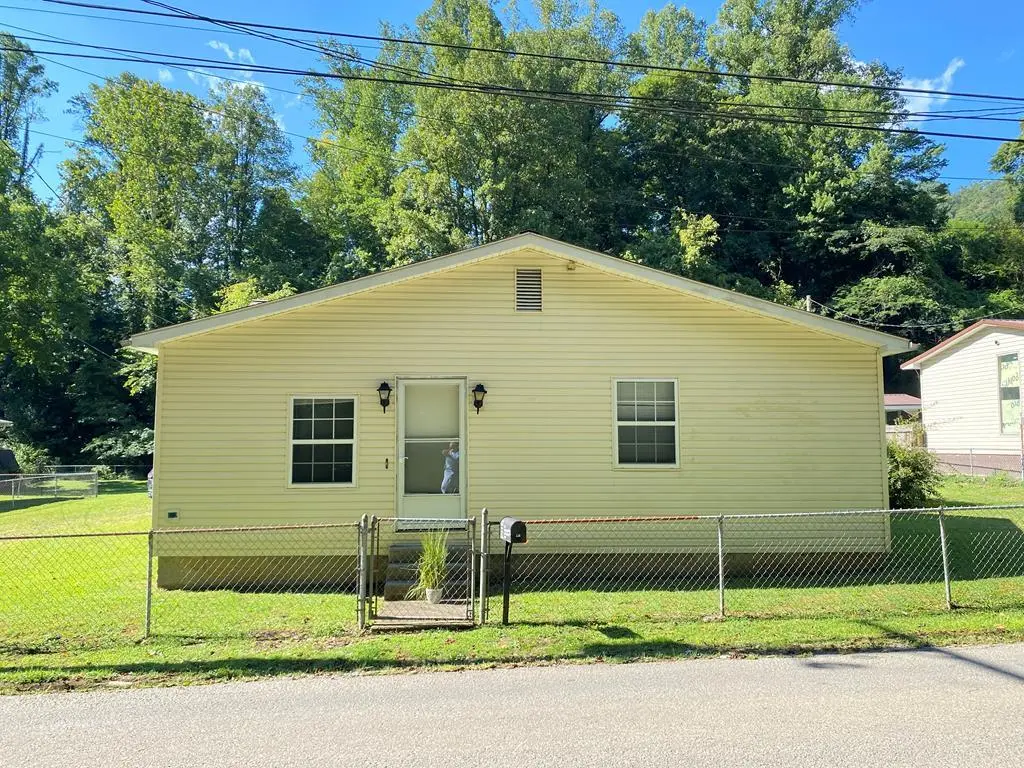
125 Dick Williamson Branch Rd · Williamson, WV
Flood risk 10/10 · Severe
- FEMA flood zone
- X (unshaded)
- Chance of flooding over 30 yrs
- 0.99%
- Est. flood insurance / yr
- $507 – $1,088
Fire risk 7/10 · Major
- Est. fire insurance / yr
- $787 – $1,461
Heat risk 4/10 · Minor
- Hot days now (above 102°F)
- 7 days/yr
- Hot days in 30 yrs
- 21 days/yr
Wind risk 2/10 · Minimal
- Chance of severe wind over 30 yrs
- 1.0%
Air-quality risk 1/10 · Minimal
- Unhealthy air days now
- 0 days/yr
- Unhealthy air days in 30 yrs
- 0 days/yr
Risk factors via First Street. Map © Google.
Why this score? — see what drove the C+ grade
The composite is a weighted blend of 9 inputs, each scored 0–100. Each bar is that input's sub-score; the figure is the points it added to the 100-point composite (weight × sub-score).
- Cash flow +25.0/30.0
- DSCR +8.1/10.0
- ARV discount +7.5/15.0
- 1% rule +6.5/10.0
- Appreciation +6.4/10.0
- Livability +3.0/5.0
- Rent growth +2.5/5.0
- Schools +2.3/10.0
- Condition / age +2.2/5.0
$93,000
🖨 Deal sheet 📄 Offer letter ✓ Due diligence
Listing remarks
This Spacious 3 Bedroom / 1.5 bath home sits on a generous 1/2 acre lot on Dick Williamson Branch Road between Williamson and Matewan. This fine home offer comfort, convenience and easy access to outdoor adventures. Inside you will find a beautiful kitchen and large living area and a separate reading room. A large basement provides room for storage. Outside is a large yard with a 2 car carport and a garage with a workshop. This property is perfectly located between the Devil Anse and Buffalo Mountain Trail Heads of the Hatfield MCCoy Trail System.
Key facts
- 2 car carport
- Garage with workshop
- 1/2 acre lot
Tags
Property features AI
Exterior
- Parking: Detached 1-car garage
- Utilities: Public water; Septic sewer
- Home design: Single family residence; Residential property
- Construction: Vinyl siding; Shingle roof
- Exterior features: Front porch; Storage structure
Interior
- Kitchen: Dishwasher; Microwave; Refrigerator; Cooktop
- Flooring: Carpet; Vinyl
- Heating & cooling: Central air; Ceiling fans; Electric heating
- Interior features: Insulated windows; Basement
Neighborhood map
What this means for you Summary
Snapshot
- This is a 3-bed/1.5-bath single-family listed at $93k. Condition is rated fair.
Deal economics
- At list price, monthly cash flow is $135 ($2k/yr) — positive.
- The deal already cash-flows at list — no discount required.
- Meets the 1% rule at list price ($1k rent vs $93k).
- Recommended offer: $87k (6.0% below list) — sets the bar for market timing.
Location & tenants
- Location reads 59/100 on livability (#228 in WV) — a working-class tenant base; expect higher turnover. Strengths: crime A+, cost of living A+; Watch: amenities F, commute F, employment F.
- Mingo County Schools (rural): math 21% / reading 36% proficiency, ranked #42 of 55 in WV (top 76%) — low school quality limits family demand, transient renter base, plan for 1-2y turnover.
- Zoned schools: Mingo Central Comprehensive High School (math 12% / reading 32%, grade F, #97 of 110 statewide, top 90%, 635 students, 0% FRL) — zoned schools average 0% FRL vs 55% district-wide (55 pts lower); this property's tenant base skews higher-income than the district average.
- Market conditions: 19 active listings in the ZIP.
Forward outlook
- In year one you build about $3k of equity ($643 loan paydown + $3k appreciation (2.7% local appreciation)).
- Mingo County population projected at -37% by 2050 — secular population decline; favor cash flow + early exit over multi-decade hold.
- At projected returns (2.7% appreciation + 3.0% rent growth), your $26k cash investment doubles in ~5 years — after that, you're playing with house money.
- By year 10, paydown + projected appreciation supports a ~$31k cash-out refi (75% LTV) — recoverable capital for the next deal without selling this one.
Negotiation context
- It's been on market 73 days — a 6% lower offer ($87k) is reasonable based on typical stale-listing flexibility.
- 2 sale attempts with the ask held roughly flat each time — persistent listings suggest the price (not the market) is what's stuck; bring a comps-based counter.
Risks & watch-outs
- Watch-outs: flood insurance adds $66/mo; built in 1920 — expect roof / HVAC / electrical / plumbing capex.
- Climate carrying-cost: severe flood risk; major wildfire risk — expect insurance premiums to compound above CPI over the hold.
Questions for the listing agent
- It's been on market 73 days. Have you received any prior offers? Is the seller open to a 6% concession, seller financing, or rate buy-down credit?
- Have any recent inspections been done? Can we get a copy of the seller's disclosures and any deferred-maintenance estimates?
- Built in 1920 — when were the roof, HVAC, electrical panel, plumbing, and water heater last replaced?
- What's the actual annual flood-insurance premium (NFIP or private), and is the property in a SFHA with mandatory coverage?
- Why hasn't it sold? Are there any deal-killer items the seller is aware of (foundation, flood, title, zoning, code violations)?
- Is there a deadline driving the sale (1031 exchange, divorce, estate, relocation)? That informs how much negotiation room exists.
- Schools are F-rated, which usually means shorter tenancies and higher turnover. Who's the typical renter profile here, and what's been the actual vacancy rate?
- What's the average days-on-market for RENTAL listings here right now (not sales)? A rising rental-DOM trend means longer vacancies and softer asking-rent achievability than the comps imply.
- What's the recent tenant-quality profile in this submarket — average credit score on applications, eviction rate, late-payment / NSF rate, and stable-employment percentage? A property-management company in the area should have these aggregated.
- How much new for-sale + rental construction is in the pipeline within 1–3 miles? Heavy new supply typically softens prices + rents 12–24 months out; constrained supply supports both.
Investment metrics
- 1% rule
- 1.15% ✓
- Cap rate
- 8.89%
- Cash-on-cash
- 9.29%
- DSCR
- 1.41
- GRM
- 7.3
CMA / ARV
No comps found within radius.
Projected returns pro-forma
2.73% appreciation · 3.0% rent growth · sell at horizon
- IRR
- 12.7%
- Equity multiple
- 1.71×
- Total profit
- $18,558
- Equity at exit
- $40,427
- IRR
- 14.9%
- Equity multiple
- 3.14×
- Total profit
- $55,740
- Equity at exit
- $61,242
Cash invested: $26,040 (down + closing). Projections, not guarantees.
Landlord ↔ Tenant lean methodology
- Overall (STATE)
- 83 Strongly Landlord-Friendly
- State West Virginia
- 83 Strongly Landlord-Friendly · R+22
- County
- — inherits STATE
- City
- — inherits STATE
ZIP-level market 25661
- Home prices YoY
- 2.1%
- Active inventory
- 19
- Price-to-rent
- 7.3×
Monthly cashflow live
- Estimated rent
- $1,069 medium interval (Pro) →
- Mortgage (P&I)
- −$488
- Tax est. 1.5%
- −$116 /mo · $1,395/yr
- Insurance
- −$39
- Flood insurance flood zone
- −$66 /mo · $798/yr
- HOA
- −$0
- Vacancy / Maint / Mgmt
- −$224
- Net cashflow
- $135
Break-even live
UW: 25.0% down · 7.5% · 30yr · 1.5% tax · 5.0% vac · 8.0% maint · 8.0% mgmt
Financing live
Cash to close
- Down payment
- $23,250
- Closing costs
- $2,790
- Reserves months
- —
- Total cash needed
- —
Loan-product check · same deal, 3 products live
Conventional
25% down · 7.5% · 30yr
- Down + closing
- —
- Monthly P&I
- —
- Monthly cashflow
- —
- DSCR
- —
- Eligible?
- —
Personal DTI + credit; lowest rate.
DSCR
20% down · 8.5% · 30yr
- Down + closing
- —
- Monthly P&I
- —
- Monthly cashflow
- —
- DSCR
- —
- Eligible?
- —
No personal income docs; deal must DSCR.
Hard money
10% down · 12.0% · 12mo
- Down + closing
- —
- Monthly P&I
- —
- Monthly cashflow
- —
- DSCR
- —
- Eligible?
- —
Short-term bridge; refi at stabilization.
Listing history 19 events
-
2026-06-18days on market $93,000 Active 73 DOM
-
2026-06-17days on market $93,000 Active 72 DOM
-
2026-06-16days on market $93,000 Active 71 DOM
-
2026-06-15days on market $93,000 Active 70 DOM
-
2026-06-15days on market $93,000 Active 69 DOM
-
2026-06-13days on market $93,000 Active 68 DOM
-
2026-06-12days on market $93,000 Active 67 DOM
-
2026-06-09days on market $93,000 Active 64 DOM
-
2026-06-08days on market $93,000 Active 63 DOM
-
2026-06-08days on market $93,000 Active 62 DOM
-
2026-06-07days on market $93,000 Active 61 DOM
-
2026-06-04days on market $93,000 Active 59 DOM
-
2026-06-03days on market $93,000 Active 58 DOM
-
2026-06-02days on market $93,000 Active 57 DOM
-
2026-06-01days on market $93,000 Active 56 DOM
-
2026-05-31days on market $93,000 Active 55 DOM
-
2026-04-06$93,000 Active
-
2025-10-26price $115,000
-
2025-08-25$125,000 Active
ⓘ Source: listings_history table (triggers on properties + properties_extension) + one-shot
backfill from property_details.listing_events for pre-trigger history.
Climate risk First Street
- Flood 10/10 Extreme FEMA zone X (unshaded) · 99% chance over 30 yrs
- Wildfire 7/10 Severe
- Heat 4/10 Moderate 7 d/yr ≥102°F today · 21 d/yr by 30 yrs out
- Wind 2/10 Low 100% chance of damaging wind over 30 yrs
- Air quality 1/10 Low 0 unhealthy d/yr today · 0 by 30 yrs out
Nearby sold comps map
Loading sold comps map…
Walkable amenities ~0.75 mi
Loading nearby amenities…
Taxation est. · year 1
- Rental income
- $12,824
- − Mortgage interest
- −$5,209
- − Property taxes
- −$1,395
- − Insurance
- −$1,262
- − Repairs & maintenance
- −$1,026
- − Management
- −$1,026
- − Depreciation
- −$2,705
- Taxable income
- $200
- Est. tax owed @ 24.0%
- −$48
- After-tax cash flow
- $1,573/yr
For passive investors: Depreciation is non-cash, so a rental often shows a tax loss while cash-flowing — sheltering income. Rental losses are passive: they offset passive income freely, and up to $25,000/yr can offset ordinary (W-2) income if you actively participate and your MAGI is under $100k (phasing out to $0 by $150k); unused losses carry forward. On sale, claimed depreciation is recaptured at up to 25%, and gains may owe capital-gains tax (a 1031 exchange can defer both). Figures are a year-1 estimate at your 24.0% rate — not tax advice; consult a CPA.
Condition & rehab AI · 12 photos
This 3-bedroom home requires moderate repairs and maintenance to improve its condition and value. Key updates include painting interior walls, replacing kitchen cabinets, and repairing bathroom walls.
Repairs flagged
- Minor kitchen cabinets — slight wear
- Minor bathroom walls — peeling paint
- Minor exterior siding — slight wear
Value-add opportunities
- Resale paint interior walls — enhances curb appeal
- Resale replace kitchen cabinets — modernizes kitchen
- Resale repair bathroom walls — improves bathroom appearance
Renovation cost estimate screening
| Repair item | Severity | Est. cost |
|---|---|---|
| kitchen cabinets · slight wear | Minor | $500–3,000 |
| bathroom walls · peeling paint | Minor | $500–3,000 |
| exterior siding · slight wear | Minor | $500–3,000 |
| Total estimated repair cost · 3 items | $1,500–9,000 |
Value-add ROI direction
- Resale paint interior walls — enhances curb appeal ↑
- Resale replace kitchen cabinets — modernizes kitchen ↑
- Resale repair bathroom walls — improves bathroom appearance ↑
ⓘ Cost ranges are severity-bucket heuristics (US national rule-of-thumb). Get contractor quotes + a written scope before underwriting a rehab budget.
Schools (NCES district)
- District
- Mingo County Schools
- NCES district ID
- 5400900
- Math proficiency
- 21% ▼ -14.00%
- Reading proficiency
- 36% ▼ -6.00%
- Median HH income
- $32,574
- Composite
- 23.24/100
- National rank
- #7937
- State rank
- #42 of 55 in WV
Livability — Williamson
- Score
- 59/100
- State rank
- #228
- US rank
- #19971
Category grades
Schools grade is shown separately in the Schools card above.
Census & demographics
- Population (ZIP)
- 4,485
Population outlook (Mingo County) Hauer SSP2
- Today (2025)
- 21,874 people
- By 2030
- 20,048 · -8.3%
- By 2040
- 16,653 · -23.9%
- By 2050
- 13,842 · -36.7%
- By 2075
- 8,629 · -60.6%
- By 2100
- 5,142 · -76.5%
Race, ethnicity, and origin ACS 2023
- Neighborhood character
- Predominantly White (88%)
- Race & ethnicity
- White 88% Two or more races 6% Black 6%
- Common ancestry
- Serbian 2% Lithuanian 1%
- Foreign-born
- 1%
- Languages at home
- 99% English-only · German/W. Germanic 1%
Political lean MEDSL · Mingo
- 2024 margin
- Solid R (+73.8) · D 12.5% · R 86.3% · Other 1.2%
- 2008→2024 swing
- -61.7pp toward R · 2008: -12.1pp · 2024: -73.8pp
- All cycles
- 2024: R+73.8 2020: R+71.3 2016: R+68.8 2012: R+42.5 2008: R+12.1
Not yet ingested
- Civics
- —
Market trends
- HPI YoY
- ▲ 2.73%
- Current HPI
- 134.3708
- Rent YoY
- —
- Metro
- —
- State GDP YoY
- —
- F500 in state
- 0
Price history
-25.6% since first listed3 events — show timeline
- 2026-04-06 Listed $93,000 EKAR
- 2025-10-26 Price Changed $115,000 EKAR
- 2025-08-25 Listed $125,000 EKAR
Cash-flow waterfall
monthlySold comps — $/sqft
last 12 mo · ≤1 miLoading sold comps…