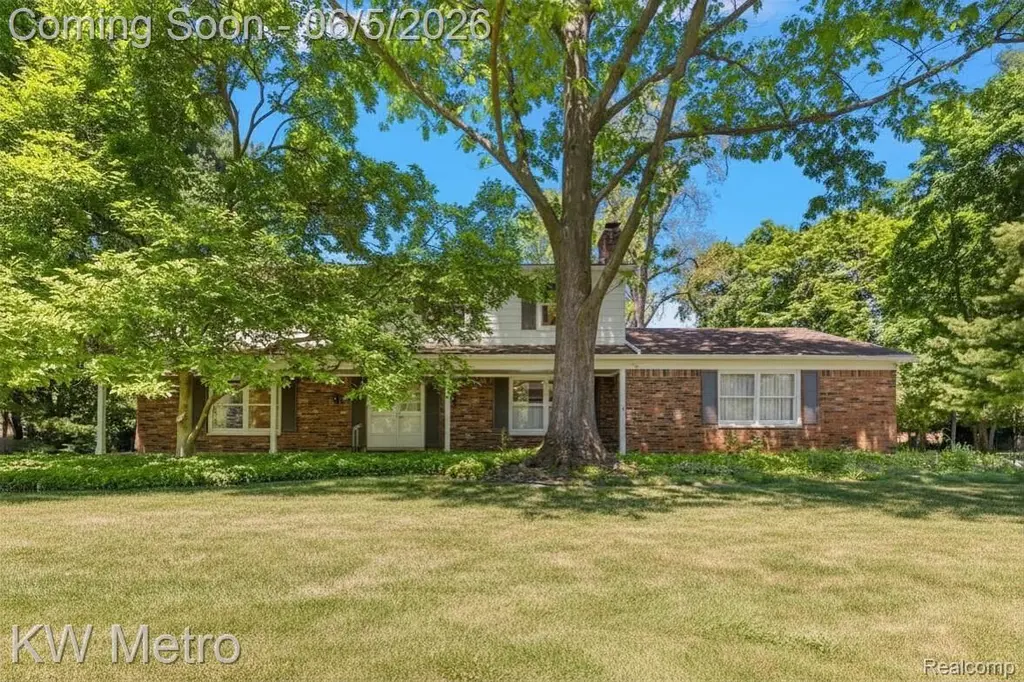
7036 Lindenmere Dr · Franklin, MI
Flood risk 1/10 · Minimal
- FEMA flood zone
- X (unshaded)
- Chance of flooding over 30 yrs
- 0.0%
- Est. flood insurance / yr
- $473 – $860
Fire risk 1/10 · Minimal
- Est. fire insurance / yr
- $784 – $1,456
Heat risk 2/10 · Minimal
- Hot days now (above 96°F)
- 7 days/yr
- Hot days in 30 yrs
- 14 days/yr
Wind risk 2/10 · Minimal
- Chance of severe wind over 30 yrs
- —
Air-quality risk 3/10 · Minor
- Unhealthy air days now
- 2 days/yr
- Unhealthy air days in 30 yrs
- 4 days/yr
Risk factors via First Street. Map © Google.
Why this score? — see what drove the C- grade
The composite is a weighted blend of 9 inputs, each scored 0–100. Each bar is that input's sub-score; the figure is the points it added to the 100-point composite (weight × sub-score).
- ARV discount +15.0/15.0
- Cash flow +14.2/30.0
- Schools +6.1/10.0
- DSCR +4.3/10.0
- 1% rule +3.7/10.0
- Livability +3.7/5.0
- Rent growth +2.5/5.0
- Condition / age +2.5/5.0
- Appreciation +0.0/10.0
$575,000
🖨 Deal sheet (PDF) 📄 Offer letter ✓ Due diligence
Listing remarks MLS
Meticulously maintained and lovingly cared for over the years, this classic Colonial in the desirable Meadow Lake Farms subdivision is ready to welcome its next owner. Situated on more than half an acre, this spacious 5-bedroom, 2-full and 2-half bath home offers over 2,800 square feet of comfortable living space. A welcoming front entrance and large foyer with beautiful original slate flooring set the tone for the home's timeless appeal. The sun-filled living room and formal dining room provide exceptional spaces for entertaining and are currently carpeted, with hardwood floors believed to be beneath the existing flooring. The spacious kitchen offers solid wood cabinetry, abundant counter space, newer appliances, and opens to a breakfast area overlooking the picturesque backyard. The generously sized family room is highlighted by pegged oak hardwood flooring, built-in bookcases, and a natural fireplace with an impressive hearth, creating a warm and inviting gathering space. A convenient door wall provides access to the composite deck and expansive backyard beyond. A first-floor laundry room and half bath complete the main level. Upstairs, you'll find five nicely sized bedrooms, including a large primary suite with a private full bath and walk-in closet. Two of the bedrooms share a Jack-and-Jill half bath, while a second full bath serves the remaining bedrooms. Hardwood flooring lies beneath the carpet throughout the upper level. The unfinished basement offers excellent potential for additional living space, a recreation room, home office, or other flexible uses. Outside, the beautifully maintained yard features a sprinkler system, gas grill hookup, and spacious deck, providing plenty of room to relax, entertain, and enjoy the outdoors. Experience the peaceful setting, spacious lots, and wonderful sense of community that make Meadow Lake Farms such a special place to call home. Please note: HOA is voluntary.
Key facts
- 0.52 acre lot
- 2 garage spots
- Built 1966
Property features AI
Finance
- Other: Lot frontage approximately 150 feet; Approximately 0.52 acre lot
- HOA & community: Association fee of $60 per year
Exterior
- Parking: Attached garage with electric in garage and side loading; Approximately 2.5 garage parking spaces
- Utilities: Public water; Septic sewer; Natural gas heat and gas water heater; Central A/C and ceiling fans
- Home design: Residential 2-story home; Built in 1966; Entry-level kitchen, dining, breakfast nook, family room and living room; Basement present
- Construction: Brick construction; Basement foundation
- Exterior features: Brick exterior; Deck; Lawn sprinkler; Paved street
Interior
- Kitchen: Dishwasher; Disposal; Microwave; Range/Oven; Refrigerator
- Bedrooms: Five bedrooms located on the second level
- Bathrooms: Two full bathrooms; Two additional lavatories (total of four baths/lavatories)
- Heating & cooling: Forced air heating (natural gas); Central air conditioning; Ceiling fans
- Interior features: Fireplace in family room (natural fireplace); Unfinished basement
- Laundry & utility: Washer and dryer; Laundry room on entry level (approx. 11 x 8); Gas water heater
Neighborhood map
What this means for you Summary
Snapshot
- This is a 5-bed/3.0-bath single-family listed at $575k.
Deal economics
- At list price, monthly cash flow is $98 ($1k/yr) — positive.
- The deal already cash-flows at list — no discount required.
- To meet the 1% rule (rent ≥ 1% of price), the offer needs to be $500k (13.0% below list).
- Recommended offer: $500k (13.0% below list) — sets the bar for 1% rule.
- Cap rate 6.5% vs local median 1.8% in Franklin — top-decile yield for the area; either an underpriced asset or a hidden risk that comps aren't pricing in. Stress-test before assuming the spread holds.
Location & tenants
- Location reads 73/100 on livability (#212 in MI) — a middle-class / working-renter tenant base. Strengths: crime A+, employment A+, housing A+; Watch: health & safety D, amenities F, cost of living F.
- Birmingham Public Schools (suburban): math 58% / reading 71% proficiency, ranked #18 of 540 in MI (top 3%) — acceptable for families but not a draw, mixed tenant base, ~2y average lease; only 6% free/reduced lunch — higher-income household profile.
- Market conditions: 89 active listings in the ZIP; 1 comparable units currently listed for rent nearby; 2,614 units permitted in Oakland County in 2024 (721 in 5+ unit buildings).
Forward outlook
- Local home prices are declining (-3.0%/yr); year-one equity from $4k of loan paydown is wiped out by about $17k of value loss. Plan a longer hold.
- Oakland County population projected at +10% by 2050 — modest demand growth; plan on rents tracking national, not racing it.
Negotiation context
- Only 14 days on market — expect competitive offers; lowballing is unlikely to land.
- 2 sale attempts with the ask held roughly flat each time — persistent listings suggest the price (not the market) is what's stuck; bring a comps-based counter.
Questions for the listing agent
- Built in 1966 — when were the roof, HVAC, electrical panel, plumbing, and water heater last replaced?
- What does the HOA fee cover, when was the last increase, and are there any pending special assessments or reserve-fund shortfalls?
- Is there a deadline driving the sale (1031 exchange, divorce, estate, relocation)? That informs how much negotiation room exists.
- Schools are B-rated — typically a magnet for longer-tenancy family renters. What's the average tenant stay here, and is there a school-zone premium baked into asking?
- What's the average days-on-market for RENTAL listings here right now (not sales)? A rising rental-DOM trend means longer vacancies and softer asking-rent achievability than the comps imply.
- What's the recent tenant-quality profile in this submarket — average credit score on applications, eviction rate, late-payment / NSF rate, and stable-employment percentage? A property-management company in the area should have these aggregated.
- How much new for-sale + rental construction is in the pipeline within 1–3 miles? Heavy new supply typically softens prices + rents 12–24 months out; constrained supply supports both.
Investment metrics
- 1% rule
- 0.87% ✗
- Cap rate
- 6.50%
- Cash-on-cash
- 0.73%
- DSCR
- 1.03
- GRM
- 9.6
CMA / ARV
- ARV (on-the-fly)
- $698,005
- Comps found
- 5
Show comp detail 5 sales within ~0.75 mi
| Address | Dist | Beds/Ba | Sqft | Sold | Price | $/sf | Match |
|---|---|---|---|---|---|---|---|
| 4887 WYE OAK Rd | 0.15mi | 4/3.5 (-1) | 2,500 (-12%) | 14mo | $1,625,000 | $650 | 54 |
| 6730 Halyard Rd | 0.33mi | 4/2.5 (-1) | 3,214 (+13%) | 3mo | $490,000 | $152 | 54 |
| 6895 Halyard Rd | 0.13mi | 5/3.5 | 3,244 (+14%) | 23mo | $750,000 | $231 | 50 |
| 7412 Lindenmere Dr | 0.47mi | 4/3.0 (-1) | 2,605 (-9%) | 11mo | $650,000 | $250 | 50 |
| 6760 Orinoco Cir | 0.66mi | 4/3.0 (-1) | 2,721 (-4%) | 13mo | $667,550 | $245 | 46 |
Match score weights: distance 35% · size 25% · config 20% · recency 20%. Top-matched comps best support the ARV.
Projected returns pro-forma
-3.0% appreciation · 3.0% rent growth · sell at horizon
- IRR
- -15.1%
- Equity multiple
- 0.46×
- Total profit
- $-86,938
- Equity at exit
- $85,734
- IRR
- -6.6%
- Equity multiple
- 0.58×
- Total profit
- $-67,671
- Equity at exit
- $49,715
Cash invested: $161,000 (down + closing). Projections, not guarantees.
Landlord ↔ Tenant lean methodology
- Overall (STATE)
- 62 Landlord-Friendly
- State Michigan
- 62 Landlord-Friendly · EVEN
- County
- — inherits STATE
- City
- — inherits STATE
ZIP-level market 48301
- Active inventory
- 89
- Price-to-rent
- 9.6×
Monthly cashflow live
- Estimated rent
- $5,000 medium interval (Pro) →
- Mortgage (P&I)
- −$3,015
- Tax from tax record
- −$592 /mo · $7,106/yr
- Insurance
- −$240
- HOA
- −$5
- Vacancy / Maint / Mgmt
- −$1,050
- Net cashflow
- $98
Break-even live
Sensitivity live
| Price | -10% $423 | -5% $261 | +0% $98 | +5% $-65 | +10% $-228 |
|---|---|---|---|---|---|
| Rent | -10% $-297 | -5% $-100 | +0% $98 | +5% $295 | +10% $493 |
| Rate | -1.0pp $387 | -0.5pp $244 | base $98 | +0.5pp $-51 | +1.0pp $-203 |
UW: 25.0% down · 7.5% · 30yr · 1.5% tax · 5.0% vac · 8.0% maint · 8.0% mgmt
Financing live
Cash to close
- Down payment
- $143,750
- Closing costs
- $17,250
- Reserves months
- —
- Total cash needed
- —
Loan-product check · same deal, 3 products live
Conventional
25% down · 7.5% · 30yr
- Down + closing
- —
- Monthly P&I
- —
- Monthly cashflow
- —
- DSCR
- —
- Eligible?
- —
Personal DTI + credit; lowest rate.
DSCR
20% down · 8.5% · 30yr
- Down + closing
- —
- Monthly P&I
- —
- Monthly cashflow
- —
- DSCR
- —
- Eligible?
- —
No personal income docs; deal must DSCR.
Hard money
10% down · 12.0% · 12mo
- Down + closing
- —
- Monthly P&I
- —
- Monthly cashflow
- —
- DSCR
- —
- Eligible?
- —
Short-term bridge; refi at stabilization.
Rent comps 1 comps
| Address | Beds | Baths | Sqft | Rent | $/sqft | DOM | Units | Dist |
|---|---|---|---|---|---|---|---|---|
| 5722 Raven Rd Bloomfield Hills, MI | 4.0 | 4.0 | 3473 | $5,000 | $1.44 | 0d | 1 | 1.29mi |
HOA detail
- Monthly dues
- $5 · $60/yr
- Likely covers
- gas
Listing history 11 events
-
2026-06-19status $575,000 Pending 14 DOM
-
2026-06-18days on market $575,000 Active Under Contract 14 DOM
-
2026-06-17days on market $575,000 Active Under Contract 13 DOM
-
2026-06-16days on market $575,000 Active Under Contract 12 DOM
-
2026-06-15days on market $575,000 Active Under Contract 11 DOM
-
2026-06-13statusdays on market $575,000 Active Under Contract 9 DOM
-
2026-06-09days on market $575,000 Active 5 DOM
-
2026-06-08days on market $575,000 Active 4 DOM
-
2026-06-07statusdays on market $575,000 Active 3 DOM
-
2026-06-04remarks 699-char remark
-
2026-06-04$575,000 Coming Soon 1 DOM
ⓘ Source: listings_history table (triggers on properties + properties_extension) + one-shot
backfill from property_details.listing_events for pre-trigger history.
Tax reassessment forecast MI · Partial reset (capped growth)
- Current annual tax
- $7,106 · $592/mo
- Projected year-2 tax
- $7,980 · $665/mo
- Expected delta
- +$875/yr (+$73/mo · 12.3%)
ⓘ Screening estimate from a state-policy table — verify with the county assessor before closing.
Climate risk First Street
- Flood 1/10 Low FEMA zone X (unshaded) · 0% chance over 30 yrs
- Wildfire 1/10 Low
- Heat 2/10 Low 7 d/yr ≥96°F today · 14 d/yr by 30 yrs out
- Wind 2/10 Low
- Air quality 3/10 Moderate 2 unhealthy d/yr today · 4 by 30 yrs out
Nearby sold comps map
Loading sold comps map…
Walkable amenities ~0.75 mi
Loading nearby amenities…
Taxation est. · year 1
- Rental income
- $60,000
- − Mortgage interest
- −$32,209
- − Property taxes
- −$7,106
- − Insurance
- −$2,875
- − Repairs & maintenance
- −$4,800
- − Management
- −$4,800
- − HOA
- −$60
- − Depreciation
- −$16,727
- Taxable loss
- −$8,577
- Est. tax savings @ 24.0%
- +$2,058
- After-tax cash flow
- $3,233/yr
For passive investors: Depreciation is non-cash, so a rental often shows a tax loss while cash-flowing — sheltering income. Rental losses are passive: they offset passive income freely, and up to $25,000/yr can offset ordinary (W-2) income if you actively participate and your MAGI is under $100k (phasing out to $0 by $150k); unused losses carry forward. On sale, claimed depreciation is recaptured at up to 25%, and gains may owe capital-gains tax (a 1031 exchange can defer both). Figures are a year-1 estimate at your 24.0% rate — not tax advice; consult a CPA.
Schools (NCES district)
- District
- Birmingham Public Schools
- NCES district ID
- 2605850
- Math proficiency
- 58% ▼ -8.00%
- Reading proficiency
- 71% ▼ -3.00%
- Median HH income
- $110,445
- Composite
- 60.54/100
- National rank
- #839
- State rank
- #18 of 540 in MI
Livability — Franklin
- Score
- 73/100
- State rank
- #212
- US rank
- #5253
Category grades
Schools grade is shown separately in the Schools card above.
Census & demographics
- Population (ZIP)
- 14,749
Population outlook (Oakland County) Hauer SSP2
- Today (2025)
- 1,335,747 people
- By 2030
- 1,375,100 · +2.9%
- By 2040
- 1,435,385 · +7.5%
- By 2050
- 1,469,250 · +10.0%
- By 2075
- 1,531,946 · +14.7%
- By 2100
- 1,450,485 · +8.6%
Race, ethnicity, and origin ACS 2023
- Neighborhood character
- Predominantly White (80%)
- Race & ethnicity
- White 80% Two or more races 10% Asian 5% Hispanic / Latino 4% Black 3%
- Common ancestry
- Romanian 9% Lithuanian 4% Scotch-Irish 3%
- Foreign-born
- 10% · Canada, China, South Korea
- Languages at home
- 87% English-only · Arabic 3% French/Haitian/Cajun 2% Spanish 2%
Political lean MEDSL · Oakland
- 2024 margin
- D (+10.6) · D 54.4% · R 43.8% · Other 1.9%
- 2008→2024 swing
- -3.9pp toward R · 2008: 14.5pp · 2024: 10.6pp
- All cycles
- 2024: D+10.6 2020: D+14.1 2016: D+8.1 2012: D+8.1 2008: D+14.5
Not yet ingested
- Civics
- —
Market trends
- HPI YoY
- ▼ -261.90%
- Current HPI
- 184.3337
- Rent YoY
- —
- Metro
- —
- State GDP YoY
- ▲ 1.37%
- F500 in state
- 28
Industry mix (Fortune 500 HQ in MI)
| Industry | F500 HQs | Revenue |
|---|---|---|
| Automotive Parts | 3 | $48B |
|
||
| Automotive | 2 | $372B |
|
||
| Chemicals | 1 | $45B |
|
||
| Automotive Retail | 1 | $29B |
|
||
| Healthcare / Medical Devices | 1 | $23B |
|
||
| Automotive Technology | 1 | $20B |
|
||
Price history
+0.0% since first listed3 events — show timeline
- 2026-06-05 Listed $575,000 MiRealSource-MiMLS
- 2026-06-05 Listed $575,000 REALCOMP
- 2026-06-03 Coming Soon $575,000 MiRealSource-MiMLS
Property tax history
+1.0%/yrLatest (2025): $7,106 · +2.1% YoY. Source: county tax records.
Cash-flow waterfall
monthlySold comps — $/sqft
last 12 mo · ≤1 miLoading sold comps…